Free Statistics

of Irreproducible Research!

Author's title

Author*The author of this computation has been verified*
R Software Modulerwasp_samplenorm.wasp
Title produced by softwareMinimum Sample Size - Testing Mean
Date of computationTue, 26 Oct 2010 15:00:45 +0000
Cite this page as followsStatistical Computations at FreeStatistics.org, Office for Research Development and Education, URL https://freestatistics.org/blog/index.php?v=date/2010/Oct/26/t128810516629slozu0qczbe67.htm/, Retrieved Sun, 28 Apr 2024 08:32:28 +0000
Statistical Computations at FreeStatistics.org, Office for Research Development and Education, URL https://freestatistics.org/blog/index.php?pk=89248, Retrieved Sun, 28 Apr 2024 08:32:28 +0000
QR Codes:

Original text written by user:
IsPrivate?No (this computation is public)
User-defined keywords
Estimated Impact149
Family? (F = Feedback message, R = changed R code, M = changed R Module, P = changed Parameters, D = changed Data)
-     [Maximum-likelihood Fitting - Normal Distribution] [Intrinsic Motivat...] [2010-10-12 11:57:21] [b98453cac15ba1066b407e146608df68]
-   PD  [Maximum-likelihood Fitting - Normal Distribution] [WS3 - Intr2 fitdi...] [2010-10-17 20:45:33] [b11c112f8986de933f8b95cd30e75cc2]
F RMPD    [Testing Mean with unknown Variance - Critical Value] [WS4 - Question 2] [2010-10-24 13:36:22] [b11c112f8986de933f8b95cd30e75cc2]
-    D      [Testing Mean with unknown Variance - Critical Value] [] [2010-10-24 15:15:58] [ed939ef6f97e5f2afb6796311d9e7a5f]
- RMPD        [Central Tendency] [] [2010-10-24 15:29:07] [74be16979710d4c4e7c6647856088456]
- RMPD          [Testing Mean with unknown Variance - Critical Value] [] [2010-10-24 16:52:23] [ed939ef6f97e5f2afb6796311d9e7a5f]
- RMPD            [Testing Variance - p-value (probability)] [] [2010-10-24 17:09:53] [ed939ef6f97e5f2afb6796311d9e7a5f]
- RM                [Minimum Sample Size - Testing Mean] [] [2010-10-24 17:22:15] [ed939ef6f97e5f2afb6796311d9e7a5f]
-   P                 [Minimum Sample Size - Testing Mean] [W4] [2010-10-26 09:13:54] [5ddc7dfb25e070b079c4c8fcccc4d42e]
F   P                     [Minimum Sample Size - Testing Mean] [ws4q11] [2010-10-26 15:00:45] [5f761c4a622da19727fd2adf71158b48] [Current]
Feedback Forum
2010-10-31 10:16:17 [48eb36e2c01435ad7e4ea7854a9d98fe] [reply
De student heeft hier met de correcte softwaremodule gewerkt, echter werden er gegevens foutief ingevuld. De 'power' is namelijk niet gelijk aan 0,05 maar aan 0,95. Indien we dit invullen krijgen we volgend resultaat: http://www.freestatistics.org/blog/date/2010/Oct/26/t1288044528d0rcid0goac0tw9.htm/

De minimale steekproef bij een tweezijdige test is dan gelijk aan 65 en bij een 1-zijdige test is deze gelijk aan 60

Post a new message


Summary of computational transaction
Raw Inputview raw input (R code)
Raw Outputview raw output of R engine
Computing time1 seconds
R Server'Gwilym Jenkins' @ 72.249.127.135

\begin{tabular}{lllllllll}
\hline
Summary of computational transaction \tabularnewline
Raw Input & view raw input (R code)  \tabularnewline
Raw Output & view raw output of R engine  \tabularnewline
Computing time & 1 seconds \tabularnewline
R Server & 'Gwilym Jenkins' @ 72.249.127.135 \tabularnewline
\hline
\end{tabular}
%Source: https://freestatistics.org/blog/index.php?pk=89248&T=0

[TABLE]
[ROW][C]Summary of computational transaction[/C][/ROW]
[ROW][C]Raw Input[/C][C]view raw input (R code) [/C][/ROW]
[ROW][C]Raw Output[/C][C]view raw output of R engine [/C][/ROW]
[ROW][C]Computing time[/C][C]1 seconds[/C][/ROW]
[ROW][C]R Server[/C][C]'Gwilym Jenkins' @ 72.249.127.135[/C][/ROW]
[/TABLE]
Source: https://freestatistics.org/blog/index.php?pk=89248&T=0

Globally Unique Identifier (entire table): ba.freestatistics.org/blog/index.php?pk=89248&T=0

As an alternative you can also use a QR Code:  

The GUIDs for individual cells are displayed in the table below:

Summary of computational transaction
Raw Inputview raw input (R code)
Raw Outputview raw output of R engine
Computing time1 seconds
R Server'Gwilym Jenkins' @ 72.249.127.135


Minimum Sample Size
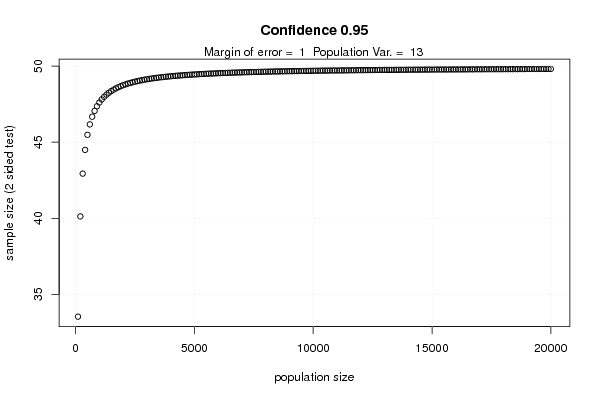
Population Size105
Margin of Error1
Confidence0.95
Power0.5
Population Variance13
z(alpha/2) + z(beta)1.95996398454005
z(alpha) + z(beta)1.64485362695147
Minimum Sample Size (2 sided test)34.0627943128074
Minimum Sample Size (1 sided test)26.5359777294951

\begin{tabular}{lllllllll}
\hline
Minimum Sample Size \tabularnewline
Population Size & 105 \tabularnewline
Margin of Error & 1 \tabularnewline
Confidence & 0.95 \tabularnewline
Power & 0.5 \tabularnewline
Population Variance & 13 \tabularnewline
z(alpha/2) + z(beta) & 1.95996398454005 \tabularnewline
z(alpha) + z(beta) & 1.64485362695147 \tabularnewline
Minimum Sample Size (2 sided test) & 34.0627943128074 \tabularnewline
Minimum Sample Size (1 sided test) & 26.5359777294951 \tabularnewline
\hline
\end{tabular}
%Source: https://freestatistics.org/blog/index.php?pk=89248&T=1

[TABLE]
[ROW][C]Minimum Sample Size[/C][/ROW]
[ROW][C]Population Size[/C][C]105[/C][/ROW]
[ROW][C]Margin of Error[/C][C]1[/C][/ROW]
[ROW][C]Confidence[/C][C]0.95[/C][/ROW]
[ROW][C]Power[/C][C]0.5[/C][/ROW]
[ROW][C]Population Variance[/C][C]13[/C][/ROW]
[ROW][C]z(alpha/2) + z(beta)[/C][C]1.95996398454005[/C][/ROW]
[ROW][C]z(alpha) + z(beta)[/C][C]1.64485362695147[/C][/ROW]
[ROW][C]Minimum Sample Size (2 sided test)[/C][C]34.0627943128074[/C][/ROW]
[ROW][C]Minimum Sample Size (1 sided test)[/C][C]26.5359777294951[/C][/ROW]
[/TABLE]
Source: https://freestatistics.org/blog/index.php?pk=89248&T=1

Globally Unique Identifier (entire table): ba.freestatistics.org/blog/index.php?pk=89248&T=1

As an alternative you can also use a QR Code:  

The GUIDs for individual cells are displayed in the table below:

Minimum Sample Size
Population Size105
Margin of Error1
Confidence0.95
Power0.5
Population Variance13
z(alpha/2) + z(beta)1.95996398454005
z(alpha) + z(beta)1.64485362695147
Minimum Sample Size (2 sided test)34.0627943128074
Minimum Sample Size (1 sided test)26.5359777294951


Minimum Sample Size (for Infinite Populations)
Population Sizeinfinite
Margin of Error1
Confidence0.95
Power0.5
Population Variance13
z(alpha/2) + z(beta)1.95996398454005
z(alpha) + z(beta)1.64485362695147
Minimum Sample Size (2 sided test)49.9389646690236
Minimum Sample Size (1 sided test)35.1720649032403

\begin{tabular}{lllllllll}
\hline
Minimum Sample Size (for Infinite Populations) \tabularnewline
Population Size & infinite \tabularnewline
Margin of Error & 1 \tabularnewline
Confidence & 0.95 \tabularnewline
Power & 0.5 \tabularnewline
Population Variance & 13 \tabularnewline
z(alpha/2) + z(beta) & 1.95996398454005 \tabularnewline
z(alpha) + z(beta) & 1.64485362695147 \tabularnewline
Minimum Sample Size (2 sided test) & 49.9389646690236 \tabularnewline
Minimum Sample Size (1 sided test) & 35.1720649032403 \tabularnewline
\hline
\end{tabular}
%Source: https://freestatistics.org/blog/index.php?pk=89248&T=2

[TABLE]
[ROW][C]Minimum Sample Size (for Infinite Populations)[/C][/ROW]
[ROW][C]Population Size[/C][C]infinite[/C][/ROW]
[ROW][C]Margin of Error[/C][C]1[/C][/ROW]
[ROW][C]Confidence[/C][C]0.95[/C][/ROW]
[ROW][C]Power[/C][C]0.5[/C][/ROW]
[ROW][C]Population Variance[/C][C]13[/C][/ROW]
[ROW][C]z(alpha/2) + z(beta)[/C][C]1.95996398454005[/C][/ROW]
[ROW][C]z(alpha) + z(beta)[/C][C]1.64485362695147[/C][/ROW]
[ROW][C]Minimum Sample Size (2 sided test)[/C][C]49.9389646690236[/C][/ROW]
[ROW][C]Minimum Sample Size (1 sided test)[/C][C]35.1720649032403[/C][/ROW]
[/TABLE]
Source: https://freestatistics.org/blog/index.php?pk=89248&T=2

Globally Unique Identifier (entire table): ba.freestatistics.org/blog/index.php?pk=89248&T=2

As an alternative you can also use a QR Code:  

The GUIDs for individual cells are displayed in the table below:

Minimum Sample Size (for Infinite Populations)
Population Sizeinfinite
Margin of Error1
Confidence0.95
Power0.5
Population Variance13
z(alpha/2) + z(beta)1.95996398454005
z(alpha) + z(beta)1.64485362695147
Minimum Sample Size (2 sided test)49.9389646690236
Minimum Sample Size (1 sided test)35.1720649032403


Minimum Sample Size (Unknown Population Variance)
Population Size105
Margin of Error1
Confidence0.95
Power0.5
Population Varianceunknown
t(alpha/2) + t(beta)2.0343685160221
t(alpha) + t(beta)1.70676309978817
Minimum Sample Size (2 sided test)35.799583472935
Minimum Sample Size (1 sided test)28.0278658796924

\begin{tabular}{lllllllll}
\hline
Minimum Sample Size (Unknown Population Variance) \tabularnewline
Population Size & 105 \tabularnewline
Margin of Error & 1 \tabularnewline
Confidence & 0.95 \tabularnewline
Power & 0.5 \tabularnewline
Population Variance & unknown \tabularnewline
t(alpha/2) + t(beta) & 2.0343685160221 \tabularnewline
t(alpha) + t(beta) & 1.70676309978817 \tabularnewline
Minimum Sample Size (2 sided test) & 35.799583472935 \tabularnewline
Minimum Sample Size (1 sided test) & 28.0278658796924 \tabularnewline
\hline
\end{tabular}
%Source: https://freestatistics.org/blog/index.php?pk=89248&T=3

[TABLE]
[ROW][C]Minimum Sample Size (Unknown Population Variance)[/C][/ROW]
[ROW][C]Population Size[/C][C]105[/C][/ROW]
[ROW][C]Margin of Error[/C][C]1[/C][/ROW]
[ROW][C]Confidence[/C][C]0.95[/C][/ROW]
[ROW][C]Power[/C][C]0.5[/C][/ROW]
[ROW][C]Population Variance[/C][C]unknown[/C][/ROW]
[ROW][C]t(alpha/2) + t(beta)[/C][C]2.0343685160221[/C][/ROW]
[ROW][C]t(alpha) + t(beta)[/C][C]1.70676309978817[/C][/ROW]
[ROW][C]Minimum Sample Size (2 sided test)[/C][C]35.799583472935[/C][/ROW]
[ROW][C]Minimum Sample Size (1 sided test)[/C][C]28.0278658796924[/C][/ROW]
[/TABLE]
Source: https://freestatistics.org/blog/index.php?pk=89248&T=3

Globally Unique Identifier (entire table): ba.freestatistics.org/blog/index.php?pk=89248&T=3

As an alternative you can also use a QR Code:  

The GUIDs for individual cells are displayed in the table below:

Minimum Sample Size (Unknown Population Variance)
Population Size105
Margin of Error1
Confidence0.95
Power0.5
Population Varianceunknown
t(alpha/2) + t(beta)2.0343685160221
t(alpha) + t(beta)1.70676309978817
Minimum Sample Size (2 sided test)35.799583472935
Minimum Sample Size (1 sided test)28.0278658796924


Minimum Sample Size(Infinite Population, Unknown Population Variance)
Population Sizeinfinite
Margin of Error1
Confidence0.95
Power0.5
Population Varianceunknown
t(alpha/2) + t(beta)2.00963863419992
t(alpha) + t(beta)1.69068586822280
Minimum Sample Size (2 sided test)52.5024167208958
Minimum Sample Size (1 sided test)37.1594431651079

\begin{tabular}{lllllllll}
\hline
Minimum Sample Size(Infinite Population, Unknown Population Variance) \tabularnewline
Population Size & infinite \tabularnewline
Margin of Error & 1 \tabularnewline
Confidence & 0.95 \tabularnewline
Power & 0.5 \tabularnewline
Population Variance & unknown \tabularnewline
t(alpha/2) + t(beta) & 2.00963863419992 \tabularnewline
t(alpha) + t(beta) & 1.69068586822280 \tabularnewline
Minimum Sample Size (2 sided test) & 52.5024167208958 \tabularnewline
Minimum Sample Size (1 sided test) & 37.1594431651079 \tabularnewline
\hline
\end{tabular}
%Source: https://freestatistics.org/blog/index.php?pk=89248&T=4

[TABLE]
[ROW][C]Minimum Sample Size(Infinite Population, Unknown Population Variance)[/C][/ROW]
[ROW][C]Population Size[/C][C]infinite[/C][/ROW]
[ROW][C]Margin of Error[/C][C]1[/C][/ROW]
[ROW][C]Confidence[/C][C]0.95[/C][/ROW]
[ROW][C]Power[/C][C]0.5[/C][/ROW]
[ROW][C]Population Variance[/C][C]unknown[/C][/ROW]
[ROW][C]t(alpha/2) + t(beta)[/C][C]2.00963863419992[/C][/ROW]
[ROW][C]t(alpha) + t(beta)[/C][C]1.69068586822280[/C][/ROW]
[ROW][C]Minimum Sample Size (2 sided test)[/C][C]52.5024167208958[/C][/ROW]
[ROW][C]Minimum Sample Size (1 sided test)[/C][C]37.1594431651079[/C][/ROW]
[/TABLE]
Source: https://freestatistics.org/blog/index.php?pk=89248&T=4

Globally Unique Identifier (entire table): ba.freestatistics.org/blog/index.php?pk=89248&T=4

As an alternative you can also use a QR Code:  

The GUIDs for individual cells are displayed in the table below:

Minimum Sample Size(Infinite Population, Unknown Population Variance)
Population Sizeinfinite
Margin of Error1
Confidence0.95
Power0.5
Population Varianceunknown
t(alpha/2) + t(beta)2.00963863419992
t(alpha) + t(beta)1.69068586822280
Minimum Sample Size (2 sided test)52.5024167208958
Minimum Sample Size (1 sided test)37.1594431651079


Parameters (Session):
par1 = 13 ; par2 = 20 ; par3 = 21 ; par4 = 0.05 ; par5 = 0.05 ;
Parameters (R input):
par1 = 105 ; par2 = 1 ; par3 = 0.95 ; par4 = 13 ; par5 = 0.50 ;
R code (references can be found in the software module):
par1 <- as.numeric(par1)
par2 <- as.numeric(par2)
par3 <- as.numeric(par3)
par4 <- as.numeric(par4)
par5 <- as.numeric(par5)
(z <- abs(qnorm((1-par3)/2)) + abs(qnorm(1-par5)))
(z1 <- abs(qnorm(1-par3)) + abs(qnorm(1-par5)))
z2 <- z*z
z2one <- z1*z1
z24 <- z2 * par4
z24one <- z2one * par4
npop <- array(NA, 200)
ppop <- array(NA, 200)
for (i in 1:200)
{
ppop[i] <- i * 100
npop[i] <- ppop[i] * z24 / (z24 + (ppop[i] - 1) * par2*par2)
}
bitmap(file='pic1.png')
plot(ppop,npop, xlab='population size', ylab='sample size (2 sided test)', main = paste('Confidence',par3))
dumtext <- paste('Margin of error = ',par2)
dumtext <- paste(dumtext,' Population Var. = ')
dumtext <- paste(dumtext, par4)
mtext(dumtext)
grid()
dev.off()
par2sq <- par2 * par2
num <- par1 * z24
denom <- z24 + (par1 - 1) * par2sq
(n <- num/denom)
num1 <- par1 * z24one
denom1 <- z24one + (par1 - 1) * par2sq
(n1 <- num1/denom1)
load(file='createtable')
a<-table.start()
a<-table.row.start(a)
a<-table.element(a,'Minimum Sample Size',2,TRUE)
a<-table.row.end(a)
a<-table.row.start(a)
a<-table.element(a,'Population Size',header=TRUE)
a<-table.element(a,par1)
a<-table.row.end(a)
a<-table.row.start(a)
a<-table.element(a,'Margin of Error',header=TRUE)
a<-table.element(a,par2)
a<-table.row.end(a)
a<-table.row.start(a)
a<-table.element(a,'Confidence',header=TRUE)
a<-table.element(a,par3)
a<-table.row.end(a)
a<-table.row.start(a)
a<-table.element(a,'Power',header=TRUE)
a<-table.element(a,par5)
a<-table.row.end(a)
a<-table.row.start(a)
a<-table.element(a,'Population Variance',header=TRUE)
a<-table.element(a,par4)
a<-table.row.end(a)
a<-table.row.start(a)
a<-table.element(a,'z(alpha/2) + z(beta)',header=TRUE)
a<-table.element(a,z)
a<-table.row.end(a)
a<-table.row.start(a)
a<-table.element(a,'z(alpha) + z(beta)',header=TRUE)
a<-table.element(a,z1)
a<-table.row.end(a)
a<-table.row.start(a)
a<-table.element(a,'Minimum Sample Size (2 sided test)',header=TRUE)
a<-table.element(a,n)
a<-table.row.end(a)
a<-table.row.start(a)
a<-table.element(a,'Minimum Sample Size (1 sided test)',header=TRUE)
a<-table.element(a,n1)
a<-table.row.end(a)
a<-table.end(a)
table.save(a,file='mytable.tab')
(ni <- z24 / (par2sq))
(ni1 <- z24one / (par2sq))
a<-table.start()
a<-table.row.start(a)
a<-table.element(a,'Minimum Sample Size (for Infinite Populations)',2,TRUE)
a<-table.row.end(a)
a<-table.row.start(a)
a<-table.element(a,'Population Size',header=TRUE)
a<-table.element(a,'infinite')
a<-table.row.end(a)
a<-table.row.start(a)
a<-table.element(a,'Margin of Error',header=TRUE)
a<-table.element(a,par2)
a<-table.row.end(a)
a<-table.row.start(a)
a<-table.element(a,'Confidence',header=TRUE)
a<-table.element(a,par3)
a<-table.row.end(a)
a<-table.row.start(a)
a<-table.element(a,'Power',header=TRUE)
a<-table.element(a,par5)
a<-table.row.end(a)
a<-table.row.start(a)
a<-table.element(a,'Population Variance',header=TRUE)
a<-table.element(a,par4)
a<-table.row.end(a)
a<-table.row.start(a)
a<-table.element(a,'z(alpha/2) + z(beta)',header=TRUE)
a<-table.element(a,z)
a<-table.row.end(a)
a<-table.row.start(a)
a<-table.element(a,'z(alpha) + z(beta)',header=TRUE)
a<-table.element(a,z1)
a<-table.row.end(a)
a<-table.row.start(a)
a<-table.element(a,'Minimum Sample Size (2 sided test)',header=TRUE)
a<-table.element(a,ni)
a<-table.row.end(a)
a<-table.row.start(a)
a<-table.element(a,'Minimum Sample Size (1 sided test)',header=TRUE)
a<-table.element(a,ni1)
a<-table.row.end(a)
a<-table.end(a)
table.save(a,file='mytable.tab')
(z <- abs(qt((1-par3)/2,n-1)) + abs(qt(1-par5,n-1)))
(z1 <- abs(qt(1-par3,n1-1)) + abs(qt(1-par5,n1-1)))
z2 <- z*z
z2one <- z1*z1
z24 <- z2 * par4
z24one <- z2one * par4
par2sq <- par2 * par2
num <- par1 * z24
denom <- z24 + (par1 - 1) * par2sq
(n <- num/denom)
num1 <- par1 * z24one
denom1 <- z24one + (par1 - 1) * par2sq
(n1 <- num1/denom1)
a<-table.start()
a<-table.row.start(a)
a<-table.element(a,'Minimum Sample Size (Unknown Population Variance)',2,TRUE)
a<-table.row.end(a)
a<-table.row.start(a)
a<-table.element(a,'Population Size',header=TRUE)
a<-table.element(a,par1)
a<-table.row.end(a)
a<-table.row.start(a)
a<-table.element(a,'Margin of Error',header=TRUE)
a<-table.element(a,par2)
a<-table.row.end(a)
a<-table.row.start(a)
a<-table.element(a,'Confidence',header=TRUE)
a<-table.element(a,par3)
a<-table.row.end(a)
a<-table.row.start(a)
a<-table.element(a,'Power',header=TRUE)
a<-table.element(a,par5)
a<-table.row.end(a)
a<-table.row.start(a)
a<-table.element(a,'Population Variance',header=TRUE)
a<-table.element(a,'unknown')
a<-table.row.end(a)
a<-table.row.start(a)
a<-table.element(a,'t(alpha/2) + t(beta)',header=TRUE)
a<-table.element(a,z)
a<-table.row.end(a)
a<-table.row.start(a)
a<-table.element(a,'t(alpha) + t(beta)',header=TRUE)
a<-table.element(a,z1)
a<-table.row.end(a)
a<-table.row.start(a)
a<-table.element(a,'Minimum Sample Size (2 sided test)',header=TRUE)
a<-table.element(a,n)
a<-table.row.end(a)
a<-table.row.start(a)
a<-table.element(a,'Minimum Sample Size (1 sided test)',header=TRUE)
a<-table.element(a,n1)
a<-table.row.end(a)
a<-table.end(a)
table.save(a,file='mytable.tab')
(z <- abs(qt((1-par3)/2,ni-1)) + abs(qt(1-par5,ni-1)))
(z1 <- abs(qt(1-par3,ni1-1)) + abs(qt(1-par5,ni1-1)))
z2 <- z*z
z2one <- z1*z1
z24 <- z2 * par4
z24one <- z2one * par4
(ni <- z24 / (par2sq))
(ni1 <- z24one / (par2sq))
a<-table.start()
a<-table.row.start(a)
a<-table.element(a,'Minimum Sample Size
(Infinite Population, Unknown Population Variance)',2,TRUE)
a<-table.row.end(a)
a<-table.row.start(a)
a<-table.element(a,'Population Size',header=TRUE)
a<-table.element(a,'infinite')
a<-table.row.end(a)
a<-table.row.start(a)
a<-table.element(a,'Margin of Error',header=TRUE)
a<-table.element(a,par2)
a<-table.row.end(a)
a<-table.row.start(a)
a<-table.element(a,'Confidence',header=TRUE)
a<-table.element(a,par3)
a<-table.row.end(a)
a<-table.row.start(a)
a<-table.element(a,'Power',header=TRUE)
a<-table.element(a,par5)
a<-table.row.end(a)
a<-table.row.start(a)
a<-table.element(a,'Population Variance',header=TRUE)
a<-table.element(a,'unknown')
a<-table.row.end(a)
a<-table.row.start(a)
a<-table.element(a,'t(alpha/2) + t(beta)',header=TRUE)
a<-table.element(a,z)
a<-table.row.end(a)
a<-table.row.start(a)
a<-table.element(a,'t(alpha) + t(beta)',header=TRUE)
a<-table.element(a,z1)
a<-table.row.end(a)
a<-table.row.start(a)
a<-table.element(a,'Minimum Sample Size (2 sided test)',header=TRUE)
a<-table.element(a,ni)
a<-table.row.end(a)
a<-table.row.start(a)
a<-table.element(a,'Minimum Sample Size (1 sided test)',header=TRUE)
a<-table.element(a,ni1)
a<-table.row.end(a)
a<-table.end(a)
table.save(a,file='mytable.tab')