Free Statistics

of Irreproducible Research!

Author's title

Author*The author of this computation has been verified*
R Software Modulerwasp_notchedbox1.wasp
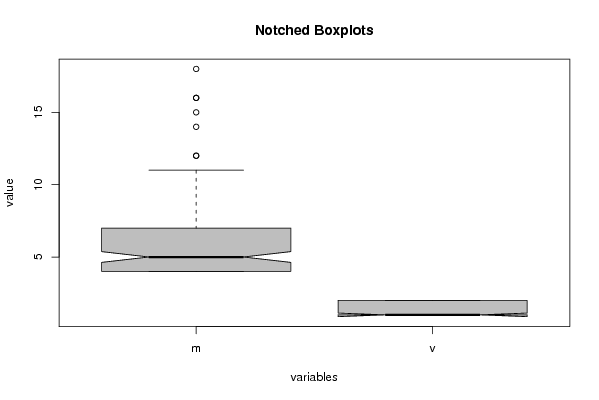
Title produced by softwareNotched Boxplots
Date of computationTue, 19 Oct 2010 18:10:05 +0000
Cite this page as followsStatistical Computations at FreeStatistics.org, Office for Research Development and Education, URL https://freestatistics.org/blog/index.php?v=date/2010/Oct/19/t12875117792fmruvnxor4xpgc.htm/, Retrieved Mon, 29 Apr 2024 03:03:02 +0000
Statistical Computations at FreeStatistics.org, Office for Research Development and Education, URL https://freestatistics.org/blog/index.php?pk=86837, Retrieved Mon, 29 Apr 2024 03:03:02 +0000
QR Codes:

Original text written by user:
IsPrivate?No (this computation is public)
User-defined keywords
Estimated Impact103
Family? (F = Feedback message, R = changed R code, M = changed R Module, P = changed Parameters, D = changed Data)
-     [Notched Boxplots] [Academic Motivati...] [2010-10-12 12:51:42] [b98453cac15ba1066b407e146608df68]
F   PD    [Notched Boxplots] [Boxplot M-V] [2010-10-19 18:10:05] [0605ea080d54454c99180f574351b8e4] [Current]
Feedback Forum
2010-10-22 14:50:48 [fdcf25e53512b12c51e15d5bc1f6edd1] [reply
Je kan al de gegevens naast elkaar van zowel de mannen als de vrouwen opnemen in 1 excel-blad. Naast deze kolommen maak je dan de gegevens die je zal ingeven in de software. Je gebruik de IF-functie in excel. Voor de gegevens van de mannen als volgt: als de eerste cel = 1 en dus een man is, laat je excel de waarde ingeven, als de eerste cel = 2 en dus een vrouwen is, laat je NA ingeven. De software negeert deze NA en schiet die waarde dus over. Dezelfde werkwijze gebruik je voor de mannen. (Hopelijk is deze uitleg een beetje duidelijk, als je de excel-file voor je ziet zal je het beter begrijpen).
  2010-10-26 17:17:53 [fdcf25e53512b12c51e15d5bc1f6edd1] [reply
Even mijn vorige uitleg verbeteren.. De software negeert de NA's niet, je moet hiervoor nog even een aparte kolom maken in excel met de if-functie

Post a new message
Dataseries X:
4	1
4	1
6	1
8	2
8	1
4	1
4	2
8	1
5	1
4	1
4	2
4	2
4	1
4	1
4	1
8	2
4	1
4	2
4	2
8	1
4	2
7	1
4	1
4	2
5	1
4	1
4	1
4	1
4	2
4	1
4	2
4	1
15	1
10	2
4	2
8	2
4	1
4	2
4	2
4	1
7	1
4	1
6	1
5	2
4	2
16	1
5	2
12	2
6	1
9	2
9	1
4	1
5	1
4	1
4	2
5	1
4	1
4	1
4	2
5	2
4	1
6	1
4	1
4	2
18	1
4	2
6	2
4	2
4	1
5	1
4	1
4	2
5	2
10	1
5	1
8	1
8	1
5	2
4	2
4	2
4	2
5	1
4	1
4	1
8	2
4	2
5	1
14	1
8	1
8	1
4	1
4	2
6	1
4	1
7	1
7	1
4	2
6	1
4	2
7	2
4	1
4	2
8	1
4	1
4	2
10	1
8	2
6	1
4	1
4	1
4	1
5	1
4	1
6	1
4	1
5	2
7	1
8	1
5	2
8	1
10	1
8	1
5	1
12	1
4	1
5	2
4	1
6	1
4	2
4	2
7	1
7	2
10	2
4	2
5	2
8	1
11	1
7	2
4	2
8	1
6	1
7	1
5	1
4	2
8	1
4	1
8	2
6	2
4	2
9	2
5	1
6	1
4	1
4	2
4	2
5	2
6	1
16	1
6	1
6	1
4	2
4	1


Summary of computational transaction
Raw Inputview raw input (R code)
Raw Outputview raw output of R engine
Computing time2 seconds
R Server'George Udny Yule' @ 72.249.76.132

\begin{tabular}{lllllllll}
\hline
Summary of computational transaction \tabularnewline
Raw Input & view raw input (R code)  \tabularnewline
Raw Output & view raw output of R engine  \tabularnewline
Computing time & 2 seconds \tabularnewline
R Server & 'George Udny Yule' @ 72.249.76.132 \tabularnewline
\hline
\end{tabular}
%Source: https://freestatistics.org/blog/index.php?pk=86837&T=0

[TABLE]
[ROW][C]Summary of computational transaction[/C][/ROW]
[ROW][C]Raw Input[/C][C]view raw input (R code) [/C][/ROW]
[ROW][C]Raw Output[/C][C]view raw output of R engine [/C][/ROW]
[ROW][C]Computing time[/C][C]2 seconds[/C][/ROW]
[ROW][C]R Server[/C][C]'George Udny Yule' @ 72.249.76.132[/C][/ROW]
[/TABLE]
Source: https://freestatistics.org/blog/index.php?pk=86837&T=0

Globally Unique Identifier (entire table): ba.freestatistics.org/blog/index.php?pk=86837&T=0

As an alternative you can also use a QR Code:  

The GUIDs for individual cells are displayed in the table below:

Summary of computational transaction
Raw Inputview raw input (R code)
Raw Outputview raw output of R engine
Computing time2 seconds
R Server'George Udny Yule' @ 72.249.76.132


\begin{tabular}{lllllllll}
\hline
Boxplot statistics \tabularnewline
Variable & lower whisker & lower hinge & median & upper hinge & upper whisker \tabularnewline
m & 4 & 4 & 5 & 7 & 11 \tabularnewline
v & 1 & 1 & 1 & 2 & 2 \tabularnewline
\hline
\end{tabular}
%Source: https://freestatistics.org/blog/index.php?pk=86837&T=1

[TABLE]
[ROW][C]Boxplot statistics[/C][/ROW]
[ROW][C]Variable[/C][C]lower whisker[/C][C]lower hinge[/C][C]median[/C][C]upper hinge[/C][C]upper whisker[/C][/ROW]
[ROW][C]m[/C][C]4[/C][C]4[/C][C]5[/C][C]7[/C][C]11[/C][/ROW]
[ROW][C]v[/C][C]1[/C][C]1[/C][C]1[/C][C]2[/C][C]2[/C][/ROW]
[/TABLE]
Source: https://freestatistics.org/blog/index.php?pk=86837&T=1

Globally Unique Identifier (entire table): ba.freestatistics.org/blog/index.php?pk=86837&T=1

As an alternative you can also use a QR Code:  

The GUIDs for individual cells are displayed in the table below:

Boxplot statistics
Variablelower whiskerlower hingemedianupper hingeupper whisker
m445711
v11122


Boxplot Notches
Variablelower boundmedianupper bound
m4.6275904285750955.37240957142491
v0.87586347619169511.12413652380830

\begin{tabular}{lllllllll}
\hline
Boxplot Notches \tabularnewline
Variable & lower bound & median & upper bound \tabularnewline
m & 4.62759042857509 & 5 & 5.37240957142491 \tabularnewline
v & 0.875863476191695 & 1 & 1.12413652380830 \tabularnewline
\hline
\end{tabular}
%Source: https://freestatistics.org/blog/index.php?pk=86837&T=2

[TABLE]
[ROW][C]Boxplot Notches[/C][/ROW]
[ROW][C]Variable[/C][C]lower bound[/C][C]median[/C][C]upper bound[/C][/ROW]
[ROW][C]m[/C][C]4.62759042857509[/C][C]5[/C][C]5.37240957142491[/C][/ROW]
[ROW][C]v[/C][C]0.875863476191695[/C][C]1[/C][C]1.12413652380830[/C][/ROW]
[/TABLE]
Source: https://freestatistics.org/blog/index.php?pk=86837&T=2

Globally Unique Identifier (entire table): ba.freestatistics.org/blog/index.php?pk=86837&T=2

As an alternative you can also use a QR Code:  

The GUIDs for individual cells are displayed in the table below:

Boxplot Notches
Variablelower boundmedianupper bound
m4.6275904285750955.37240957142491
v0.87586347619169511.12413652380830


Parameters (Session):
par1 = 8 ; par2 = 0 ;
Parameters (R input):
par1 = grey ;
R code (references can be found in the software module):
z <- as.data.frame(t(y))
bitmap(file='test1.png')
(r<-boxplot(z ,xlab=xlab,ylab=ylab,main=main,notch=TRUE,col=par1))
dev.off()
load(file='createtable')
a<-table.start()
a<-table.row.start(a)
a<-table.element(a,hyperlink('overview.htm','Boxplot statistics','Boxplot overview'),6,TRUE)
a<-table.row.end(a)
a<-table.row.start(a)
a<-table.element(a,'Variable',1,TRUE)
a<-table.element(a,hyperlink('lower_whisker.htm','lower whisker','definition of lower whisker'),1,TRUE)
a<-table.element(a,hyperlink('lower_hinge.htm','lower hinge','definition of lower hinge'),1,TRUE)
a<-table.element(a,hyperlink('central_tendency.htm','median','definitions about measures of central tendency'),1,TRUE)
a<-table.element(a,hyperlink('upper_hinge.htm','upper hinge','definition of upper hinge'),1,TRUE)
a<-table.element(a,hyperlink('upper_whisker.htm','upper whisker','definition of upper whisker'),1,TRUE)
a<-table.row.end(a)
for (i in 1:length(y[,1]))
{
a<-table.row.start(a)
a<-table.element(a,dimnames(t(x))[[2]][i],1,TRUE)
for (j in 1:5)
{
a<-table.element(a,r$stats[j,i])
}
a<-table.row.end(a)
}
a<-table.end(a)
table.save(a,file='mytable.tab')
a<-table.start()
a<-table.row.start(a)
a<-table.element(a,'Boxplot Notches',4,TRUE)
a<-table.row.end(a)
a<-table.row.start(a)
a<-table.element(a,'Variable',1,TRUE)
a<-table.element(a,'lower bound',1,TRUE)
a<-table.element(a,'median',1,TRUE)
a<-table.element(a,'upper bound',1,TRUE)
a<-table.row.end(a)
for (i in 1:length(y[,1]))
{
a<-table.row.start(a)
a<-table.element(a,dimnames(t(x))[[2]][i],1,TRUE)
a<-table.element(a,r$conf[1,i])
a<-table.element(a,r$stats[3,i])
a<-table.element(a,r$conf[2,i])
a<-table.row.end(a)
}
a<-table.end(a)
table.save(a,file='mytable1.tab')