Free Statistics

of Irreproducible Research!

Author's title

Author*The author of this computation has been verified*
R Software Modulerwasp_notchedbox1.wasp
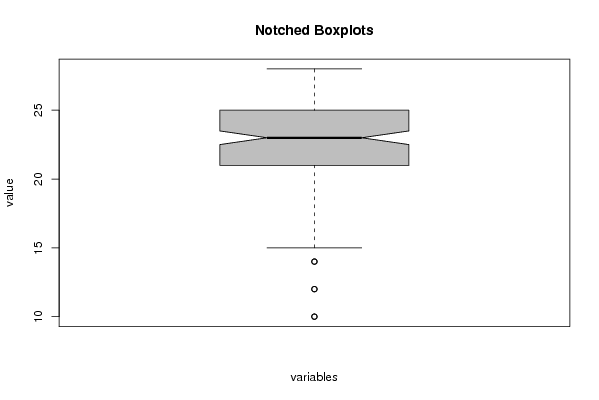
Title produced by softwareNotched Boxplots
Date of computationTue, 19 Oct 2010 17:32:59 +0000
Cite this page as followsStatistical Computations at FreeStatistics.org, Office for Research Development and Education, URL https://freestatistics.org/blog/index.php?v=date/2010/Oct/19/t1287509536smc9rhn0ggr6tcv.htm/, Retrieved Mon, 29 Apr 2024 03:35:07 +0000
Statistical Computations at FreeStatistics.org, Office for Research Development and Education, URL https://freestatistics.org/blog/index.php?pk=86805, Retrieved Mon, 29 Apr 2024 03:35:07 +0000
QR Codes:

Original text written by user:
IsPrivate?No (this computation is public)
User-defined keywords
Estimated Impact96
Family? (F = Feedback message, R = changed R code, M = changed R Module, P = changed Parameters, D = changed Data)
-     [Notched Boxplots] [Academic Motivati...] [2010-10-12 12:51:42] [b98453cac15ba1066b407e146608df68]
F   PD    [Notched Boxplots] [] [2010-10-19 17:32:59] [27f38de572a508a633f0ad2411de6a3e] [Current]
Feedback Forum
2010-10-25 21:41:51 [Naoual Ahidar] [reply
Deze opdracht werd verkeerd gemaakt. Hier zijn verkeerde data gebruikt. De student moest een Notched Boxplot voor zowel de intrinsieke motivatie, de extrinsieke motivatie als de amotivatie maken.

Bij intrinsieke motivatie categorie 1 & 2 (i.e. to know & toward accomplishment) zien we dat de vrouwen hoger scoren dan de mannen. Dit berust niet op toeval aangezien de “inkepingen” (notches) elkaar niet overlappen zoals we kunnen zien aan de tabel. Voor de derde categorie (i.e. to experience stimulation) zien we dat mannen en vrouwen vrijwel hetzelfde scoren.

Bij de extrinsieke motivatie zien we dat mannen en vrouwen niet verschillen, behalve dan door toeval.

Bij de amotivatie zien we dat mannen gemiddeld een hogere score toekennen dan vrouwen.

Zo kunnen we concluderen dat:
Vrouwen zijn meer intrinsiek gemotiveerd dan mannen op het vlak van kennisvergaring en de wil om iets te bereiken.
Qua extrinsieke motivatie zien we geen verschil tussen de geslachten.
Mannen zijn “ongemotiveerder” dan vrouwen. Vrouwen zijn dus meer gemotiveerd dan mannen.

Post a new message
Dataseries X:
23
20
20
21
24
22
23
20
25
23
27
27
22
24
25
22
28
28
27
25
16
28
21
24
27
14
14
27
20
21
22
21
12
20
24
19
28
23
27
22
27
26
22
21
19
24
19
26
22
28
21
23
28
10
24
21
21
24
24
25
25
23
21
16
17
25
24
23
25
23
28
26
22
19
26
18
18
25
27
12
15
21
23
22
21
24
27
22
28
26
10
19
22
21
24
25
21
20
21
24
23
18
24
24
19
20
18
20
27
23
26
23
17
21
25
23
27
24
20
27
21
24
21
15
25
25
22
24
21
22
23
22
20
23
25
23
22
25
26
22
24
24
25
20
26
21
26
21
22
16
26
28
18
25
23
21
20
25
22
21
16
18


Summary of computational transaction
Raw Inputview raw input (R code)
Raw Outputview raw output of R engine
Computing time1 seconds
R Server'Gwilym Jenkins' @ 72.249.127.135

\begin{tabular}{lllllllll}
\hline
Summary of computational transaction \tabularnewline
Raw Input & view raw input (R code)  \tabularnewline
Raw Output & view raw output of R engine  \tabularnewline
Computing time & 1 seconds \tabularnewline
R Server & 'Gwilym Jenkins' @ 72.249.127.135 \tabularnewline
\hline
\end{tabular}
%Source: https://freestatistics.org/blog/index.php?pk=86805&T=0

[TABLE]
[ROW][C]Summary of computational transaction[/C][/ROW]
[ROW][C]Raw Input[/C][C]view raw input (R code) [/C][/ROW]
[ROW][C]Raw Output[/C][C]view raw output of R engine [/C][/ROW]
[ROW][C]Computing time[/C][C]1 seconds[/C][/ROW]
[ROW][C]R Server[/C][C]'Gwilym Jenkins' @ 72.249.127.135[/C][/ROW]
[/TABLE]
Source: https://freestatistics.org/blog/index.php?pk=86805&T=0

Globally Unique Identifier (entire table): ba.freestatistics.org/blog/index.php?pk=86805&T=0

As an alternative you can also use a QR Code:  

The GUIDs for individual cells are displayed in the table below:

Summary of computational transaction
Raw Inputview raw input (R code)
Raw Outputview raw output of R engine
Computing time1 seconds
R Server'Gwilym Jenkins' @ 72.249.127.135


\begin{tabular}{lllllllll}
\hline
Boxplot statistics \tabularnewline
Variable & lower whisker & lower hinge & median & upper hinge & upper whisker \tabularnewline
 & 15 & 21 & 23 & 25 & 28 \tabularnewline
\hline
\end{tabular}
%Source: https://freestatistics.org/blog/index.php?pk=86805&T=1

[TABLE]
[ROW][C]Boxplot statistics[/C][/ROW]
[ROW][C]Variable[/C][C]lower whisker[/C][C]lower hinge[/C][C]median[/C][C]upper hinge[/C][C]upper whisker[/C][/ROW]
[ROW][C][/C][C]15[/C][C]21[/C][C]23[/C][C]25[/C][C]28[/C][/ROW]
[/TABLE]
Source: https://freestatistics.org/blog/index.php?pk=86805&T=1

Globally Unique Identifier (entire table): ba.freestatistics.org/blog/index.php?pk=86805&T=1

As an alternative you can also use a QR Code:  

The GUIDs for individual cells are displayed in the table below:

Boxplot statistics
Variablelower whiskerlower hingemedianupper hingeupper whisker
1521232528


Boxplot Notches
Variablelower boundmedianupper bound
22.50345390476682323.4965460952332

\begin{tabular}{lllllllll}
\hline
Boxplot Notches \tabularnewline
Variable & lower bound & median & upper bound \tabularnewline
 & 22.5034539047668 & 23 & 23.4965460952332 \tabularnewline
\hline
\end{tabular}
%Source: https://freestatistics.org/blog/index.php?pk=86805&T=2

[TABLE]
[ROW][C]Boxplot Notches[/C][/ROW]
[ROW][C]Variable[/C][C]lower bound[/C][C]median[/C][C]upper bound[/C][/ROW]
[ROW][C][/C][C]22.5034539047668[/C][C]23[/C][C]23.4965460952332[/C][/ROW]
[/TABLE]
Source: https://freestatistics.org/blog/index.php?pk=86805&T=2

Globally Unique Identifier (entire table): ba.freestatistics.org/blog/index.php?pk=86805&T=2

As an alternative you can also use a QR Code:  

The GUIDs for individual cells are displayed in the table below:

Boxplot Notches
Variablelower boundmedianupper bound
22.50345390476682323.4965460952332


Parameters (Session):
par1 = grey ;
Parameters (R input):
par1 = grey ;
R code (references can be found in the software module):
z <- as.data.frame(t(y))
bitmap(file='test1.png')
(r<-boxplot(z ,xlab=xlab,ylab=ylab,main=main,notch=TRUE,col=par1))
dev.off()
load(file='createtable')
a<-table.start()
a<-table.row.start(a)
a<-table.element(a,hyperlink('overview.htm','Boxplot statistics','Boxplot overview'),6,TRUE)
a<-table.row.end(a)
a<-table.row.start(a)
a<-table.element(a,'Variable',1,TRUE)
a<-table.element(a,hyperlink('lower_whisker.htm','lower whisker','definition of lower whisker'),1,TRUE)
a<-table.element(a,hyperlink('lower_hinge.htm','lower hinge','definition of lower hinge'),1,TRUE)
a<-table.element(a,hyperlink('central_tendency.htm','median','definitions about measures of central tendency'),1,TRUE)
a<-table.element(a,hyperlink('upper_hinge.htm','upper hinge','definition of upper hinge'),1,TRUE)
a<-table.element(a,hyperlink('upper_whisker.htm','upper whisker','definition of upper whisker'),1,TRUE)
a<-table.row.end(a)
for (i in 1:length(y[,1]))
{
a<-table.row.start(a)
a<-table.element(a,dimnames(t(x))[[2]][i],1,TRUE)
for (j in 1:5)
{
a<-table.element(a,r$stats[j,i])
}
a<-table.row.end(a)
}
a<-table.end(a)
table.save(a,file='mytable.tab')
a<-table.start()
a<-table.row.start(a)
a<-table.element(a,'Boxplot Notches',4,TRUE)
a<-table.row.end(a)
a<-table.row.start(a)
a<-table.element(a,'Variable',1,TRUE)
a<-table.element(a,'lower bound',1,TRUE)
a<-table.element(a,'median',1,TRUE)
a<-table.element(a,'upper bound',1,TRUE)
a<-table.row.end(a)
for (i in 1:length(y[,1]))
{
a<-table.row.start(a)
a<-table.element(a,dimnames(t(x))[[2]][i],1,TRUE)
a<-table.element(a,r$conf[1,i])
a<-table.element(a,r$stats[3,i])
a<-table.element(a,r$conf[2,i])
a<-table.row.end(a)
}
a<-table.end(a)
table.save(a,file='mytable1.tab')