Free Statistics

of Irreproducible Research!

Author's title

Author*Unverified author*
R Software Modulerwasp_centraltendency.wasp
Title produced by softwareCentral Tendency
Date of computationTue, 19 Oct 2010 16:52:56 +0000
Cite this page as followsStatistical Computations at FreeStatistics.org, Office for Research Development and Education, URL https://freestatistics.org/blog/index.php?v=date/2010/Oct/19/t12875070992z37zfcf3clgqu6.htm/, Retrieved Mon, 29 Apr 2024 07:07:29 +0000
Statistical Computations at FreeStatistics.org, Office for Research Development and Education, URL https://freestatistics.org/blog/index.php?pk=86752, Retrieved Mon, 29 Apr 2024 07:07:29 +0000
QR Codes:

Original text written by user:
IsPrivate?No (this computation is public)
User-defined keywordsKDGP1W52
Estimated Impact79
Family? (F = Feedback message, R = changed R code, M = changed R Module, P = changed Parameters, D = changed Data)
-       [Central Tendency] [] [2010-10-19 16:52:56] [e682c8b2f32588f1ce8624d4caf1be78] [Current]
Feedback Forum

Post a new message
Dataseries X:
6715
7703
9856
8326
9269
7035
10342
11682
10304
11385
9777
8882
7897
6930
9545
9110
7459
7320
10017
12307
11072
10749
9589
9080
7384
8062
8511
8684
8306
7643
10577
13747
11783
11611
9946
8693
7303
7609
9423
8584
7586
6843
11811
13414
12103
11501
8213
7982
7687
7180
7862
8043
8340
6692
10065
12684
11587
9843
8110
7940
6475
6121
9669
7778
7826
7403
10741
14023
11519
10236
8075
8157


Summary of computational transaction
Raw Inputview raw input (R code)
Raw Outputview raw output of R engine
Computing time2 seconds
R Server'Sir Ronald Aylmer Fisher' @ 193.190.124.24

\begin{tabular}{lllllllll}
\hline
Summary of computational transaction \tabularnewline
Raw Input & view raw input (R code)  \tabularnewline
Raw Output & view raw output of R engine  \tabularnewline
Computing time & 2 seconds \tabularnewline
R Server & 'Sir Ronald Aylmer Fisher' @ 193.190.124.24 \tabularnewline
\hline
\end{tabular}
%Source: https://freestatistics.org/blog/index.php?pk=86752&T=0

[TABLE]
[ROW][C]Summary of computational transaction[/C][/ROW]
[ROW][C]Raw Input[/C][C]view raw input (R code) [/C][/ROW]
[ROW][C]Raw Output[/C][C]view raw output of R engine [/C][/ROW]
[ROW][C]Computing time[/C][C]2 seconds[/C][/ROW]
[ROW][C]R Server[/C][C]'Sir Ronald Aylmer Fisher' @ 193.190.124.24[/C][/ROW]
[/TABLE]
Source: https://freestatistics.org/blog/index.php?pk=86752&T=0

Globally Unique Identifier (entire table): ba.freestatistics.org/blog/index.php?pk=86752&T=0

As an alternative you can also use a QR Code:  

The GUIDs for individual cells are displayed in the table below:

Summary of computational transaction
Raw Inputview raw input (R code)
Raw Outputview raw output of R engine
Computing time2 seconds
R Server'Sir Ronald Aylmer Fisher' @ 193.190.124.24


Central Tendency - Ungrouped Data
MeasureValueS.E.Value/S.E.
Arithmetic Mean9218.41666666667223.3493746866741.2735279854663
Geometric Mean9035.89592401272
Harmonic Mean8863.7890559486
Quadratic Mean9408.5618882779
Winsorized Mean ( 1 / 24 )9219.5221.30646720253141.6594242208144
Winsorized Mean ( 2 / 24 )9216.27777777778217.69819834865442.3351127739582
Winsorized Mean ( 3 / 24 )9186.81944444445209.82979942952443.7822438443976
Winsorized Mean ( 4 / 24 )9172.98611111111203.93984957084644.9788804415319
Winsorized Mean ( 5 / 24 )9164.86111111111199.97860341880345.8292084974597
Winsorized Mean ( 6 / 24 )9149.27777777778193.74275514974347.22384468367
Winsorized Mean ( 7 / 24 )9160.65277777778191.10363533044347.9355233715874
Winsorized Mean ( 8 / 24 )9163.09722222222186.99913609773649.0007462784912
Winsorized Mean ( 9 / 24 )9156.34722222222185.03067161017149.4855644339503
Winsorized Mean ( 10 / 24 )9161.90277777778183.17959747053950.0159564945615
Winsorized Mean ( 11 / 24 )9154.41666666667180.85804957547350.6165840456357
Winsorized Mean ( 12 / 24 )9160.75179.04441046680451.1646801825096
Winsorized Mean ( 13 / 24 )9162.73611111111172.1980164898653.2104625702856
Winsorized Mean ( 14 / 24 )9106.34722222222160.83732895341156.6183688915898
Winsorized Mean ( 15 / 24 )9046.13888888889148.66866314997160.8476507235658
Winsorized Mean ( 16 / 24 )9054.13888888889147.09176192524861.5543574322689
Winsorized Mean ( 17 / 24 )9019.19444444445140.44081985174264.220605191323
Winsorized Mean ( 18 / 24 )8979.19444444445129.00433179102469.603821203384
Winsorized Mean ( 19 / 24 )8981.83333333333125.86659386933971.3599459333688
Winsorized Mean ( 20 / 24 )8972.94444444445121.8004953865373.669194989471
Winsorized Mean ( 21 / 24 )8933.27777777778113.33308171441078.8232142163832
Winsorized Mean ( 22 / 24 )8931.75109.59527862918781.4975801121906
Winsorized Mean ( 23 / 24 )8922.48611111111104.74904803660985.1796391313533
Winsorized Mean ( 24 / 24 )8912.8194444444598.096488713721290.8576806500697
Trimmed Mean ( 1 / 24 )9194.02857142857214.53024609412242.8565609690059
Trimmed Mean ( 2 / 24 )9167.05882352941206.41599541145144.4106029925473
Trimmed Mean ( 3 / 24 )9140.21212121212199.01275159757745.9277711997797
Trimmed Mean ( 4 / 24 )9122.734375193.80946763032147.0706332695831
Trimmed Mean ( 5 / 24 )9108.14516129032189.70076752274148.0132225094895
Trimmed Mean ( 6 / 24 )9094.53333333333185.92865478573548.914102798269
Trimmed Mean ( 7 / 24 )9083.20689655172183.02723898617349.6276234448246
Trimmed Mean ( 8 / 24 )9068.98214285714180.02992624797650.3748589574236
Trimmed Mean ( 9 / 24 )9053.2962962963177.199015251351.0911208138324
Trimmed Mean ( 10 / 24 )9037.4423076923174.01533889295951.934745322948
Trimmed Mean ( 11 / 24 )9019.52170.30097304598252.9622340887313
Trimmed Mean ( 12 / 24 )9001.125166.01711178412354.2180556164864
Trimmed Mean ( 13 / 24 )8980.30434782609160.81268207002855.8432595752337
Trimmed Mean ( 14 / 24 )8957.34090909091155.55574496606357.5828357290505
Trimmed Mean ( 15 / 24 )8939.09523809524151.41234363262859.0380878046785
Trimmed Mean ( 16 / 24 )8926.25148.74654380815660.0097976831818
Trimmed Mean ( 17 / 24 )8911.1052631579145.286442873761.33473355738
Trimmed Mean ( 18 / 24 )8898.38888888889142.08625413994262.62666957301
Trimmed Mean ( 19 / 24 )8888.88235294118140.33051617352963.3424760010816
Trimmed Mean ( 20 / 24 )8877.875138.24579085641764.2180492078825
Trimmed Mean ( 21 / 24 )8866.46666666667135.94536371538765.220809480707
Trimmed Mean ( 22 / 24 )8858.28571428571134.61866440897565.8028049318185
Trimmed Mean ( 23 / 24 )8849.03846153846133.08343803527966.4924095152447
Trimmed Mean ( 24 / 24 )8839.45833333333131.56663296605367.1861712506855
Median8688.5
Midrange10072
Midmean - Weighted Average at Xnp8866.08108108108
Midmean - Weighted Average at X(n+1)p8898.38888888889
Midmean - Empirical Distribution Function8866.08108108108
Midmean - Empirical Distribution Function - Averaging8898.38888888889
Midmean - Empirical Distribution Function - Interpolation8898.38888888889
Midmean - Closest Observation8866.08108108108
Midmean - True Basic - Statistics Graphics Toolkit8898.38888888889
Midmean - MS Excel (old versions)8911.1052631579
Number of observations72

\begin{tabular}{lllllllll}
\hline
Central Tendency - Ungrouped Data \tabularnewline
Measure & Value & S.E. & Value/S.E. \tabularnewline
Arithmetic Mean & 9218.41666666667 & 223.34937468667 & 41.2735279854663 \tabularnewline
Geometric Mean & 9035.89592401272 &  &  \tabularnewline
Harmonic Mean & 8863.7890559486 &  &  \tabularnewline
Quadratic Mean & 9408.5618882779 &  &  \tabularnewline
Winsorized Mean ( 1 / 24 ) & 9219.5 & 221.306467202531 & 41.6594242208144 \tabularnewline
Winsorized Mean ( 2 / 24 ) & 9216.27777777778 & 217.698198348654 & 42.3351127739582 \tabularnewline
Winsorized Mean ( 3 / 24 ) & 9186.81944444445 & 209.829799429524 & 43.7822438443976 \tabularnewline
Winsorized Mean ( 4 / 24 ) & 9172.98611111111 & 203.939849570846 & 44.9788804415319 \tabularnewline
Winsorized Mean ( 5 / 24 ) & 9164.86111111111 & 199.978603418803 & 45.8292084974597 \tabularnewline
Winsorized Mean ( 6 / 24 ) & 9149.27777777778 & 193.742755149743 & 47.22384468367 \tabularnewline
Winsorized Mean ( 7 / 24 ) & 9160.65277777778 & 191.103635330443 & 47.9355233715874 \tabularnewline
Winsorized Mean ( 8 / 24 ) & 9163.09722222222 & 186.999136097736 & 49.0007462784912 \tabularnewline
Winsorized Mean ( 9 / 24 ) & 9156.34722222222 & 185.030671610171 & 49.4855644339503 \tabularnewline
Winsorized Mean ( 10 / 24 ) & 9161.90277777778 & 183.179597470539 & 50.0159564945615 \tabularnewline
Winsorized Mean ( 11 / 24 ) & 9154.41666666667 & 180.858049575473 & 50.6165840456357 \tabularnewline
Winsorized Mean ( 12 / 24 ) & 9160.75 & 179.044410466804 & 51.1646801825096 \tabularnewline
Winsorized Mean ( 13 / 24 ) & 9162.73611111111 & 172.19801648986 & 53.2104625702856 \tabularnewline
Winsorized Mean ( 14 / 24 ) & 9106.34722222222 & 160.837328953411 & 56.6183688915898 \tabularnewline
Winsorized Mean ( 15 / 24 ) & 9046.13888888889 & 148.668663149971 & 60.8476507235658 \tabularnewline
Winsorized Mean ( 16 / 24 ) & 9054.13888888889 & 147.091761925248 & 61.5543574322689 \tabularnewline
Winsorized Mean ( 17 / 24 ) & 9019.19444444445 & 140.440819851742 & 64.220605191323 \tabularnewline
Winsorized Mean ( 18 / 24 ) & 8979.19444444445 & 129.004331791024 & 69.603821203384 \tabularnewline
Winsorized Mean ( 19 / 24 ) & 8981.83333333333 & 125.866593869339 & 71.3599459333688 \tabularnewline
Winsorized Mean ( 20 / 24 ) & 8972.94444444445 & 121.80049538653 & 73.669194989471 \tabularnewline
Winsorized Mean ( 21 / 24 ) & 8933.27777777778 & 113.333081714410 & 78.8232142163832 \tabularnewline
Winsorized Mean ( 22 / 24 ) & 8931.75 & 109.595278629187 & 81.4975801121906 \tabularnewline
Winsorized Mean ( 23 / 24 ) & 8922.48611111111 & 104.749048036609 & 85.1796391313533 \tabularnewline
Winsorized Mean ( 24 / 24 ) & 8912.81944444445 & 98.0964887137212 & 90.8576806500697 \tabularnewline
Trimmed Mean ( 1 / 24 ) & 9194.02857142857 & 214.530246094122 & 42.8565609690059 \tabularnewline
Trimmed Mean ( 2 / 24 ) & 9167.05882352941 & 206.415995411451 & 44.4106029925473 \tabularnewline
Trimmed Mean ( 3 / 24 ) & 9140.21212121212 & 199.012751597577 & 45.9277711997797 \tabularnewline
Trimmed Mean ( 4 / 24 ) & 9122.734375 & 193.809467630321 & 47.0706332695831 \tabularnewline
Trimmed Mean ( 5 / 24 ) & 9108.14516129032 & 189.700767522741 & 48.0132225094895 \tabularnewline
Trimmed Mean ( 6 / 24 ) & 9094.53333333333 & 185.928654785735 & 48.914102798269 \tabularnewline
Trimmed Mean ( 7 / 24 ) & 9083.20689655172 & 183.027238986173 & 49.6276234448246 \tabularnewline
Trimmed Mean ( 8 / 24 ) & 9068.98214285714 & 180.029926247976 & 50.3748589574236 \tabularnewline
Trimmed Mean ( 9 / 24 ) & 9053.2962962963 & 177.1990152513 & 51.0911208138324 \tabularnewline
Trimmed Mean ( 10 / 24 ) & 9037.4423076923 & 174.015338892959 & 51.934745322948 \tabularnewline
Trimmed Mean ( 11 / 24 ) & 9019.52 & 170.300973045982 & 52.9622340887313 \tabularnewline
Trimmed Mean ( 12 / 24 ) & 9001.125 & 166.017111784123 & 54.2180556164864 \tabularnewline
Trimmed Mean ( 13 / 24 ) & 8980.30434782609 & 160.812682070028 & 55.8432595752337 \tabularnewline
Trimmed Mean ( 14 / 24 ) & 8957.34090909091 & 155.555744966063 & 57.5828357290505 \tabularnewline
Trimmed Mean ( 15 / 24 ) & 8939.09523809524 & 151.412343632628 & 59.0380878046785 \tabularnewline
Trimmed Mean ( 16 / 24 ) & 8926.25 & 148.746543808156 & 60.0097976831818 \tabularnewline
Trimmed Mean ( 17 / 24 ) & 8911.1052631579 & 145.2864428737 & 61.33473355738 \tabularnewline
Trimmed Mean ( 18 / 24 ) & 8898.38888888889 & 142.086254139942 & 62.62666957301 \tabularnewline
Trimmed Mean ( 19 / 24 ) & 8888.88235294118 & 140.330516173529 & 63.3424760010816 \tabularnewline
Trimmed Mean ( 20 / 24 ) & 8877.875 & 138.245790856417 & 64.2180492078825 \tabularnewline
Trimmed Mean ( 21 / 24 ) & 8866.46666666667 & 135.945363715387 & 65.220809480707 \tabularnewline
Trimmed Mean ( 22 / 24 ) & 8858.28571428571 & 134.618664408975 & 65.8028049318185 \tabularnewline
Trimmed Mean ( 23 / 24 ) & 8849.03846153846 & 133.083438035279 & 66.4924095152447 \tabularnewline
Trimmed Mean ( 24 / 24 ) & 8839.45833333333 & 131.566632966053 & 67.1861712506855 \tabularnewline
Median & 8688.5 &  &  \tabularnewline
Midrange & 10072 &  &  \tabularnewline
Midmean - Weighted Average at Xnp & 8866.08108108108 &  &  \tabularnewline
Midmean - Weighted Average at X(n+1)p & 8898.38888888889 &  &  \tabularnewline
Midmean - Empirical Distribution Function & 8866.08108108108 &  &  \tabularnewline
Midmean - Empirical Distribution Function - Averaging & 8898.38888888889 &  &  \tabularnewline
Midmean - Empirical Distribution Function - Interpolation & 8898.38888888889 &  &  \tabularnewline
Midmean - Closest Observation & 8866.08108108108 &  &  \tabularnewline
Midmean - True Basic - Statistics Graphics Toolkit & 8898.38888888889 &  &  \tabularnewline
Midmean - MS Excel (old versions) & 8911.1052631579 &  &  \tabularnewline
Number of observations & 72 &  &  \tabularnewline
\hline
\end{tabular}
%Source: https://freestatistics.org/blog/index.php?pk=86752&T=1

[TABLE]
[ROW][C]Central Tendency - Ungrouped Data[/C][/ROW]
[ROW][C]Measure[/C][C]Value[/C][C]S.E.[/C][C]Value/S.E.[/C][/ROW]
[ROW][C]Arithmetic Mean[/C][C]9218.41666666667[/C][C]223.34937468667[/C][C]41.2735279854663[/C][/ROW]
[ROW][C]Geometric Mean[/C][C]9035.89592401272[/C][C][/C][C][/C][/ROW]
[ROW][C]Harmonic Mean[/C][C]8863.7890559486[/C][C][/C][C][/C][/ROW]
[ROW][C]Quadratic Mean[/C][C]9408.5618882779[/C][C][/C][C][/C][/ROW]
[ROW][C]Winsorized Mean ( 1 / 24 )[/C][C]9219.5[/C][C]221.306467202531[/C][C]41.6594242208144[/C][/ROW]
[ROW][C]Winsorized Mean ( 2 / 24 )[/C][C]9216.27777777778[/C][C]217.698198348654[/C][C]42.3351127739582[/C][/ROW]
[ROW][C]Winsorized Mean ( 3 / 24 )[/C][C]9186.81944444445[/C][C]209.829799429524[/C][C]43.7822438443976[/C][/ROW]
[ROW][C]Winsorized Mean ( 4 / 24 )[/C][C]9172.98611111111[/C][C]203.939849570846[/C][C]44.9788804415319[/C][/ROW]
[ROW][C]Winsorized Mean ( 5 / 24 )[/C][C]9164.86111111111[/C][C]199.978603418803[/C][C]45.8292084974597[/C][/ROW]
[ROW][C]Winsorized Mean ( 6 / 24 )[/C][C]9149.27777777778[/C][C]193.742755149743[/C][C]47.22384468367[/C][/ROW]
[ROW][C]Winsorized Mean ( 7 / 24 )[/C][C]9160.65277777778[/C][C]191.103635330443[/C][C]47.9355233715874[/C][/ROW]
[ROW][C]Winsorized Mean ( 8 / 24 )[/C][C]9163.09722222222[/C][C]186.999136097736[/C][C]49.0007462784912[/C][/ROW]
[ROW][C]Winsorized Mean ( 9 / 24 )[/C][C]9156.34722222222[/C][C]185.030671610171[/C][C]49.4855644339503[/C][/ROW]
[ROW][C]Winsorized Mean ( 10 / 24 )[/C][C]9161.90277777778[/C][C]183.179597470539[/C][C]50.0159564945615[/C][/ROW]
[ROW][C]Winsorized Mean ( 11 / 24 )[/C][C]9154.41666666667[/C][C]180.858049575473[/C][C]50.6165840456357[/C][/ROW]
[ROW][C]Winsorized Mean ( 12 / 24 )[/C][C]9160.75[/C][C]179.044410466804[/C][C]51.1646801825096[/C][/ROW]
[ROW][C]Winsorized Mean ( 13 / 24 )[/C][C]9162.73611111111[/C][C]172.19801648986[/C][C]53.2104625702856[/C][/ROW]
[ROW][C]Winsorized Mean ( 14 / 24 )[/C][C]9106.34722222222[/C][C]160.837328953411[/C][C]56.6183688915898[/C][/ROW]
[ROW][C]Winsorized Mean ( 15 / 24 )[/C][C]9046.13888888889[/C][C]148.668663149971[/C][C]60.8476507235658[/C][/ROW]
[ROW][C]Winsorized Mean ( 16 / 24 )[/C][C]9054.13888888889[/C][C]147.091761925248[/C][C]61.5543574322689[/C][/ROW]
[ROW][C]Winsorized Mean ( 17 / 24 )[/C][C]9019.19444444445[/C][C]140.440819851742[/C][C]64.220605191323[/C][/ROW]
[ROW][C]Winsorized Mean ( 18 / 24 )[/C][C]8979.19444444445[/C][C]129.004331791024[/C][C]69.603821203384[/C][/ROW]
[ROW][C]Winsorized Mean ( 19 / 24 )[/C][C]8981.83333333333[/C][C]125.866593869339[/C][C]71.3599459333688[/C][/ROW]
[ROW][C]Winsorized Mean ( 20 / 24 )[/C][C]8972.94444444445[/C][C]121.80049538653[/C][C]73.669194989471[/C][/ROW]
[ROW][C]Winsorized Mean ( 21 / 24 )[/C][C]8933.27777777778[/C][C]113.333081714410[/C][C]78.8232142163832[/C][/ROW]
[ROW][C]Winsorized Mean ( 22 / 24 )[/C][C]8931.75[/C][C]109.595278629187[/C][C]81.4975801121906[/C][/ROW]
[ROW][C]Winsorized Mean ( 23 / 24 )[/C][C]8922.48611111111[/C][C]104.749048036609[/C][C]85.1796391313533[/C][/ROW]
[ROW][C]Winsorized Mean ( 24 / 24 )[/C][C]8912.81944444445[/C][C]98.0964887137212[/C][C]90.8576806500697[/C][/ROW]
[ROW][C]Trimmed Mean ( 1 / 24 )[/C][C]9194.02857142857[/C][C]214.530246094122[/C][C]42.8565609690059[/C][/ROW]
[ROW][C]Trimmed Mean ( 2 / 24 )[/C][C]9167.05882352941[/C][C]206.415995411451[/C][C]44.4106029925473[/C][/ROW]
[ROW][C]Trimmed Mean ( 3 / 24 )[/C][C]9140.21212121212[/C][C]199.012751597577[/C][C]45.9277711997797[/C][/ROW]
[ROW][C]Trimmed Mean ( 4 / 24 )[/C][C]9122.734375[/C][C]193.809467630321[/C][C]47.0706332695831[/C][/ROW]
[ROW][C]Trimmed Mean ( 5 / 24 )[/C][C]9108.14516129032[/C][C]189.700767522741[/C][C]48.0132225094895[/C][/ROW]
[ROW][C]Trimmed Mean ( 6 / 24 )[/C][C]9094.53333333333[/C][C]185.928654785735[/C][C]48.914102798269[/C][/ROW]
[ROW][C]Trimmed Mean ( 7 / 24 )[/C][C]9083.20689655172[/C][C]183.027238986173[/C][C]49.6276234448246[/C][/ROW]
[ROW][C]Trimmed Mean ( 8 / 24 )[/C][C]9068.98214285714[/C][C]180.029926247976[/C][C]50.3748589574236[/C][/ROW]
[ROW][C]Trimmed Mean ( 9 / 24 )[/C][C]9053.2962962963[/C][C]177.1990152513[/C][C]51.0911208138324[/C][/ROW]
[ROW][C]Trimmed Mean ( 10 / 24 )[/C][C]9037.4423076923[/C][C]174.015338892959[/C][C]51.934745322948[/C][/ROW]
[ROW][C]Trimmed Mean ( 11 / 24 )[/C][C]9019.52[/C][C]170.300973045982[/C][C]52.9622340887313[/C][/ROW]
[ROW][C]Trimmed Mean ( 12 / 24 )[/C][C]9001.125[/C][C]166.017111784123[/C][C]54.2180556164864[/C][/ROW]
[ROW][C]Trimmed Mean ( 13 / 24 )[/C][C]8980.30434782609[/C][C]160.812682070028[/C][C]55.8432595752337[/C][/ROW]
[ROW][C]Trimmed Mean ( 14 / 24 )[/C][C]8957.34090909091[/C][C]155.555744966063[/C][C]57.5828357290505[/C][/ROW]
[ROW][C]Trimmed Mean ( 15 / 24 )[/C][C]8939.09523809524[/C][C]151.412343632628[/C][C]59.0380878046785[/C][/ROW]
[ROW][C]Trimmed Mean ( 16 / 24 )[/C][C]8926.25[/C][C]148.746543808156[/C][C]60.0097976831818[/C][/ROW]
[ROW][C]Trimmed Mean ( 17 / 24 )[/C][C]8911.1052631579[/C][C]145.2864428737[/C][C]61.33473355738[/C][/ROW]
[ROW][C]Trimmed Mean ( 18 / 24 )[/C][C]8898.38888888889[/C][C]142.086254139942[/C][C]62.62666957301[/C][/ROW]
[ROW][C]Trimmed Mean ( 19 / 24 )[/C][C]8888.88235294118[/C][C]140.330516173529[/C][C]63.3424760010816[/C][/ROW]
[ROW][C]Trimmed Mean ( 20 / 24 )[/C][C]8877.875[/C][C]138.245790856417[/C][C]64.2180492078825[/C][/ROW]
[ROW][C]Trimmed Mean ( 21 / 24 )[/C][C]8866.46666666667[/C][C]135.945363715387[/C][C]65.220809480707[/C][/ROW]
[ROW][C]Trimmed Mean ( 22 / 24 )[/C][C]8858.28571428571[/C][C]134.618664408975[/C][C]65.8028049318185[/C][/ROW]
[ROW][C]Trimmed Mean ( 23 / 24 )[/C][C]8849.03846153846[/C][C]133.083438035279[/C][C]66.4924095152447[/C][/ROW]
[ROW][C]Trimmed Mean ( 24 / 24 )[/C][C]8839.45833333333[/C][C]131.566632966053[/C][C]67.1861712506855[/C][/ROW]
[ROW][C]Median[/C][C]8688.5[/C][C][/C][C][/C][/ROW]
[ROW][C]Midrange[/C][C]10072[/C][C][/C][C][/C][/ROW]
[ROW][C]Midmean - Weighted Average at Xnp[/C][C]8866.08108108108[/C][C][/C][C][/C][/ROW]
[ROW][C]Midmean - Weighted Average at X(n+1)p[/C][C]8898.38888888889[/C][C][/C][C][/C][/ROW]
[ROW][C]Midmean - Empirical Distribution Function[/C][C]8866.08108108108[/C][C][/C][C][/C][/ROW]
[ROW][C]Midmean - Empirical Distribution Function - Averaging[/C][C]8898.38888888889[/C][C][/C][C][/C][/ROW]
[ROW][C]Midmean - Empirical Distribution Function - Interpolation[/C][C]8898.38888888889[/C][C][/C][C][/C][/ROW]
[ROW][C]Midmean - Closest Observation[/C][C]8866.08108108108[/C][C][/C][C][/C][/ROW]
[ROW][C]Midmean - True Basic - Statistics Graphics Toolkit[/C][C]8898.38888888889[/C][C][/C][C][/C][/ROW]
[ROW][C]Midmean - MS Excel (old versions)[/C][C]8911.1052631579[/C][C][/C][C][/C][/ROW]
[ROW][C]Number of observations[/C][C]72[/C][C][/C][C][/C][/ROW]
[/TABLE]
Source: https://freestatistics.org/blog/index.php?pk=86752&T=1

Globally Unique Identifier (entire table): ba.freestatistics.org/blog/index.php?pk=86752&T=1

As an alternative you can also use a QR Code:  

The GUIDs for individual cells are displayed in the table below:

Central Tendency - Ungrouped Data
MeasureValueS.E.Value/S.E.
Arithmetic Mean9218.41666666667223.3493746866741.2735279854663
Geometric Mean9035.89592401272
Harmonic Mean8863.7890559486
Quadratic Mean9408.5618882779
Winsorized Mean ( 1 / 24 )9219.5221.30646720253141.6594242208144
Winsorized Mean ( 2 / 24 )9216.27777777778217.69819834865442.3351127739582
Winsorized Mean ( 3 / 24 )9186.81944444445209.82979942952443.7822438443976
Winsorized Mean ( 4 / 24 )9172.98611111111203.93984957084644.9788804415319
Winsorized Mean ( 5 / 24 )9164.86111111111199.97860341880345.8292084974597
Winsorized Mean ( 6 / 24 )9149.27777777778193.74275514974347.22384468367
Winsorized Mean ( 7 / 24 )9160.65277777778191.10363533044347.9355233715874
Winsorized Mean ( 8 / 24 )9163.09722222222186.99913609773649.0007462784912
Winsorized Mean ( 9 / 24 )9156.34722222222185.03067161017149.4855644339503
Winsorized Mean ( 10 / 24 )9161.90277777778183.17959747053950.0159564945615
Winsorized Mean ( 11 / 24 )9154.41666666667180.85804957547350.6165840456357
Winsorized Mean ( 12 / 24 )9160.75179.04441046680451.1646801825096
Winsorized Mean ( 13 / 24 )9162.73611111111172.1980164898653.2104625702856
Winsorized Mean ( 14 / 24 )9106.34722222222160.83732895341156.6183688915898
Winsorized Mean ( 15 / 24 )9046.13888888889148.66866314997160.8476507235658
Winsorized Mean ( 16 / 24 )9054.13888888889147.09176192524861.5543574322689
Winsorized Mean ( 17 / 24 )9019.19444444445140.44081985174264.220605191323
Winsorized Mean ( 18 / 24 )8979.19444444445129.00433179102469.603821203384
Winsorized Mean ( 19 / 24 )8981.83333333333125.86659386933971.3599459333688
Winsorized Mean ( 20 / 24 )8972.94444444445121.8004953865373.669194989471
Winsorized Mean ( 21 / 24 )8933.27777777778113.33308171441078.8232142163832
Winsorized Mean ( 22 / 24 )8931.75109.59527862918781.4975801121906
Winsorized Mean ( 23 / 24 )8922.48611111111104.74904803660985.1796391313533
Winsorized Mean ( 24 / 24 )8912.8194444444598.096488713721290.8576806500697
Trimmed Mean ( 1 / 24 )9194.02857142857214.53024609412242.8565609690059
Trimmed Mean ( 2 / 24 )9167.05882352941206.41599541145144.4106029925473
Trimmed Mean ( 3 / 24 )9140.21212121212199.01275159757745.9277711997797
Trimmed Mean ( 4 / 24 )9122.734375193.80946763032147.0706332695831
Trimmed Mean ( 5 / 24 )9108.14516129032189.70076752274148.0132225094895
Trimmed Mean ( 6 / 24 )9094.53333333333185.92865478573548.914102798269
Trimmed Mean ( 7 / 24 )9083.20689655172183.02723898617349.6276234448246
Trimmed Mean ( 8 / 24 )9068.98214285714180.02992624797650.3748589574236
Trimmed Mean ( 9 / 24 )9053.2962962963177.199015251351.0911208138324
Trimmed Mean ( 10 / 24 )9037.4423076923174.01533889295951.934745322948
Trimmed Mean ( 11 / 24 )9019.52170.30097304598252.9622340887313
Trimmed Mean ( 12 / 24 )9001.125166.01711178412354.2180556164864
Trimmed Mean ( 13 / 24 )8980.30434782609160.81268207002855.8432595752337
Trimmed Mean ( 14 / 24 )8957.34090909091155.55574496606357.5828357290505
Trimmed Mean ( 15 / 24 )8939.09523809524151.41234363262859.0380878046785
Trimmed Mean ( 16 / 24 )8926.25148.74654380815660.0097976831818
Trimmed Mean ( 17 / 24 )8911.1052631579145.286442873761.33473355738
Trimmed Mean ( 18 / 24 )8898.38888888889142.08625413994262.62666957301
Trimmed Mean ( 19 / 24 )8888.88235294118140.33051617352963.3424760010816
Trimmed Mean ( 20 / 24 )8877.875138.24579085641764.2180492078825
Trimmed Mean ( 21 / 24 )8866.46666666667135.94536371538765.220809480707
Trimmed Mean ( 22 / 24 )8858.28571428571134.61866440897565.8028049318185
Trimmed Mean ( 23 / 24 )8849.03846153846133.08343803527966.4924095152447
Trimmed Mean ( 24 / 24 )8839.45833333333131.56663296605367.1861712506855
Median8688.5
Midrange10072
Midmean - Weighted Average at Xnp8866.08108108108
Midmean - Weighted Average at X(n+1)p8898.38888888889
Midmean - Empirical Distribution Function8866.08108108108
Midmean - Empirical Distribution Function - Averaging8898.38888888889
Midmean - Empirical Distribution Function - Interpolation8898.38888888889
Midmean - Closest Observation8866.08108108108
Midmean - True Basic - Statistics Graphics Toolkit8898.38888888889
Midmean - MS Excel (old versions)8911.1052631579
Number of observations72


Parameters (Session):
Parameters (R input):
R code (references can be found in the software module):
geomean <- function(x) {
return(exp(mean(log(x))))
}
harmean <- function(x) {
return(1/mean(1/x))
}
quamean <- function(x) {
return(sqrt(mean(x*x)))
}
winmean <- function(x) {
x <-sort(x[!is.na(x)])
n<-length(x)
denom <- 3
nodenom <- n/denom
if (nodenom>40) denom <- n/40
sqrtn = sqrt(n)
roundnodenom = floor(nodenom)
win <- array(NA,dim=c(roundnodenom,2))
for (j in 1:roundnodenom) {
win[j,1] <- (j*x[j+1]+sum(x[(j+1):(n-j)])+j*x[n-j])/n
win[j,2] <- sd(c(rep(x[j+1],j),x[(j+1):(n-j)],rep(x[n-j],j)))/sqrtn
}
return(win)
}
trimean <- function(x) {
x <-sort(x[!is.na(x)])
n<-length(x)
denom <- 3
nodenom <- n/denom
if (nodenom>40) denom <- n/40
sqrtn = sqrt(n)
roundnodenom = floor(nodenom)
tri <- array(NA,dim=c(roundnodenom,2))
for (j in 1:roundnodenom) {
tri[j,1] <- mean(x,trim=j/n)
tri[j,2] <- sd(x[(j+1):(n-j)]) / sqrt(n-j*2)
}
return(tri)
}
midrange <- function(x) {
return((max(x)+min(x))/2)
}
q1 <- function(data,n,p,i,f) {
np <- n*p;
i <<- floor(np)
f <<- np - i
qvalue <- (1-f)*data[i] + f*data[i+1]
}
q2 <- function(data,n,p,i,f) {
np <- (n+1)*p
i <<- floor(np)
f <<- np - i
qvalue <- (1-f)*data[i] + f*data[i+1]
}
q3 <- function(data,n,p,i,f) {
np <- n*p
i <<- floor(np)
f <<- np - i
if (f==0) {
qvalue <- data[i]
} else {
qvalue <- data[i+1]
}
}
q4 <- function(data,n,p,i,f) {
np <- n*p
i <<- floor(np)
f <<- np - i
if (f==0) {
qvalue <- (data[i]+data[i+1])/2
} else {
qvalue <- data[i+1]
}
}
q5 <- function(data,n,p,i,f) {
np <- (n-1)*p
i <<- floor(np)
f <<- np - i
if (f==0) {
qvalue <- data[i+1]
} else {
qvalue <- data[i+1] + f*(data[i+2]-data[i+1])
}
}
q6 <- function(data,n,p,i,f) {
np <- n*p+0.5
i <<- floor(np)
f <<- np - i
qvalue <- data[i]
}
q7 <- function(data,n,p,i,f) {
np <- (n+1)*p
i <<- floor(np)
f <<- np - i
if (f==0) {
qvalue <- data[i]
} else {
qvalue <- f*data[i] + (1-f)*data[i+1]
}
}
q8 <- function(data,n,p,i,f) {
np <- (n+1)*p
i <<- floor(np)
f <<- np - i
if (f==0) {
qvalue <- data[i]
} else {
if (f == 0.5) {
qvalue <- (data[i]+data[i+1])/2
} else {
if (f < 0.5) {
qvalue <- data[i]
} else {
qvalue <- data[i+1]
}
}
}
}
midmean <- function(x,def) {
x <-sort(x[!is.na(x)])
n<-length(x)
if (def==1) {
qvalue1 <- q1(x,n,0.25,i,f)
qvalue3 <- q1(x,n,0.75,i,f)
}
if (def==2) {
qvalue1 <- q2(x,n,0.25,i,f)
qvalue3 <- q2(x,n,0.75,i,f)
}
if (def==3) {
qvalue1 <- q3(x,n,0.25,i,f)
qvalue3 <- q3(x,n,0.75,i,f)
}
if (def==4) {
qvalue1 <- q4(x,n,0.25,i,f)
qvalue3 <- q4(x,n,0.75,i,f)
}
if (def==5) {
qvalue1 <- q5(x,n,0.25,i,f)
qvalue3 <- q5(x,n,0.75,i,f)
}
if (def==6) {
qvalue1 <- q6(x,n,0.25,i,f)
qvalue3 <- q6(x,n,0.75,i,f)
}
if (def==7) {
qvalue1 <- q7(x,n,0.25,i,f)
qvalue3 <- q7(x,n,0.75,i,f)
}
if (def==8) {
qvalue1 <- q8(x,n,0.25,i,f)
qvalue3 <- q8(x,n,0.75,i,f)
}
midm <- 0
myn <- 0
roundno4 <- round(n/4)
round3no4 <- round(3*n/4)
for (i in 1:n) {
if ((x[i]>=qvalue1) & (x[i]<=qvalue3)){
midm = midm + x[i]
myn = myn + 1
}
}
midm = midm / myn
return(midm)
}
(arm <- mean(x))
sqrtn <- sqrt(length(x))
(armse <- sd(x) / sqrtn)
(armose <- arm / armse)
(geo <- geomean(x))
(har <- harmean(x))
(qua <- quamean(x))
(win <- winmean(x))
(tri <- trimean(x))
(midr <- midrange(x))
midm <- array(NA,dim=8)
for (j in 1:8) midm[j] <- midmean(x,j)
midm
bitmap(file='test1.png')
lb <- win[,1] - 2*win[,2]
ub <- win[,1] + 2*win[,2]
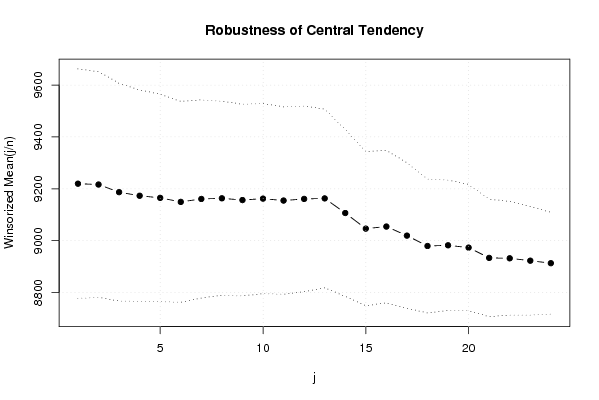
if ((ylimmin == '') | (ylimmax == '')) plot(win[,1],type='b',main=main, xlab='j', pch=19, ylab='Winsorized Mean(j/n)', ylim=c(min(lb),max(ub))) else plot(win[,1],type='l',main=main, xlab='j', pch=19, ylab='Winsorized Mean(j/n)', ylim=c(ylimmin,ylimmax))
lines(ub,lty=3)
lines(lb,lty=3)
grid()
dev.off()
bitmap(file='test2.png')
lb <- tri[,1] - 2*tri[,2]
ub <- tri[,1] + 2*tri[,2]
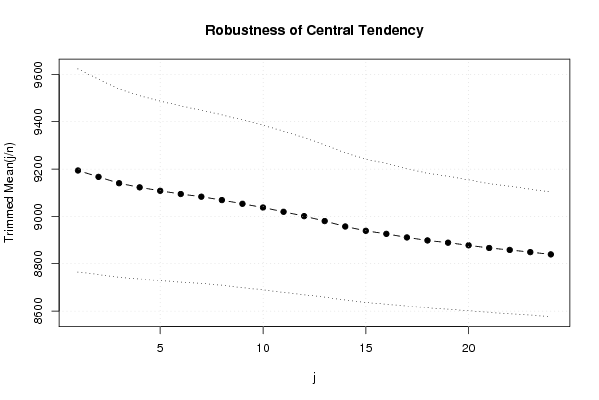
if ((ylimmin == '') | (ylimmax == '')) plot(tri[,1],type='b',main=main, xlab='j', pch=19, ylab='Trimmed Mean(j/n)', ylim=c(min(lb),max(ub))) else plot(tri[,1],type='l',main=main, xlab='j', pch=19, ylab='Trimmed Mean(j/n)', ylim=c(ylimmin,ylimmax))
lines(ub,lty=3)
lines(lb,lty=3)
grid()
dev.off()
load(file='createtable')
a<-table.start()
a<-table.row.start(a)
a<-table.element(a,'Central Tendency - Ungrouped Data',4,TRUE)
a<-table.row.end(a)
a<-table.row.start(a)
a<-table.element(a,'Measure',header=TRUE)
a<-table.element(a,'Value',header=TRUE)
a<-table.element(a,'S.E.',header=TRUE)
a<-table.element(a,'Value/S.E.',header=TRUE)
a<-table.row.end(a)
a<-table.row.start(a)
a<-table.element(a,hyperlink('arithmetic_mean.htm', 'Arithmetic Mean', 'click to view the definition of the Arithmetic Mean'),header=TRUE)
a<-table.element(a,arm)
a<-table.element(a,hyperlink('arithmetic_mean_standard_error.htm', armse, 'click to view the definition of the Standard Error of the Arithmetic Mean'))
a<-table.element(a,armose)
a<-table.row.end(a)
a<-table.row.start(a)
a<-table.element(a,hyperlink('geometric_mean.htm', 'Geometric Mean', 'click to view the definition of the Geometric Mean'),header=TRUE)
a<-table.element(a,geo)
a<-table.element(a,'')
a<-table.row.end(a)
a<-table.row.start(a)
a<-table.element(a,hyperlink('harmonic_mean.htm', 'Harmonic Mean', 'click to view the definition of the Harmonic Mean'),header=TRUE)
a<-table.element(a,har)
a<-table.element(a,'')
a<-table.row.end(a)
a<-table.row.start(a)
a<-table.element(a,hyperlink('quadratic_mean.htm', 'Quadratic Mean', 'click to view the definition of the Quadratic Mean'),header=TRUE)
a<-table.element(a,qua)
a<-table.element(a,'')
a<-table.row.end(a)
for (j in 1:length(win[,1])) {
a<-table.row.start(a)
mylabel <- paste('Winsorized Mean (',j)
mylabel <- paste(mylabel,'/')
mylabel <- paste(mylabel,length(win[,1]))
mylabel <- paste(mylabel,')')
a<-table.element(a,hyperlink('winsorized_mean.htm', mylabel, 'click to view the definition of the Winsorized Mean'),header=TRUE)
a<-table.element(a,win[j,1])
a<-table.element(a,win[j,2])
a<-table.element(a,win[j,1]/win[j,2])
a<-table.row.end(a)
}
for (j in 1:length(tri[,1])) {
a<-table.row.start(a)
mylabel <- paste('Trimmed Mean (',j)
mylabel <- paste(mylabel,'/')
mylabel <- paste(mylabel,length(tri[,1]))
mylabel <- paste(mylabel,')')
a<-table.element(a,hyperlink('arithmetic_mean.htm', mylabel, 'click to view the definition of the Trimmed Mean'),header=TRUE)
a<-table.element(a,tri[j,1])
a<-table.element(a,tri[j,2])
a<-table.element(a,tri[j,1]/tri[j,2])
a<-table.row.end(a)
}
a<-table.row.start(a)
a<-table.element(a,hyperlink('median_1.htm', 'Median', 'click to view the definition of the Median'),header=TRUE)
a<-table.element(a,median(x))
a<-table.element(a,'')
a<-table.row.end(a)
a<-table.row.start(a)
a<-table.element(a,hyperlink('midrange.htm', 'Midrange', 'click to view the definition of the Midrange'),header=TRUE)
a<-table.element(a,midr)
a<-table.element(a,'')
a<-table.row.end(a)
a<-table.row.start(a)
mymid <- hyperlink('midmean.htm', 'Midmean', 'click to view the definition of the Midmean')
mylabel <- paste(mymid,hyperlink('method_1.htm','Weighted Average at Xnp',''),sep=' - ')
a<-table.element(a,mylabel,header=TRUE)
a<-table.element(a,midm[1])
a<-table.element(a,'')
a<-table.row.end(a)
a<-table.row.start(a)
mymid <- hyperlink('midmean.htm', 'Midmean', 'click to view the definition of the Midmean')
mylabel <- paste(mymid,hyperlink('method_2.htm','Weighted Average at X(n+1)p',''),sep=' - ')
a<-table.element(a,mylabel,header=TRUE)
a<-table.element(a,midm[2])
a<-table.element(a,'')
a<-table.row.end(a)
a<-table.row.start(a)
mymid <- hyperlink('midmean.htm', 'Midmean', 'click to view the definition of the Midmean')
mylabel <- paste(mymid,hyperlink('method_3.htm','Empirical Distribution Function',''),sep=' - ')
a<-table.element(a,mylabel,header=TRUE)
a<-table.element(a,midm[3])
a<-table.element(a,'')
a<-table.row.end(a)
a<-table.row.start(a)
mymid <- hyperlink('midmean.htm', 'Midmean', 'click to view the definition of the Midmean')
mylabel <- paste(mymid,hyperlink('method_4.htm','Empirical Distribution Function - Averaging',''),sep=' - ')
a<-table.element(a,mylabel,header=TRUE)
a<-table.element(a,midm[4])
a<-table.element(a,'')
a<-table.row.end(a)
a<-table.row.start(a)
mymid <- hyperlink('midmean.htm', 'Midmean', 'click to view the definition of the Midmean')
mylabel <- paste(mymid,hyperlink('method_5.htm','Empirical Distribution Function - Interpolation',''),sep=' - ')
a<-table.element(a,mylabel,header=TRUE)
a<-table.element(a,midm[5])
a<-table.element(a,'')
a<-table.row.end(a)
a<-table.row.start(a)
mymid <- hyperlink('midmean.htm', 'Midmean', 'click to view the definition of the Midmean')
mylabel <- paste(mymid,hyperlink('method_6.htm','Closest Observation',''),sep=' - ')
a<-table.element(a,mylabel,header=TRUE)
a<-table.element(a,midm[6])
a<-table.element(a,'')
a<-table.row.end(a)
a<-table.row.start(a)
mymid <- hyperlink('midmean.htm', 'Midmean', 'click to view the definition of the Midmean')
mylabel <- paste(mymid,hyperlink('method_7.htm','True Basic - Statistics Graphics Toolkit',''),sep=' - ')
a<-table.element(a,mylabel,header=TRUE)
a<-table.element(a,midm[7])
a<-table.element(a,'')
a<-table.row.end(a)
a<-table.row.start(a)
mymid <- hyperlink('midmean.htm', 'Midmean', 'click to view the definition of the Midmean')
mylabel <- paste(mymid,hyperlink('method_8.htm','MS Excel (old versions)',''),sep=' - ')
a<-table.element(a,mylabel,header=TRUE)
a<-table.element(a,midm[8])
a<-table.element(a,'')
a<-table.row.end(a)
a<-table.row.start(a)
a<-table.element(a,'Number of observations',header=TRUE)
a<-table.element(a,length(x))
a<-table.element(a,'')
a<-table.row.end(a)
a<-table.end(a)
table.save(a,file='mytable.tab')