Free Statistics

of Irreproducible Research!

Author's title

Author*The author of this computation has been verified*
R Software Modulerwasp_tukeylambda.wasp
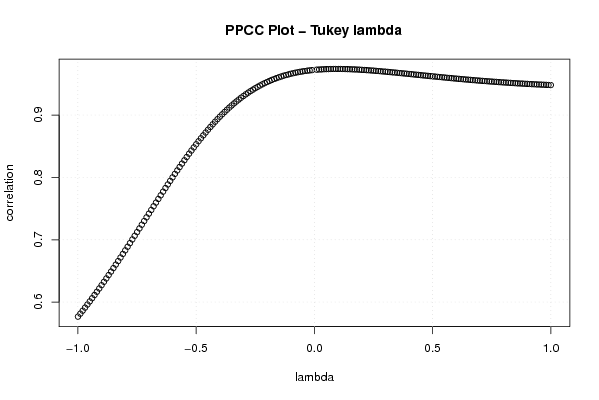
Title produced by softwareTukey lambda PPCC Plot
Date of computationTue, 19 Oct 2010 16:37:42 +0000
Cite this page as followsStatistical Computations at FreeStatistics.org, Office for Research Development and Education, URL https://freestatistics.org/blog/index.php?v=date/2010/Oct/19/t1287506184ai6nmfhz3digdk5.htm/, Retrieved Mon, 29 Apr 2024 03:22:15 +0000
Statistical Computations at FreeStatistics.org, Office for Research Development and Education, URL https://freestatistics.org/blog/index.php?pk=86738, Retrieved Mon, 29 Apr 2024 03:22:15 +0000
QR Codes:

Original text written by user:
IsPrivate?No (this computation is public)
User-defined keywords
Estimated Impact89
Family? (F = Feedback message, R = changed R code, M = changed R Module, P = changed Parameters, D = changed Data)
-     [Tukey lambda PPCC Plot] [Intrinsic Motivat...] [2010-10-12 12:09:04] [b98453cac15ba1066b407e146608df68]
F    D    [Tukey lambda PPCC Plot] [] [2010-10-19 16:37:42] [4dba6678eac10ee5c3460d144a14bd5c] [Current]
Feedback Forum
2010-10-23 11:59:11 [00c625c7d009d84797af914265b614f9] [reply
Op de Tukey-Lambda kunnen we zien da de correlatiecoëfficiënt bij lambda = 0,14 het hoogst is en dicht bij 1 ligt. Hieruit leiden we af dat we hier met een normale verdeling te maken hebben.
2010-10-24 13:50:58 [201022de16daa1dc0c172603d7d3cd57] [reply
Je moet hier oppassen met je conclusie. De conclusie voor deze computatie klopt maar die is niet hetzelfde voor alle andere computaties die je zou moeten maken. Zo zou je zien dat voor Amotivation niet de grootste waarde bekomen wordt voor de normaal verdeling. De waarden liggen echter wel dicht bij elkaar dat er discussie over kan bestaan welke verdeling je neemt.

Post a new message
Dataseries X:
23
24
22
20
24
27
28
27
24
23
24
27
27
28
27
23
24
28
27
25
19
24
20
28
26
23
23
20
11
24
25
23
18
20
20
24
23
25
28
26
26
23
22
24
21
20
22
20
25
20
22
23
25
23
23
22
24
25
21
12
17
20
23
23
20
28
24
24
24
24
28
25
21
25
25
18
17
26
28
21
27
22
21
25
22
23
26
19
25
21
13
24
25
26
25
25
22
21
23
25
24
21
21
25
22
20
20
23
28
23
28
24
18
20
28
21
21
25
19
18
21
22
24
15
28
26
23
26
20
22
20
23
22
24
23
22
26
23
27
23
21
26
23
21
27
19
23
25
23
22
22
25
25
28
28
20
25
19
25
22
18
20


Summary of computational transaction
Raw Inputview raw input (R code)
Raw Outputview raw output of R engine
Computing time1 seconds
R Server'Gwilym Jenkins' @ 72.249.127.135

\begin{tabular}{lllllllll}
\hline
Summary of computational transaction \tabularnewline
Raw Input & view raw input (R code)  \tabularnewline
Raw Output & view raw output of R engine  \tabularnewline
Computing time & 1 seconds \tabularnewline
R Server & 'Gwilym Jenkins' @ 72.249.127.135 \tabularnewline
\hline
\end{tabular}
%Source: https://freestatistics.org/blog/index.php?pk=86738&T=0

[TABLE]
[ROW][C]Summary of computational transaction[/C][/ROW]
[ROW][C]Raw Input[/C][C]view raw input (R code) [/C][/ROW]
[ROW][C]Raw Output[/C][C]view raw output of R engine [/C][/ROW]
[ROW][C]Computing time[/C][C]1 seconds[/C][/ROW]
[ROW][C]R Server[/C][C]'Gwilym Jenkins' @ 72.249.127.135[/C][/ROW]
[/TABLE]
Source: https://freestatistics.org/blog/index.php?pk=86738&T=0

Globally Unique Identifier (entire table): ba.freestatistics.org/blog/index.php?pk=86738&T=0

As an alternative you can also use a QR Code:  

The GUIDs for individual cells are displayed in the table below:

Summary of computational transaction
Raw Inputview raw input (R code)
Raw Outputview raw output of R engine
Computing time1 seconds
R Server'Gwilym Jenkins' @ 72.249.127.135


Tukey Lambda - Key Values
Distribution (lambda)Correlation
Approx. Cauchy (lambda=-1)0.576646683891582
Exact Logistic (lambda=0)0.972439936943605
Approx. Normal (lambda=0.14)0.973690680366105
U-shaped (lambda=0.5)0.96213579617026
Exactly Uniform (lambda=1)0.948140755243007

\begin{tabular}{lllllllll}
\hline
Tukey Lambda - Key Values \tabularnewline
Distribution (lambda) & Correlation \tabularnewline
Approx. Cauchy (lambda=-1) & 0.576646683891582 \tabularnewline
Exact Logistic (lambda=0) & 0.972439936943605 \tabularnewline
Approx. Normal (lambda=0.14) & 0.973690680366105 \tabularnewline
U-shaped (lambda=0.5) & 0.96213579617026 \tabularnewline
Exactly Uniform (lambda=1) & 0.948140755243007 \tabularnewline
\hline
\end{tabular}
%Source: https://freestatistics.org/blog/index.php?pk=86738&T=1

[TABLE]
[ROW][C]Tukey Lambda - Key Values[/C][/ROW]
[ROW][C]Distribution (lambda)[/C][C]Correlation[/C][/ROW]
[ROW][C]Approx. Cauchy (lambda=-1)[/C][C]0.576646683891582[/C][/ROW]
[ROW][C]Exact Logistic (lambda=0)[/C][C]0.972439936943605[/C][/ROW]
[ROW][C]Approx. Normal (lambda=0.14)[/C][C]0.973690680366105[/C][/ROW]
[ROW][C]U-shaped (lambda=0.5)[/C][C]0.96213579617026[/C][/ROW]
[ROW][C]Exactly Uniform (lambda=1)[/C][C]0.948140755243007[/C][/ROW]
[/TABLE]
Source: https://freestatistics.org/blog/index.php?pk=86738&T=1

Globally Unique Identifier (entire table): ba.freestatistics.org/blog/index.php?pk=86738&T=1

As an alternative you can also use a QR Code:  

The GUIDs for individual cells are displayed in the table below:

Tukey Lambda - Key Values
Distribution (lambda)Correlation
Approx. Cauchy (lambda=-1)0.576646683891582
Exact Logistic (lambda=0)0.972439936943605
Approx. Normal (lambda=0.14)0.973690680366105
U-shaped (lambda=0.5)0.96213579617026
Exactly Uniform (lambda=1)0.948140755243007


Parameters (Session):
Parameters (R input):
R code (references can be found in the software module):
gp <- function(lambda, p)
{
(p^lambda-(1-p)^lambda)/lambda
}
sortx <- sort(x)
c <- array(NA,dim=c(201))
for (i in 1:201)
{
if (i != 101) c[i] <- cor(gp(ppoints(x), lambda=(i-101)/100),sortx)
}
bitmap(file='test1.png')
plot((-100:100)/100,c[1:201],xlab='lambda',ylab='correlation',main='PPCC Plot - Tukey lambda')
grid()
dev.off()
load(file='createtable')
a<-table.start()
a<-table.row.start(a)
a<-table.element(a,'Tukey Lambda - Key Values',2,TRUE)
a<-table.row.end(a)
a<-table.row.start(a)
a<-table.element(a,'Distribution (lambda)',1,TRUE)
a<-table.element(a,'Correlation',1,TRUE)
a<-table.row.end(a)
a<-table.row.start(a)
a<-table.element(a,'Approx. Cauchy (lambda=-1)',header=TRUE)
a<-table.element(a,c[1])
a<-table.row.end(a)
a<-table.row.start(a)
a<-table.element(a,'Exact Logistic (lambda=0)',header=TRUE)
a<-table.element(a,(c[100]+c[102])/2)
a<-table.row.end(a)
a<-table.row.start(a)
a<-table.element(a,'Approx. Normal (lambda=0.14)',header=TRUE)
a<-table.element(a,c[115])
a<-table.row.end(a)
a<-table.row.start(a)
a<-table.element(a,'U-shaped (lambda=0.5)',header=TRUE)
a<-table.element(a,c[151])
a<-table.row.end(a)
a<-table.row.start(a)
a<-table.element(a,'Exactly Uniform (lambda=1)',header=TRUE)
a<-table.element(a,c[201])
a<-table.row.end(a)
a<-table.end(a)
table.save(a,file='mytable.tab')