Free Statistics

of Irreproducible Research!

Author's title

Author*Unverified author*
R Software Modulerwasp_centraltendency.wasp
Title produced by softwareCentral Tendency
Date of computationTue, 19 Oct 2010 15:30:56 +0000
Cite this page as followsStatistical Computations at FreeStatistics.org, Office for Research Development and Education, URL https://freestatistics.org/blog/index.php?v=date/2010/Oct/19/t1287502189e7a7235xadvz40x.htm/, Retrieved Mon, 29 Apr 2024 02:22:29 +0000
Statistical Computations at FreeStatistics.org, Office for Research Development and Education, URL https://freestatistics.org/blog/index.php?pk=86648, Retrieved Mon, 29 Apr 2024 02:22:29 +0000
QR Codes:

Original text written by user:
IsPrivate?No (this computation is public)
User-defined keywordsKDGP1W52
Estimated Impact82
Family? (F = Feedback message, R = changed R code, M = changed R Module, P = changed Parameters, D = changed Data)
-     [Central Tendency] [Cenrummaten Maxim...] [2010-10-19 15:04:16] [d1899c9419fc846190372744c0657f19]
- RM    [Mean versus Median] [Gemiddelde vs med...] [2010-10-19 15:22:40] [d1899c9419fc846190372744c0657f19]
- RM D      [Central Tendency] [Centrummaten cijf...] [2010-10-19 15:30:56] [2a9374b6a827503db60f94b3ae42bf2a] [Current]
- RM          [Mean versus Median] [Gemiddelde vs med...] [2010-10-19 15:36:59] [d1899c9419fc846190372744c0657f19]
Feedback Forum

Post a new message
Dataseries X:
2834
4683
4120
3849
8435
12854
15883
10520
12562
5060
4520
2150
2905
4820
3950
4053
8700
13520
15400
11100
11950
4900
4633
2300
2945
3960
3900
3767
8820
11980
14085
11600
9814
4930
4360
2640
3050
5485
4366
4790
10100
14830
17930
13580
12490
6400
4980
4930
5856
5120
5100
5623
12035
19846
17030
15860
14890
8053
6080
5987
5682
4980
5450
6035
13240
18400
17689
16490
14062
9556
7555
4328


Summary of computational transaction
Raw Inputview raw input (R code)
Raw Outputview raw output of R engine
Computing time1 seconds
R Server'George Udny Yule' @ 72.249.76.132

\begin{tabular}{lllllllll}
\hline
Summary of computational transaction \tabularnewline
Raw Input & view raw input (R code)  \tabularnewline
Raw Output & view raw output of R engine  \tabularnewline
Computing time & 1 seconds \tabularnewline
R Server & 'George Udny Yule' @ 72.249.76.132 \tabularnewline
\hline
\end{tabular}
%Source: https://freestatistics.org/blog/index.php?pk=86648&T=0

[TABLE]
[ROW][C]Summary of computational transaction[/C][/ROW]
[ROW][C]Raw Input[/C][C]view raw input (R code) [/C][/ROW]
[ROW][C]Raw Output[/C][C]view raw output of R engine [/C][/ROW]
[ROW][C]Computing time[/C][C]1 seconds[/C][/ROW]
[ROW][C]R Server[/C][C]'George Udny Yule' @ 72.249.76.132[/C][/ROW]
[/TABLE]
Source: https://freestatistics.org/blog/index.php?pk=86648&T=0

Globally Unique Identifier (entire table): ba.freestatistics.org/blog/index.php?pk=86648&T=0

As an alternative you can also use a QR Code:  

The GUIDs for individual cells are displayed in the table below:

Summary of computational transaction
Raw Inputview raw input (R code)
Raw Outputview raw output of R engine
Computing time1 seconds
R Server'George Udny Yule' @ 72.249.76.132


Central Tendency - Ungrouped Data
MeasureValueS.E.Value/S.E.
Arithmetic Mean8421.94444444445575.51557646298514.6337384927167
Geometric Mean7098.45577683783
Harmonic Mean5992.11353288074
Quadratic Mean9718.31461297002
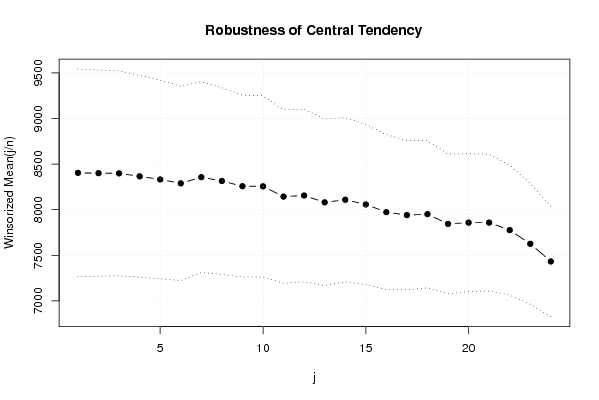
Winsorized Mean ( 1 / 24 )8403.94444444445569.90881847943814.7461210845392
Winsorized Mean ( 2 / 24 )8400.33333333333565.35604753565114.8584831982426
Winsorized Mean ( 3 / 24 )8398.375561.85082986723114.9476952841461
Winsorized Mean ( 4 / 24 )8365.70833333333552.99675175190815.1279520301531
Winsorized Mean ( 5 / 24 )8330.98611111111544.5140004368815.2998565774744
Winsorized Mean ( 6 / 24 )8289.15277777778532.88185507025415.5553293828797
Winsorized Mean ( 7 / 24 )8356.625523.294968255815.9692439387551
Winsorized Mean ( 8 / 24 )8314.625512.02883774998216.2385873353093
Winsorized Mean ( 9 / 24 )8257.25499.06312764969816.5455020467790
Winsorized Mean ( 10 / 24 )8255.86111111111496.655383692616.6229167792954
Winsorized Mean ( 11 / 24 )8143.56944444444475.83642230581417.1142204814466
Winsorized Mean ( 12 / 24 )8155.23611111111473.25652293405417.2321684243273
Winsorized Mean ( 13 / 24 )8080.30555555556456.74568712459717.6910385436246
Winsorized Mean ( 14 / 24 )8109.08333333333449.90442766619518.0240131785274
Winsorized Mean ( 15 / 24 )8057.41666666667439.32699399043318.3403632758385
Winsorized Mean ( 16 / 24 )7972.97222222222425.10329085071318.7553763845648
Winsorized Mean ( 17 / 24 )7940.38888888889409.73939748091919.3791198447268
Winsorized Mean ( 18 / 24 )7950.63888888889403.58753450381519.6999119377254
Winsorized Mean ( 19 / 24 )7843.76388888889383.29426188565120.4640785653841
Winsorized Mean ( 20 / 24 )7858.20833333333377.51570039457320.8155801867844
Winsorized Mean ( 21 / 24 )7858.20833333333375.17104807275720.9456683123624
Winsorized Mean ( 22 / 24 )7775.70833333333356.0808154331321.8369201493630
Winsorized Mean ( 23 / 24 )7625.56944444444331.09256398448023.0315333956032
Winsorized Mean ( 24 / 24 )7432.23611111111302.90823634422824.5362628656457
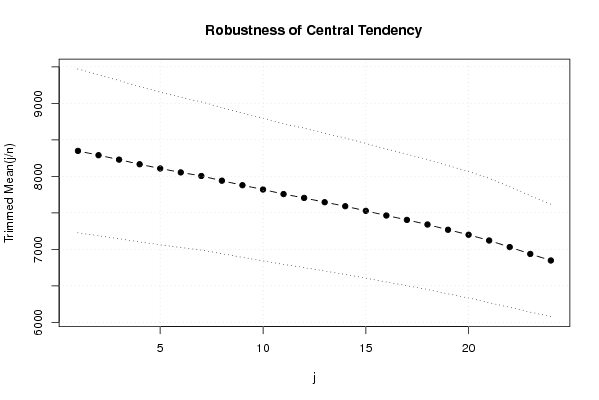
Trimmed Mean ( 1 / 24 )8348.34285714286561.52738204012314.8672052764585
Trimmed Mean ( 2 / 24 )8289.4705882353551.3786390772115.0340800327495
Trimmed Mean ( 3 / 24 )8229541.94895208558815.184086929834
Trimmed Mean ( 4 / 24 )8165.484375532.00037202003715.3486441071369
Trimmed Mean ( 5 / 24 )8107.35483870968523.05203321812015.5000923881866
Trimmed Mean ( 6 / 24 )8053.68333333333514.64458828902415.649019763539
Trimmed Mean ( 7 / 24 )8004.96551724138507.39490400069915.7765981765366
Trimmed Mean ( 8 / 24 )7940.375500.40009743016315.8680524659733
Trimmed Mean ( 9 / 24 )7878494.07295681173515.9450135681113
Trimmed Mean ( 10 / 24 )7819.65384615385488.73728926902315.9997078550099
Trimmed Mean ( 11 / 24 )7756.84481.98197981387916.0936307265997
Trimmed Mean ( 12 / 24 )7704.10416666667477.58077668813516.1315206614724
Trimmed Mean ( 13 / 24 )7645.26086956522471.73411658325316.2067160309275
Trimmed Mean ( 14 / 24 )7590.5467.13496958558516.2490511184248
Trimmed Mean ( 15 / 24 )7527461.58509658970616.3068523130646
Trimmed Mean ( 16 / 24 )7463.35455.77518433307216.3750687982738
Trimmed Mean ( 17 / 24 )7403450.43783346957916.4351203427497
Trimmed Mean ( 18 / 24 )7339.77777777778445.61215272090316.4712244335375
Trimmed Mean ( 19 / 24 )7267.91176470588438.93750822607216.5579646954267
Trimmed Mean ( 20 / 24 )7199.71875433.72878825696216.5995869882968
Trimmed Mean ( 21 / 24 )7120.7425.84674851217416.721273615164
Trimmed Mean ( 22 / 24 )7030.39285714286412.96263887817017.0242830592162
Trimmed Mean ( 23 / 24 )6936.57692307692398.60934094221917.4019427308966
Trimmed Mean ( 24 / 24 )6846.70833333333384.7732226851717.7941393258945
Median6011
Midrange10998
Midmean - Weighted Average at Xnp7263.56756756757
Midmean - Weighted Average at X(n+1)p7339.77777777778
Midmean - Empirical Distribution Function7263.56756756757
Midmean - Empirical Distribution Function - Averaging7339.77777777778
Midmean - Empirical Distribution Function - Interpolation7339.77777777778
Midmean - Closest Observation7263.56756756757
Midmean - True Basic - Statistics Graphics Toolkit7339.77777777778
Midmean - MS Excel (old versions)7403
Number of observations72

\begin{tabular}{lllllllll}
\hline
Central Tendency - Ungrouped Data \tabularnewline
Measure & Value & S.E. & Value/S.E. \tabularnewline
Arithmetic Mean & 8421.94444444445 & 575.515576462985 & 14.6337384927167 \tabularnewline
Geometric Mean & 7098.45577683783 &  &  \tabularnewline
Harmonic Mean & 5992.11353288074 &  &  \tabularnewline
Quadratic Mean & 9718.31461297002 &  &  \tabularnewline
Winsorized Mean ( 1 / 24 ) & 8403.94444444445 & 569.908818479438 & 14.7461210845392 \tabularnewline
Winsorized Mean ( 2 / 24 ) & 8400.33333333333 & 565.356047535651 & 14.8584831982426 \tabularnewline
Winsorized Mean ( 3 / 24 ) & 8398.375 & 561.850829867231 & 14.9476952841461 \tabularnewline
Winsorized Mean ( 4 / 24 ) & 8365.70833333333 & 552.996751751908 & 15.1279520301531 \tabularnewline
Winsorized Mean ( 5 / 24 ) & 8330.98611111111 & 544.51400043688 & 15.2998565774744 \tabularnewline
Winsorized Mean ( 6 / 24 ) & 8289.15277777778 & 532.881855070254 & 15.5553293828797 \tabularnewline
Winsorized Mean ( 7 / 24 ) & 8356.625 & 523.2949682558 & 15.9692439387551 \tabularnewline
Winsorized Mean ( 8 / 24 ) & 8314.625 & 512.028837749982 & 16.2385873353093 \tabularnewline
Winsorized Mean ( 9 / 24 ) & 8257.25 & 499.063127649698 & 16.5455020467790 \tabularnewline
Winsorized Mean ( 10 / 24 ) & 8255.86111111111 & 496.6553836926 & 16.6229167792954 \tabularnewline
Winsorized Mean ( 11 / 24 ) & 8143.56944444444 & 475.836422305814 & 17.1142204814466 \tabularnewline
Winsorized Mean ( 12 / 24 ) & 8155.23611111111 & 473.256522934054 & 17.2321684243273 \tabularnewline
Winsorized Mean ( 13 / 24 ) & 8080.30555555556 & 456.745687124597 & 17.6910385436246 \tabularnewline
Winsorized Mean ( 14 / 24 ) & 8109.08333333333 & 449.904427666195 & 18.0240131785274 \tabularnewline
Winsorized Mean ( 15 / 24 ) & 8057.41666666667 & 439.326993990433 & 18.3403632758385 \tabularnewline
Winsorized Mean ( 16 / 24 ) & 7972.97222222222 & 425.103290850713 & 18.7553763845648 \tabularnewline
Winsorized Mean ( 17 / 24 ) & 7940.38888888889 & 409.739397480919 & 19.3791198447268 \tabularnewline
Winsorized Mean ( 18 / 24 ) & 7950.63888888889 & 403.587534503815 & 19.6999119377254 \tabularnewline
Winsorized Mean ( 19 / 24 ) & 7843.76388888889 & 383.294261885651 & 20.4640785653841 \tabularnewline
Winsorized Mean ( 20 / 24 ) & 7858.20833333333 & 377.515700394573 & 20.8155801867844 \tabularnewline
Winsorized Mean ( 21 / 24 ) & 7858.20833333333 & 375.171048072757 & 20.9456683123624 \tabularnewline
Winsorized Mean ( 22 / 24 ) & 7775.70833333333 & 356.08081543313 & 21.8369201493630 \tabularnewline
Winsorized Mean ( 23 / 24 ) & 7625.56944444444 & 331.092563984480 & 23.0315333956032 \tabularnewline
Winsorized Mean ( 24 / 24 ) & 7432.23611111111 & 302.908236344228 & 24.5362628656457 \tabularnewline
Trimmed Mean ( 1 / 24 ) & 8348.34285714286 & 561.527382040123 & 14.8672052764585 \tabularnewline
Trimmed Mean ( 2 / 24 ) & 8289.4705882353 & 551.37863907721 & 15.0340800327495 \tabularnewline
Trimmed Mean ( 3 / 24 ) & 8229 & 541.948952085588 & 15.184086929834 \tabularnewline
Trimmed Mean ( 4 / 24 ) & 8165.484375 & 532.000372020037 & 15.3486441071369 \tabularnewline
Trimmed Mean ( 5 / 24 ) & 8107.35483870968 & 523.052033218120 & 15.5000923881866 \tabularnewline
Trimmed Mean ( 6 / 24 ) & 8053.68333333333 & 514.644588289024 & 15.649019763539 \tabularnewline
Trimmed Mean ( 7 / 24 ) & 8004.96551724138 & 507.394904000699 & 15.7765981765366 \tabularnewline
Trimmed Mean ( 8 / 24 ) & 7940.375 & 500.400097430163 & 15.8680524659733 \tabularnewline
Trimmed Mean ( 9 / 24 ) & 7878 & 494.072956811735 & 15.9450135681113 \tabularnewline
Trimmed Mean ( 10 / 24 ) & 7819.65384615385 & 488.737289269023 & 15.9997078550099 \tabularnewline
Trimmed Mean ( 11 / 24 ) & 7756.84 & 481.981979813879 & 16.0936307265997 \tabularnewline
Trimmed Mean ( 12 / 24 ) & 7704.10416666667 & 477.580776688135 & 16.1315206614724 \tabularnewline
Trimmed Mean ( 13 / 24 ) & 7645.26086956522 & 471.734116583253 & 16.2067160309275 \tabularnewline
Trimmed Mean ( 14 / 24 ) & 7590.5 & 467.134969585585 & 16.2490511184248 \tabularnewline
Trimmed Mean ( 15 / 24 ) & 7527 & 461.585096589706 & 16.3068523130646 \tabularnewline
Trimmed Mean ( 16 / 24 ) & 7463.35 & 455.775184333072 & 16.3750687982738 \tabularnewline
Trimmed Mean ( 17 / 24 ) & 7403 & 450.437833469579 & 16.4351203427497 \tabularnewline
Trimmed Mean ( 18 / 24 ) & 7339.77777777778 & 445.612152720903 & 16.4712244335375 \tabularnewline
Trimmed Mean ( 19 / 24 ) & 7267.91176470588 & 438.937508226072 & 16.5579646954267 \tabularnewline
Trimmed Mean ( 20 / 24 ) & 7199.71875 & 433.728788256962 & 16.5995869882968 \tabularnewline
Trimmed Mean ( 21 / 24 ) & 7120.7 & 425.846748512174 & 16.721273615164 \tabularnewline
Trimmed Mean ( 22 / 24 ) & 7030.39285714286 & 412.962638878170 & 17.0242830592162 \tabularnewline
Trimmed Mean ( 23 / 24 ) & 6936.57692307692 & 398.609340942219 & 17.4019427308966 \tabularnewline
Trimmed Mean ( 24 / 24 ) & 6846.70833333333 & 384.77322268517 & 17.7941393258945 \tabularnewline
Median & 6011 &  &  \tabularnewline
Midrange & 10998 &  &  \tabularnewline
Midmean - Weighted Average at Xnp & 7263.56756756757 &  &  \tabularnewline
Midmean - Weighted Average at X(n+1)p & 7339.77777777778 &  &  \tabularnewline
Midmean - Empirical Distribution Function & 7263.56756756757 &  &  \tabularnewline
Midmean - Empirical Distribution Function - Averaging & 7339.77777777778 &  &  \tabularnewline
Midmean - Empirical Distribution Function - Interpolation & 7339.77777777778 &  &  \tabularnewline
Midmean - Closest Observation & 7263.56756756757 &  &  \tabularnewline
Midmean - True Basic - Statistics Graphics Toolkit & 7339.77777777778 &  &  \tabularnewline
Midmean - MS Excel (old versions) & 7403 &  &  \tabularnewline
Number of observations & 72 &  &  \tabularnewline
\hline
\end{tabular}
%Source: https://freestatistics.org/blog/index.php?pk=86648&T=1

[TABLE]
[ROW][C]Central Tendency - Ungrouped Data[/C][/ROW]
[ROW][C]Measure[/C][C]Value[/C][C]S.E.[/C][C]Value/S.E.[/C][/ROW]
[ROW][C]Arithmetic Mean[/C][C]8421.94444444445[/C][C]575.515576462985[/C][C]14.6337384927167[/C][/ROW]
[ROW][C]Geometric Mean[/C][C]7098.45577683783[/C][C][/C][C][/C][/ROW]
[ROW][C]Harmonic Mean[/C][C]5992.11353288074[/C][C][/C][C][/C][/ROW]
[ROW][C]Quadratic Mean[/C][C]9718.31461297002[/C][C][/C][C][/C][/ROW]
[ROW][C]Winsorized Mean ( 1 / 24 )[/C][C]8403.94444444445[/C][C]569.908818479438[/C][C]14.7461210845392[/C][/ROW]
[ROW][C]Winsorized Mean ( 2 / 24 )[/C][C]8400.33333333333[/C][C]565.356047535651[/C][C]14.8584831982426[/C][/ROW]
[ROW][C]Winsorized Mean ( 3 / 24 )[/C][C]8398.375[/C][C]561.850829867231[/C][C]14.9476952841461[/C][/ROW]
[ROW][C]Winsorized Mean ( 4 / 24 )[/C][C]8365.70833333333[/C][C]552.996751751908[/C][C]15.1279520301531[/C][/ROW]
[ROW][C]Winsorized Mean ( 5 / 24 )[/C][C]8330.98611111111[/C][C]544.51400043688[/C][C]15.2998565774744[/C][/ROW]
[ROW][C]Winsorized Mean ( 6 / 24 )[/C][C]8289.15277777778[/C][C]532.881855070254[/C][C]15.5553293828797[/C][/ROW]
[ROW][C]Winsorized Mean ( 7 / 24 )[/C][C]8356.625[/C][C]523.2949682558[/C][C]15.9692439387551[/C][/ROW]
[ROW][C]Winsorized Mean ( 8 / 24 )[/C][C]8314.625[/C][C]512.028837749982[/C][C]16.2385873353093[/C][/ROW]
[ROW][C]Winsorized Mean ( 9 / 24 )[/C][C]8257.25[/C][C]499.063127649698[/C][C]16.5455020467790[/C][/ROW]
[ROW][C]Winsorized Mean ( 10 / 24 )[/C][C]8255.86111111111[/C][C]496.6553836926[/C][C]16.6229167792954[/C][/ROW]
[ROW][C]Winsorized Mean ( 11 / 24 )[/C][C]8143.56944444444[/C][C]475.836422305814[/C][C]17.1142204814466[/C][/ROW]
[ROW][C]Winsorized Mean ( 12 / 24 )[/C][C]8155.23611111111[/C][C]473.256522934054[/C][C]17.2321684243273[/C][/ROW]
[ROW][C]Winsorized Mean ( 13 / 24 )[/C][C]8080.30555555556[/C][C]456.745687124597[/C][C]17.6910385436246[/C][/ROW]
[ROW][C]Winsorized Mean ( 14 / 24 )[/C][C]8109.08333333333[/C][C]449.904427666195[/C][C]18.0240131785274[/C][/ROW]
[ROW][C]Winsorized Mean ( 15 / 24 )[/C][C]8057.41666666667[/C][C]439.326993990433[/C][C]18.3403632758385[/C][/ROW]
[ROW][C]Winsorized Mean ( 16 / 24 )[/C][C]7972.97222222222[/C][C]425.103290850713[/C][C]18.7553763845648[/C][/ROW]
[ROW][C]Winsorized Mean ( 17 / 24 )[/C][C]7940.38888888889[/C][C]409.739397480919[/C][C]19.3791198447268[/C][/ROW]
[ROW][C]Winsorized Mean ( 18 / 24 )[/C][C]7950.63888888889[/C][C]403.587534503815[/C][C]19.6999119377254[/C][/ROW]
[ROW][C]Winsorized Mean ( 19 / 24 )[/C][C]7843.76388888889[/C][C]383.294261885651[/C][C]20.4640785653841[/C][/ROW]
[ROW][C]Winsorized Mean ( 20 / 24 )[/C][C]7858.20833333333[/C][C]377.515700394573[/C][C]20.8155801867844[/C][/ROW]
[ROW][C]Winsorized Mean ( 21 / 24 )[/C][C]7858.20833333333[/C][C]375.171048072757[/C][C]20.9456683123624[/C][/ROW]
[ROW][C]Winsorized Mean ( 22 / 24 )[/C][C]7775.70833333333[/C][C]356.08081543313[/C][C]21.8369201493630[/C][/ROW]
[ROW][C]Winsorized Mean ( 23 / 24 )[/C][C]7625.56944444444[/C][C]331.092563984480[/C][C]23.0315333956032[/C][/ROW]
[ROW][C]Winsorized Mean ( 24 / 24 )[/C][C]7432.23611111111[/C][C]302.908236344228[/C][C]24.5362628656457[/C][/ROW]
[ROW][C]Trimmed Mean ( 1 / 24 )[/C][C]8348.34285714286[/C][C]561.527382040123[/C][C]14.8672052764585[/C][/ROW]
[ROW][C]Trimmed Mean ( 2 / 24 )[/C][C]8289.4705882353[/C][C]551.37863907721[/C][C]15.0340800327495[/C][/ROW]
[ROW][C]Trimmed Mean ( 3 / 24 )[/C][C]8229[/C][C]541.948952085588[/C][C]15.184086929834[/C][/ROW]
[ROW][C]Trimmed Mean ( 4 / 24 )[/C][C]8165.484375[/C][C]532.000372020037[/C][C]15.3486441071369[/C][/ROW]
[ROW][C]Trimmed Mean ( 5 / 24 )[/C][C]8107.35483870968[/C][C]523.052033218120[/C][C]15.5000923881866[/C][/ROW]
[ROW][C]Trimmed Mean ( 6 / 24 )[/C][C]8053.68333333333[/C][C]514.644588289024[/C][C]15.649019763539[/C][/ROW]
[ROW][C]Trimmed Mean ( 7 / 24 )[/C][C]8004.96551724138[/C][C]507.394904000699[/C][C]15.7765981765366[/C][/ROW]
[ROW][C]Trimmed Mean ( 8 / 24 )[/C][C]7940.375[/C][C]500.400097430163[/C][C]15.8680524659733[/C][/ROW]
[ROW][C]Trimmed Mean ( 9 / 24 )[/C][C]7878[/C][C]494.072956811735[/C][C]15.9450135681113[/C][/ROW]
[ROW][C]Trimmed Mean ( 10 / 24 )[/C][C]7819.65384615385[/C][C]488.737289269023[/C][C]15.9997078550099[/C][/ROW]
[ROW][C]Trimmed Mean ( 11 / 24 )[/C][C]7756.84[/C][C]481.981979813879[/C][C]16.0936307265997[/C][/ROW]
[ROW][C]Trimmed Mean ( 12 / 24 )[/C][C]7704.10416666667[/C][C]477.580776688135[/C][C]16.1315206614724[/C][/ROW]
[ROW][C]Trimmed Mean ( 13 / 24 )[/C][C]7645.26086956522[/C][C]471.734116583253[/C][C]16.2067160309275[/C][/ROW]
[ROW][C]Trimmed Mean ( 14 / 24 )[/C][C]7590.5[/C][C]467.134969585585[/C][C]16.2490511184248[/C][/ROW]
[ROW][C]Trimmed Mean ( 15 / 24 )[/C][C]7527[/C][C]461.585096589706[/C][C]16.3068523130646[/C][/ROW]
[ROW][C]Trimmed Mean ( 16 / 24 )[/C][C]7463.35[/C][C]455.775184333072[/C][C]16.3750687982738[/C][/ROW]
[ROW][C]Trimmed Mean ( 17 / 24 )[/C][C]7403[/C][C]450.437833469579[/C][C]16.4351203427497[/C][/ROW]
[ROW][C]Trimmed Mean ( 18 / 24 )[/C][C]7339.77777777778[/C][C]445.612152720903[/C][C]16.4712244335375[/C][/ROW]
[ROW][C]Trimmed Mean ( 19 / 24 )[/C][C]7267.91176470588[/C][C]438.937508226072[/C][C]16.5579646954267[/C][/ROW]
[ROW][C]Trimmed Mean ( 20 / 24 )[/C][C]7199.71875[/C][C]433.728788256962[/C][C]16.5995869882968[/C][/ROW]
[ROW][C]Trimmed Mean ( 21 / 24 )[/C][C]7120.7[/C][C]425.846748512174[/C][C]16.721273615164[/C][/ROW]
[ROW][C]Trimmed Mean ( 22 / 24 )[/C][C]7030.39285714286[/C][C]412.962638878170[/C][C]17.0242830592162[/C][/ROW]
[ROW][C]Trimmed Mean ( 23 / 24 )[/C][C]6936.57692307692[/C][C]398.609340942219[/C][C]17.4019427308966[/C][/ROW]
[ROW][C]Trimmed Mean ( 24 / 24 )[/C][C]6846.70833333333[/C][C]384.77322268517[/C][C]17.7941393258945[/C][/ROW]
[ROW][C]Median[/C][C]6011[/C][C][/C][C][/C][/ROW]
[ROW][C]Midrange[/C][C]10998[/C][C][/C][C][/C][/ROW]
[ROW][C]Midmean - Weighted Average at Xnp[/C][C]7263.56756756757[/C][C][/C][C][/C][/ROW]
[ROW][C]Midmean - Weighted Average at X(n+1)p[/C][C]7339.77777777778[/C][C][/C][C][/C][/ROW]
[ROW][C]Midmean - Empirical Distribution Function[/C][C]7263.56756756757[/C][C][/C][C][/C][/ROW]
[ROW][C]Midmean - Empirical Distribution Function - Averaging[/C][C]7339.77777777778[/C][C][/C][C][/C][/ROW]
[ROW][C]Midmean - Empirical Distribution Function - Interpolation[/C][C]7339.77777777778[/C][C][/C][C][/C][/ROW]
[ROW][C]Midmean - Closest Observation[/C][C]7263.56756756757[/C][C][/C][C][/C][/ROW]
[ROW][C]Midmean - True Basic - Statistics Graphics Toolkit[/C][C]7339.77777777778[/C][C][/C][C][/C][/ROW]
[ROW][C]Midmean - MS Excel (old versions)[/C][C]7403[/C][C][/C][C][/C][/ROW]
[ROW][C]Number of observations[/C][C]72[/C][C][/C][C][/C][/ROW]
[/TABLE]
Source: https://freestatistics.org/blog/index.php?pk=86648&T=1

Globally Unique Identifier (entire table): ba.freestatistics.org/blog/index.php?pk=86648&T=1

As an alternative you can also use a QR Code:  

The GUIDs for individual cells are displayed in the table below:

Central Tendency - Ungrouped Data
MeasureValueS.E.Value/S.E.
Arithmetic Mean8421.94444444445575.51557646298514.6337384927167
Geometric Mean7098.45577683783
Harmonic Mean5992.11353288074
Quadratic Mean9718.31461297002
Winsorized Mean ( 1 / 24 )8403.94444444445569.90881847943814.7461210845392
Winsorized Mean ( 2 / 24 )8400.33333333333565.35604753565114.8584831982426
Winsorized Mean ( 3 / 24 )8398.375561.85082986723114.9476952841461
Winsorized Mean ( 4 / 24 )8365.70833333333552.99675175190815.1279520301531
Winsorized Mean ( 5 / 24 )8330.98611111111544.5140004368815.2998565774744
Winsorized Mean ( 6 / 24 )8289.15277777778532.88185507025415.5553293828797
Winsorized Mean ( 7 / 24 )8356.625523.294968255815.9692439387551
Winsorized Mean ( 8 / 24 )8314.625512.02883774998216.2385873353093
Winsorized Mean ( 9 / 24 )8257.25499.06312764969816.5455020467790
Winsorized Mean ( 10 / 24 )8255.86111111111496.655383692616.6229167792954
Winsorized Mean ( 11 / 24 )8143.56944444444475.83642230581417.1142204814466
Winsorized Mean ( 12 / 24 )8155.23611111111473.25652293405417.2321684243273
Winsorized Mean ( 13 / 24 )8080.30555555556456.74568712459717.6910385436246
Winsorized Mean ( 14 / 24 )8109.08333333333449.90442766619518.0240131785274
Winsorized Mean ( 15 / 24 )8057.41666666667439.32699399043318.3403632758385
Winsorized Mean ( 16 / 24 )7972.97222222222425.10329085071318.7553763845648
Winsorized Mean ( 17 / 24 )7940.38888888889409.73939748091919.3791198447268
Winsorized Mean ( 18 / 24 )7950.63888888889403.58753450381519.6999119377254
Winsorized Mean ( 19 / 24 )7843.76388888889383.29426188565120.4640785653841
Winsorized Mean ( 20 / 24 )7858.20833333333377.51570039457320.8155801867844
Winsorized Mean ( 21 / 24 )7858.20833333333375.17104807275720.9456683123624
Winsorized Mean ( 22 / 24 )7775.70833333333356.0808154331321.8369201493630
Winsorized Mean ( 23 / 24 )7625.56944444444331.09256398448023.0315333956032
Winsorized Mean ( 24 / 24 )7432.23611111111302.90823634422824.5362628656457
Trimmed Mean ( 1 / 24 )8348.34285714286561.52738204012314.8672052764585
Trimmed Mean ( 2 / 24 )8289.4705882353551.3786390772115.0340800327495
Trimmed Mean ( 3 / 24 )8229541.94895208558815.184086929834
Trimmed Mean ( 4 / 24 )8165.484375532.00037202003715.3486441071369
Trimmed Mean ( 5 / 24 )8107.35483870968523.05203321812015.5000923881866
Trimmed Mean ( 6 / 24 )8053.68333333333514.64458828902415.649019763539
Trimmed Mean ( 7 / 24 )8004.96551724138507.39490400069915.7765981765366
Trimmed Mean ( 8 / 24 )7940.375500.40009743016315.8680524659733
Trimmed Mean ( 9 / 24 )7878494.07295681173515.9450135681113
Trimmed Mean ( 10 / 24 )7819.65384615385488.73728926902315.9997078550099
Trimmed Mean ( 11 / 24 )7756.84481.98197981387916.0936307265997
Trimmed Mean ( 12 / 24 )7704.10416666667477.58077668813516.1315206614724
Trimmed Mean ( 13 / 24 )7645.26086956522471.73411658325316.2067160309275
Trimmed Mean ( 14 / 24 )7590.5467.13496958558516.2490511184248
Trimmed Mean ( 15 / 24 )7527461.58509658970616.3068523130646
Trimmed Mean ( 16 / 24 )7463.35455.77518433307216.3750687982738
Trimmed Mean ( 17 / 24 )7403450.43783346957916.4351203427497
Trimmed Mean ( 18 / 24 )7339.77777777778445.61215272090316.4712244335375
Trimmed Mean ( 19 / 24 )7267.91176470588438.93750822607216.5579646954267
Trimmed Mean ( 20 / 24 )7199.71875433.72878825696216.5995869882968
Trimmed Mean ( 21 / 24 )7120.7425.84674851217416.721273615164
Trimmed Mean ( 22 / 24 )7030.39285714286412.96263887817017.0242830592162
Trimmed Mean ( 23 / 24 )6936.57692307692398.60934094221917.4019427308966
Trimmed Mean ( 24 / 24 )6846.70833333333384.7732226851717.7941393258945
Median6011
Midrange10998
Midmean - Weighted Average at Xnp7263.56756756757
Midmean - Weighted Average at X(n+1)p7339.77777777778
Midmean - Empirical Distribution Function7263.56756756757
Midmean - Empirical Distribution Function - Averaging7339.77777777778
Midmean - Empirical Distribution Function - Interpolation7339.77777777778
Midmean - Closest Observation7263.56756756757
Midmean - True Basic - Statistics Graphics Toolkit7339.77777777778
Midmean - MS Excel (old versions)7403
Number of observations72


Parameters (Session):
Parameters (R input):
R code (references can be found in the software module):
geomean <- function(x) {
return(exp(mean(log(x))))
}
harmean <- function(x) {
return(1/mean(1/x))
}
quamean <- function(x) {
return(sqrt(mean(x*x)))
}
winmean <- function(x) {
x <-sort(x[!is.na(x)])
n<-length(x)
denom <- 3
nodenom <- n/denom
if (nodenom>40) denom <- n/40
sqrtn = sqrt(n)
roundnodenom = floor(nodenom)
win <- array(NA,dim=c(roundnodenom,2))
for (j in 1:roundnodenom) {
win[j,1] <- (j*x[j+1]+sum(x[(j+1):(n-j)])+j*x[n-j])/n
win[j,2] <- sd(c(rep(x[j+1],j),x[(j+1):(n-j)],rep(x[n-j],j)))/sqrtn
}
return(win)
}
trimean <- function(x) {
x <-sort(x[!is.na(x)])
n<-length(x)
denom <- 3
nodenom <- n/denom
if (nodenom>40) denom <- n/40
sqrtn = sqrt(n)
roundnodenom = floor(nodenom)
tri <- array(NA,dim=c(roundnodenom,2))
for (j in 1:roundnodenom) {
tri[j,1] <- mean(x,trim=j/n)
tri[j,2] <- sd(x[(j+1):(n-j)]) / sqrt(n-j*2)
}
return(tri)
}
midrange <- function(x) {
return((max(x)+min(x))/2)
}
q1 <- function(data,n,p,i,f) {
np <- n*p;
i <<- floor(np)
f <<- np - i
qvalue <- (1-f)*data[i] + f*data[i+1]
}
q2 <- function(data,n,p,i,f) {
np <- (n+1)*p
i <<- floor(np)
f <<- np - i
qvalue <- (1-f)*data[i] + f*data[i+1]
}
q3 <- function(data,n,p,i,f) {
np <- n*p
i <<- floor(np)
f <<- np - i
if (f==0) {
qvalue <- data[i]
} else {
qvalue <- data[i+1]
}
}
q4 <- function(data,n,p,i,f) {
np <- n*p
i <<- floor(np)
f <<- np - i
if (f==0) {
qvalue <- (data[i]+data[i+1])/2
} else {
qvalue <- data[i+1]
}
}
q5 <- function(data,n,p,i,f) {
np <- (n-1)*p
i <<- floor(np)
f <<- np - i
if (f==0) {
qvalue <- data[i+1]
} else {
qvalue <- data[i+1] + f*(data[i+2]-data[i+1])
}
}
q6 <- function(data,n,p,i,f) {
np <- n*p+0.5
i <<- floor(np)
f <<- np - i
qvalue <- data[i]
}
q7 <- function(data,n,p,i,f) {
np <- (n+1)*p
i <<- floor(np)
f <<- np - i
if (f==0) {
qvalue <- data[i]
} else {
qvalue <- f*data[i] + (1-f)*data[i+1]
}
}
q8 <- function(data,n,p,i,f) {
np <- (n+1)*p
i <<- floor(np)
f <<- np - i
if (f==0) {
qvalue <- data[i]
} else {
if (f == 0.5) {
qvalue <- (data[i]+data[i+1])/2
} else {
if (f < 0.5) {
qvalue <- data[i]
} else {
qvalue <- data[i+1]
}
}
}
}
midmean <- function(x,def) {
x <-sort(x[!is.na(x)])
n<-length(x)
if (def==1) {
qvalue1 <- q1(x,n,0.25,i,f)
qvalue3 <- q1(x,n,0.75,i,f)
}
if (def==2) {
qvalue1 <- q2(x,n,0.25,i,f)
qvalue3 <- q2(x,n,0.75,i,f)
}
if (def==3) {
qvalue1 <- q3(x,n,0.25,i,f)
qvalue3 <- q3(x,n,0.75,i,f)
}
if (def==4) {
qvalue1 <- q4(x,n,0.25,i,f)
qvalue3 <- q4(x,n,0.75,i,f)
}
if (def==5) {
qvalue1 <- q5(x,n,0.25,i,f)
qvalue3 <- q5(x,n,0.75,i,f)
}
if (def==6) {
qvalue1 <- q6(x,n,0.25,i,f)
qvalue3 <- q6(x,n,0.75,i,f)
}
if (def==7) {
qvalue1 <- q7(x,n,0.25,i,f)
qvalue3 <- q7(x,n,0.75,i,f)
}
if (def==8) {
qvalue1 <- q8(x,n,0.25,i,f)
qvalue3 <- q8(x,n,0.75,i,f)
}
midm <- 0
myn <- 0
roundno4 <- round(n/4)
round3no4 <- round(3*n/4)
for (i in 1:n) {
if ((x[i]>=qvalue1) & (x[i]<=qvalue3)){
midm = midm + x[i]
myn = myn + 1
}
}
midm = midm / myn
return(midm)
}
(arm <- mean(x))
sqrtn <- sqrt(length(x))
(armse <- sd(x) / sqrtn)
(armose <- arm / armse)
(geo <- geomean(x))
(har <- harmean(x))
(qua <- quamean(x))
(win <- winmean(x))
(tri <- trimean(x))
(midr <- midrange(x))
midm <- array(NA,dim=8)
for (j in 1:8) midm[j] <- midmean(x,j)
midm
bitmap(file='test1.png')
lb <- win[,1] - 2*win[,2]
ub <- win[,1] + 2*win[,2]
if ((ylimmin == '') | (ylimmax == '')) plot(win[,1],type='b',main=main, xlab='j', pch=19, ylab='Winsorized Mean(j/n)', ylim=c(min(lb),max(ub))) else plot(win[,1],type='l',main=main, xlab='j', pch=19, ylab='Winsorized Mean(j/n)', ylim=c(ylimmin,ylimmax))
lines(ub,lty=3)
lines(lb,lty=3)
grid()
dev.off()
bitmap(file='test2.png')
lb <- tri[,1] - 2*tri[,2]
ub <- tri[,1] + 2*tri[,2]
if ((ylimmin == '') | (ylimmax == '')) plot(tri[,1],type='b',main=main, xlab='j', pch=19, ylab='Trimmed Mean(j/n)', ylim=c(min(lb),max(ub))) else plot(tri[,1],type='l',main=main, xlab='j', pch=19, ylab='Trimmed Mean(j/n)', ylim=c(ylimmin,ylimmax))
lines(ub,lty=3)
lines(lb,lty=3)
grid()
dev.off()
load(file='createtable')
a<-table.start()
a<-table.row.start(a)
a<-table.element(a,'Central Tendency - Ungrouped Data',4,TRUE)
a<-table.row.end(a)
a<-table.row.start(a)
a<-table.element(a,'Measure',header=TRUE)
a<-table.element(a,'Value',header=TRUE)
a<-table.element(a,'S.E.',header=TRUE)
a<-table.element(a,'Value/S.E.',header=TRUE)
a<-table.row.end(a)
a<-table.row.start(a)
a<-table.element(a,hyperlink('arithmetic_mean.htm', 'Arithmetic Mean', 'click to view the definition of the Arithmetic Mean'),header=TRUE)
a<-table.element(a,arm)
a<-table.element(a,hyperlink('arithmetic_mean_standard_error.htm', armse, 'click to view the definition of the Standard Error of the Arithmetic Mean'))
a<-table.element(a,armose)
a<-table.row.end(a)
a<-table.row.start(a)
a<-table.element(a,hyperlink('geometric_mean.htm', 'Geometric Mean', 'click to view the definition of the Geometric Mean'),header=TRUE)
a<-table.element(a,geo)
a<-table.element(a,'')
a<-table.row.end(a)
a<-table.row.start(a)
a<-table.element(a,hyperlink('harmonic_mean.htm', 'Harmonic Mean', 'click to view the definition of the Harmonic Mean'),header=TRUE)
a<-table.element(a,har)
a<-table.element(a,'')
a<-table.row.end(a)
a<-table.row.start(a)
a<-table.element(a,hyperlink('quadratic_mean.htm', 'Quadratic Mean', 'click to view the definition of the Quadratic Mean'),header=TRUE)
a<-table.element(a,qua)
a<-table.element(a,'')
a<-table.row.end(a)
for (j in 1:length(win[,1])) {
a<-table.row.start(a)
mylabel <- paste('Winsorized Mean (',j)
mylabel <- paste(mylabel,'/')
mylabel <- paste(mylabel,length(win[,1]))
mylabel <- paste(mylabel,')')
a<-table.element(a,hyperlink('winsorized_mean.htm', mylabel, 'click to view the definition of the Winsorized Mean'),header=TRUE)
a<-table.element(a,win[j,1])
a<-table.element(a,win[j,2])
a<-table.element(a,win[j,1]/win[j,2])
a<-table.row.end(a)
}
for (j in 1:length(tri[,1])) {
a<-table.row.start(a)
mylabel <- paste('Trimmed Mean (',j)
mylabel <- paste(mylabel,'/')
mylabel <- paste(mylabel,length(tri[,1]))
mylabel <- paste(mylabel,')')
a<-table.element(a,hyperlink('arithmetic_mean.htm', mylabel, 'click to view the definition of the Trimmed Mean'),header=TRUE)
a<-table.element(a,tri[j,1])
a<-table.element(a,tri[j,2])
a<-table.element(a,tri[j,1]/tri[j,2])
a<-table.row.end(a)
}
a<-table.row.start(a)
a<-table.element(a,hyperlink('median_1.htm', 'Median', 'click to view the definition of the Median'),header=TRUE)
a<-table.element(a,median(x))
a<-table.element(a,'')
a<-table.row.end(a)
a<-table.row.start(a)
a<-table.element(a,hyperlink('midrange.htm', 'Midrange', 'click to view the definition of the Midrange'),header=TRUE)
a<-table.element(a,midr)
a<-table.element(a,'')
a<-table.row.end(a)
a<-table.row.start(a)
mymid <- hyperlink('midmean.htm', 'Midmean', 'click to view the definition of the Midmean')
mylabel <- paste(mymid,hyperlink('method_1.htm','Weighted Average at Xnp',''),sep=' - ')
a<-table.element(a,mylabel,header=TRUE)
a<-table.element(a,midm[1])
a<-table.element(a,'')
a<-table.row.end(a)
a<-table.row.start(a)
mymid <- hyperlink('midmean.htm', 'Midmean', 'click to view the definition of the Midmean')
mylabel <- paste(mymid,hyperlink('method_2.htm','Weighted Average at X(n+1)p',''),sep=' - ')
a<-table.element(a,mylabel,header=TRUE)
a<-table.element(a,midm[2])
a<-table.element(a,'')
a<-table.row.end(a)
a<-table.row.start(a)
mymid <- hyperlink('midmean.htm', 'Midmean', 'click to view the definition of the Midmean')
mylabel <- paste(mymid,hyperlink('method_3.htm','Empirical Distribution Function',''),sep=' - ')
a<-table.element(a,mylabel,header=TRUE)
a<-table.element(a,midm[3])
a<-table.element(a,'')
a<-table.row.end(a)
a<-table.row.start(a)
mymid <- hyperlink('midmean.htm', 'Midmean', 'click to view the definition of the Midmean')
mylabel <- paste(mymid,hyperlink('method_4.htm','Empirical Distribution Function - Averaging',''),sep=' - ')
a<-table.element(a,mylabel,header=TRUE)
a<-table.element(a,midm[4])
a<-table.element(a,'')
a<-table.row.end(a)
a<-table.row.start(a)
mymid <- hyperlink('midmean.htm', 'Midmean', 'click to view the definition of the Midmean')
mylabel <- paste(mymid,hyperlink('method_5.htm','Empirical Distribution Function - Interpolation',''),sep=' - ')
a<-table.element(a,mylabel,header=TRUE)
a<-table.element(a,midm[5])
a<-table.element(a,'')
a<-table.row.end(a)
a<-table.row.start(a)
mymid <- hyperlink('midmean.htm', 'Midmean', 'click to view the definition of the Midmean')
mylabel <- paste(mymid,hyperlink('method_6.htm','Closest Observation',''),sep=' - ')
a<-table.element(a,mylabel,header=TRUE)
a<-table.element(a,midm[6])
a<-table.element(a,'')
a<-table.row.end(a)
a<-table.row.start(a)
mymid <- hyperlink('midmean.htm', 'Midmean', 'click to view the definition of the Midmean')
mylabel <- paste(mymid,hyperlink('method_7.htm','True Basic - Statistics Graphics Toolkit',''),sep=' - ')
a<-table.element(a,mylabel,header=TRUE)
a<-table.element(a,midm[7])
a<-table.element(a,'')
a<-table.row.end(a)
a<-table.row.start(a)
mymid <- hyperlink('midmean.htm', 'Midmean', 'click to view the definition of the Midmean')
mylabel <- paste(mymid,hyperlink('method_8.htm','MS Excel (old versions)',''),sep=' - ')
a<-table.element(a,mylabel,header=TRUE)
a<-table.element(a,midm[8])
a<-table.element(a,'')
a<-table.row.end(a)
a<-table.row.start(a)
a<-table.element(a,'Number of observations',header=TRUE)
a<-table.element(a,length(x))
a<-table.element(a,'')
a<-table.row.end(a)
a<-table.end(a)
table.save(a,file='mytable.tab')