Free Statistics

of Irreproducible Research!

Author's title

Author*The author of this computation has been verified*
R Software Modulerwasp_rnglnorm.wasp
Title produced by softwareRandom Number Generator - Log-Normal Distribution
Date of computationTue, 19 Oct 2010 14:46:10 +0000
Cite this page as followsStatistical Computations at FreeStatistics.org, Office for Research Development and Education, URL https://freestatistics.org/blog/index.php?v=date/2010/Oct/19/t1287499501jpnfxmvd9b3sgl1.htm/, Retrieved Sun, 28 Apr 2024 22:03:28 +0000
Statistical Computations at FreeStatistics.org, Office for Research Development and Education, URL https://freestatistics.org/blog/index.php?pk=86573, Retrieved Sun, 28 Apr 2024 22:03:28 +0000
QR Codes:

Original text written by user:
IsPrivate?No (this computation is public)
User-defined keywords
Estimated Impact89
Family? (F = Feedback message, R = changed R code, M = changed R Module, P = changed Parameters, D = changed Data)
F       [Random Number Generator - Log-Normal Distribution] [] [2010-10-19 14:46:10] [4dba6678eac10ee5c3460d144a14bd5c] [Current]
Feedback Forum
2010-10-24 13:52:59 [201022de16daa1dc0c172603d7d3cd57] [reply
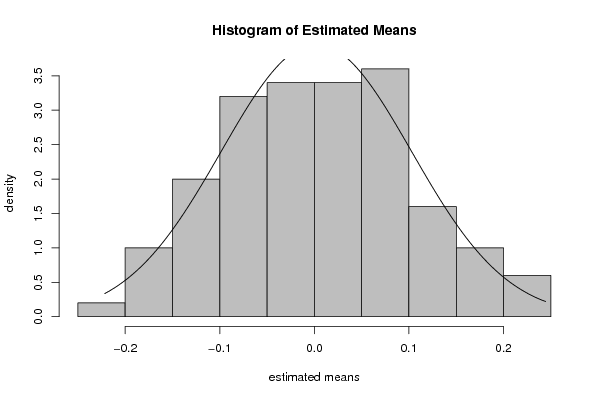
Als we een aselecte steekproef nemen uit een willekeurige populatie met voldoende waarnemingen, dan zal de kansverdeling nijgen naar een normaal verdeling. Merk op dat hoe meer waarnemingen we gebruiken hoe dichter we in de buurt komen van een normaal verdeling.

Post a new message


Summary of computational transaction
Raw Inputview raw input (R code)
Raw Outputview raw output of R engine
Computing time5 seconds
R Server'Gwilym Jenkins' @ 72.249.127.135

\begin{tabular}{lllllllll}
\hline
Summary of computational transaction \tabularnewline
Raw Input & view raw input (R code)  \tabularnewline
Raw Output & view raw output of R engine  \tabularnewline
Computing time & 5 seconds \tabularnewline
R Server & 'Gwilym Jenkins' @ 72.249.127.135 \tabularnewline
\hline
\end{tabular}
%Source: https://freestatistics.org/blog/index.php?pk=86573&T=0

[TABLE]
[ROW][C]Summary of computational transaction[/C][/ROW]
[ROW][C]Raw Input[/C][C]view raw input (R code) [/C][/ROW]
[ROW][C]Raw Output[/C][C]view raw output of R engine [/C][/ROW]
[ROW][C]Computing time[/C][C]5 seconds[/C][/ROW]
[ROW][C]R Server[/C][C]'Gwilym Jenkins' @ 72.249.127.135[/C][/ROW]
[/TABLE]
Source: https://freestatistics.org/blog/index.php?pk=86573&T=0

Globally Unique Identifier (entire table): ba.freestatistics.org/blog/index.php?pk=86573&T=0

As an alternative you can also use a QR Code:  

The GUIDs for individual cells are displayed in the table below:

Summary of computational transaction
Raw Inputview raw input (R code)
Raw Outputview raw output of R engine
Computing time5 seconds
R Server'Gwilym Jenkins' @ 72.249.127.135


ParameterX1X2X3X4X5X6X7X8X9X10
(SD)(SD)(SD)(SD)(SD)(SD)(SD)(SD)(SD)(SD)
# simulated values100100100100100100100100100100
true mean0000000000
true standard deviation1111111111
mean-0.03-0.03-0.04-0.05-0.140.09-0.110.170.05-0.13
0.090.090.090.10.10.090.10.10.090.1
standard deviation0.950.870.90.991.040.911.041.010.91
0.070.060.060.070.070.060.070.070.060.07

\begin{tabular}{lllllllll}
\hline
Parameter & X1 & X2 & X3 & X4 & X5 & X6 & X7 & X8 & X9 & X10 \tabularnewline
  & (SD) & (SD) & (SD) & (SD) & (SD) & (SD) & (SD) & (SD) & (SD) & (SD) \tabularnewline
# simulated values & 100 & 100 & 100 & 100 & 100 & 100 & 100 & 100 & 100 & 100 \tabularnewline
true mean & 0 & 0 & 0 & 0 & 0 & 0 & 0 & 0 & 0 & 0 \tabularnewline
true standard deviation & 1 & 1 & 1 & 1 & 1 & 1 & 1 & 1 & 1 & 1 \tabularnewline
mean & -0.03 & -0.03 & -0.04 & -0.05 & -0.14 & 0.09 & -0.11 & 0.17 & 0.05 & -0.13 \tabularnewline
  & 0.09 & 0.09 & 0.09 & 0.1 & 0.1 & 0.09 & 0.1 & 0.1 & 0.09 & 0.1 \tabularnewline
standard deviation & 0.95 & 0.87 & 0.9 & 0.99 & 1.04 & 0.91 & 1.04 & 1.01 & 0.9 & 1 \tabularnewline
  & 0.07 & 0.06 & 0.06 & 0.07 & 0.07 & 0.06 & 0.07 & 0.07 & 0.06 & 0.07 \tabularnewline
\hline
\end{tabular}
%Source: https://freestatistics.org/blog/index.php?pk=86573&T=1

[TABLE]
[ROW][C]Parameter[/C][C]X1[/C][C]X2[/C][C]X3[/C][C]X4[/C][C]X5[/C][C]X6[/C][C]X7[/C][C]X8[/C][C]X9[/C][C]X10[/C][/ROW]
[ROW][C] [/C][C](SD)[/C][C](SD)[/C][C](SD)[/C][C](SD)[/C][C](SD)[/C][C](SD)[/C][C](SD)[/C][C](SD)[/C][C](SD)[/C][C](SD)[/C][/ROW]
[ROW][C]# simulated values[/C][C]100[/C][C]100[/C][C]100[/C][C]100[/C][C]100[/C][C]100[/C][C]100[/C][C]100[/C][C]100[/C][C]100[/C][/ROW]
[ROW][C]true mean[/C][C]0[/C][C]0[/C][C]0[/C][C]0[/C][C]0[/C][C]0[/C][C]0[/C][C]0[/C][C]0[/C][C]0[/C][/ROW]
[ROW][C]true standard deviation[/C][C]1[/C][C]1[/C][C]1[/C][C]1[/C][C]1[/C][C]1[/C][C]1[/C][C]1[/C][C]1[/C][C]1[/C][/ROW]
[ROW][C]mean[/C][C]-0.03[/C][C]-0.03[/C][C]-0.04[/C][C]-0.05[/C][C]-0.14[/C][C]0.09[/C][C]-0.11[/C][C]0.17[/C][C]0.05[/C][C]-0.13[/C][/ROW]
[ROW][C] [/C][C]0.09[/C][C]0.09[/C][C]0.09[/C][C]0.1[/C][C]0.1[/C][C]0.09[/C][C]0.1[/C][C]0.1[/C][C]0.09[/C][C]0.1[/C][/ROW]
[ROW][C]standard deviation[/C][C]0.95[/C][C]0.87[/C][C]0.9[/C][C]0.99[/C][C]1.04[/C][C]0.91[/C][C]1.04[/C][C]1.01[/C][C]0.9[/C][C]1[/C][/ROW]
[ROW][C] [/C][C]0.07[/C][C]0.06[/C][C]0.06[/C][C]0.07[/C][C]0.07[/C][C]0.06[/C][C]0.07[/C][C]0.07[/C][C]0.06[/C][C]0.07[/C][/ROW]
[/TABLE]
Source: https://freestatistics.org/blog/index.php?pk=86573&T=1

Globally Unique Identifier (entire table): ba.freestatistics.org/blog/index.php?pk=86573&T=1

As an alternative you can also use a QR Code:  

The GUIDs for individual cells are displayed in the table below:

ParameterX1X2X3X4X5X6X7X8X9X10
(SD)(SD)(SD)(SD)(SD)(SD)(SD)(SD)(SD)(SD)
# simulated values100100100100100100100100100100
true mean0000000000
true standard deviation1111111111
mean-0.03-0.03-0.04-0.05-0.140.09-0.110.170.05-0.13
0.090.090.090.10.10.090.10.10.090.1
standard deviation0.950.870.90.991.040.911.041.010.91
0.070.060.060.070.070.060.070.070.060.07


Parameters (Session):
par1 = 100 ; par2 = 0 ; par3 = 1 ; par4 = 8 ; par5 = N ; par6 = 0 ; par7 = 100 ;
Parameters (R input):
par1 = 100 ; par2 = 0 ; par3 = 1 ; par4 = 8 ; par5 = N ; par6 = 0 ; par7 = 100 ;
R code (references can be found in the software module):
library(MASS)
par1 <- as.numeric(par1)
par2 <- as.numeric(par2)
par2 <- round(par2,2) #rounded (we want to be able to display 10 columns)
par3 <- as.numeric(par3)
par3 <- round(par3,2) #rounded (we want to be able to display 10 columns)
par4 <- as.numeric(par4)
if (par6 == '0') par6 = 'Sturges' else par6 <- as.numeric(par6)
par7 <- as.numeric(par7)
x <- array(NA,dim=c(par7,par1))
rest.mean <- array(NA,dim=c(par7))
rest.sd <- array(NA,dim=c(par7))
rsd.mean <- array(NA,dim=c(par7))
rsd.sd <- array(NA,dim=c(par7))
for (i in 1:par7)
{
x[i,] <- rlnorm(par1,par2,par3)
x[i,] <- as.ts(x[i,]) #otherwise the fitdistr function does not work properly
dum <- fitdistr(x[i,],'log-normal')
rest.mean[i] <- dum$estimate[1]
rest.sd[i] <- dum$estimate[2]
rsd.mean[i] <- dum$sd[1]
rsd.sd[i] <- dum$sd[2]
}
nc <- par7
if (nc > 10) nc = 10
if (par5 == 'Y')
{
load(file='createtable')
a<-table.start()
a<-table.row.start(a)
a<-table.element(a,'Index',1,TRUE)
for (j in 1:nc)
{
a<-table.element(a,paste('X',j),1,TRUE)
}
a<-table.row.end(a)
if (nc < par7)
{
a<-table.row.start(a)
a<-table.element(a,'Note: only the first 10 series are displayed',nc+1,TRUE)
a<-table.row.end(a)
}
for (i in 1:par1)
{
a<-table.row.start(a)
a<-table.element(a,i,header=TRUE)
for (j in 1:nc)
{
a<-table.element(a,round(x[j,i],2))
}
a<-table.row.end(a)
}
a<-table.end(a)
table.save(a,file='mytable1.tab')
}
load(file='createtable')
a<-table.start()
a<-table.row.start(a)
a<-table.element(a,'Parameter',1,TRUE)
for (j in 1:nc)
{
a<-table.element(a,paste('X',j,sep=''),1,TRUE)
}
a<-table.row.end(a)
a<-table.row.start(a)
a<-table.element(a,' ',1,TRUE)
for (j in 1:nc)
{
a<-table.element(a,'(SD)',1,TRUE)
}
a<-table.row.end(a)
a<-table.row.start(a)
a<-table.element(a,'# simulated values',header=TRUE)
for (j in 1:nc)
{
a<-table.element(a,par1)
}
a<-table.row.end(a)
a<-table.row.start(a)
a<-table.element(a,'true mean',header=TRUE)
for (j in 1:nc)
{
a<-table.element(a,par2)
}
a<-table.row.end(a)
a<-table.row.start(a)
a<-table.element(a,'true standard deviation',header=TRUE)
for (j in 1:nc)
{
a<-table.element(a,par3)
}
a<-table.row.end(a)
a<-table.row.start(a)
a<-table.element(a,'mean',header=TRUE)
for (j in 1:nc)
{
a<-table.element(a,round(rest.mean[j],2))
}
a<-table.row.end(a)
a<-table.row.start(a)
a<-table.element(a,' ',header=TRUE)
for (j in 1:nc)
{
a<-table.element(a,round(rsd.mean[j],2))
}
a<-table.row.end(a)
a<-table.row.start(a)
a<-table.element(a,'standard deviation',header=TRUE)
for (j in 1:nc)
{
a<-table.element(a,round(rest.sd[j],2))
}
a<-table.row.end(a)
a<-table.row.start(a)
a<-table.element(a,' ',header=TRUE)
for (j in 1:nc)
{
a<-table.element(a,round(rsd.sd[j],2))
}
a<-table.row.end(a)
a<-table.end(a)
table.save(a,file='mytable.tab')
bitmap(file='test0.png')
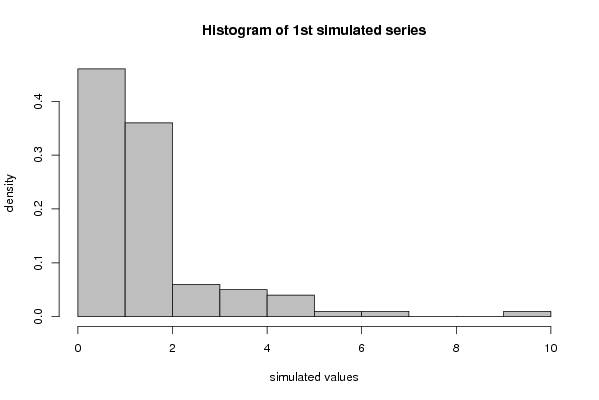
myhist<-hist(x[1,],col=par4,breaks=par6,main='Histogram of 1st simulated series',ylab='density',xlab='simulated values',freq=F)
dev.off()
bitmap(file='test1.png')
myhist<-hist(rest.mean[],col=par4,breaks=par6,main='Histogram of Estimated Means',ylab='density',xlab='estimated means',freq=F)
x <- rest.mean[]
dummean <- mean(x)
dumsd <- sd(x)
curve(1/(dumsd*sqrt(2*pi))*exp(-1/2*((x-dummean)/dumsd)^2),min(x),max(x),add=T)
dev.off()
bitmap(file='test2.png')
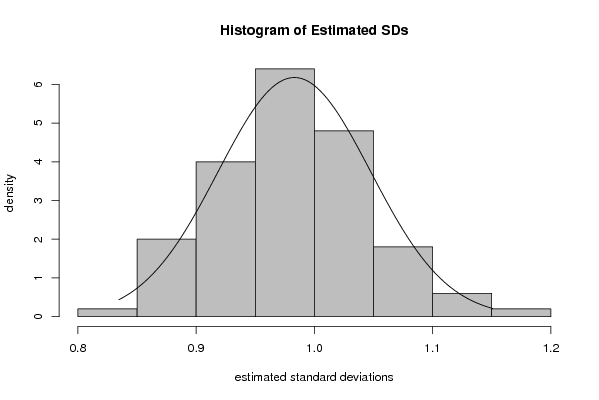
myhist<-hist(rest.sd[],col=par4,breaks=par6,main='Histogram of Estimated SDs',ylab='density',xlab='estimated standard deviations',freq=F)
x <- rest.sd[]
dummean <- mean(x)
dumsd <- sd(x)
curve(1/(dumsd*sqrt(2*pi))*exp(-1/2*((x-dummean)/dumsd)^2),min(x),max(x),add=T)
dev.off()