Free Statistics
of Irreproducible Research!
Description of Statistical Computation | ||||||||||||||||||||||||||||||||||
|---|---|---|---|---|---|---|---|---|---|---|---|---|---|---|---|---|---|---|---|---|---|---|---|---|---|---|---|---|---|---|---|---|---|---|
| Author's title | ||||||||||||||||||||||||||||||||||
| Author | *The author of this computation has been verified* | |||||||||||||||||||||||||||||||||
| R Software Module | Ian.Hollidayrwasp_Reddy-Moores DAta.wasp | |||||||||||||||||||||||||||||||||
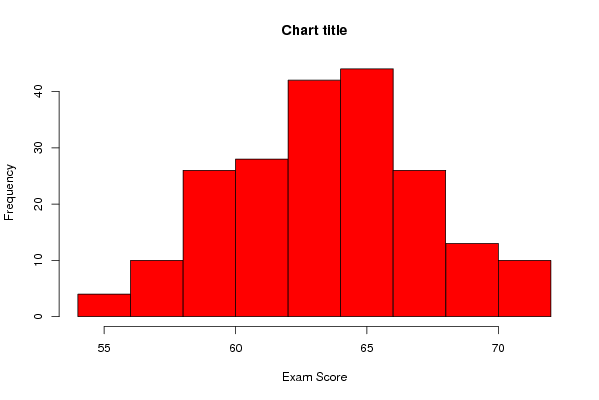
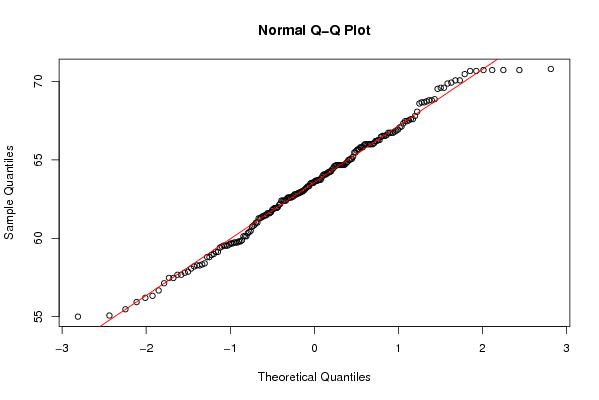
| Title produced by software | Histogram and QQPlot (Reddy-Moores Data) | |||||||||||||||||||||||||||||||||
| Date of computation | Tue, 19 Oct 2010 09:26:10 +0000 | |||||||||||||||||||||||||||||||||
| Cite this page as follows | Statistical Computations at FreeStatistics.org, Office for Research Development and Education, URL https://freestatistics.org/blog/index.php?v=date/2010/Oct/19/t1287480300ti0i14gp51pjvoh.htm/, Retrieved Sun, 28 Apr 2024 23:44:15 +0000 | |||||||||||||||||||||||||||||||||
| Statistical Computations at FreeStatistics.org, Office for Research Development and Education, URL https://freestatistics.org/blog/index.php?pk=86061, Retrieved Sun, 28 Apr 2024 23:44:15 +0000 | ||||||||||||||||||||||||||||||||||
| QR Codes: | ||||||||||||||||||||||||||||||||||
|
| ||||||||||||||||||||||||||||||||||
| Original text written by user: | ||||||||||||||||||||||||||||||||||
| IsPrivate? | No (this computation is public) | |||||||||||||||||||||||||||||||||
| User-defined keywords | ||||||||||||||||||||||||||||||||||
| Estimated Impact | 114 | |||||||||||||||||||||||||||||||||
Tree of Dependent Computations | ||||||||||||||||||||||||||||||||||
| Family? (F = Feedback message, R = changed R code, M = changed R Module, P = changed Parameters, D = changed Data) | ||||||||||||||||||||||||||||||||||
| - [Histogram and QQPlot (Reddy-Moores Data)] [compendium week2] [2010-10-18 19:39:19] [358781f0bd1d7f23f7c8aa2873c865a2] - D [Histogram and QQPlot (Reddy-Moores Data)] [] [2010-10-19 09:26:10] [ecc74d33c51bc9608e49685e75dbd019] [Current] - D [Histogram and QQPlot (Reddy-Moores Data)] [] [2010-10-19 09:32:22] [358781f0bd1d7f23f7c8aa2873c865a2] - D [Histogram and QQPlot (Reddy-Moores Data)] [] [2010-10-19 09:38:07] [358781f0bd1d7f23f7c8aa2873c865a2] - D [Histogram and QQPlot (Reddy-Moores Data)] [] [2010-10-19 09:42:00] [358781f0bd1d7f23f7c8aa2873c865a2] - D [Histogram and QQPlot (Reddy-Moores Data)] [] [2010-10-19 09:46:24] [358781f0bd1d7f23f7c8aa2873c865a2] | ||||||||||||||||||||||||||||||||||
| Feedback Forum | ||||||||||||||||||||||||||||||||||
Post a new message | ||||||||||||||||||||||||||||||||||
Dataset | ||||||||||||||||||||||||||||||||||
| Dataseries X: | ||||||||||||||||||||||||||||||||||
55.00 55.07 55.47 55.93 56.20 56.33 56.67 57.13 57.47 57.47 57.67 57.67 57.80 57.87 58.07 58.20 58.27 58.27 58.33 58.40 58.80 58.80 58.93 59.00 59.13 59.13 59.40 59.47 59.53 59.53 59.53 59.60 59.67 59.67 59.73 59.73 59.73 59.80 59.80 59.87 60.13 60.13 60.13 60.33 60.40 60.47 60.73 60.80 60.87 61.00 61.00 61.27 61.27 61.33 61.40 61.40 61.47 61.47 61.60 61.60 61.60 61.67 61.80 61.87 61.93 61.93 61.93 62.00 62.13 62.20 62.40 62.40 62.40 62.40 62.40 62.53 62.60 62.60 62.60 62.60 62.67 62.67 62.80 62.80 62.80 62.87 62.87 62.93 62.93 63.00 63.00 63.07 63.13 63.20 63.27 63.33 63.33 63.47 63.53 63.53 63.53 63.60 63.67 63.67 63.67 63.73 63.73 63.73 63.87 64.00 64.07 64.07 64.07 64.13 64.20 64.20 64.27 64.27 64.40 64.47 64.60 64.60 64.67 64.67 64.67 64.67 64.67 64.67 64.67 64.67 64.73 64.80 64.87 65.00 65.00 65.07 65.07 65.20 65.47 65.47 65.60 65.67 65.67 65.80 65.80 65.80 65.93 66.00 66.00 66.00 66.00 66.00 66.00 66.00 66.07 66.20 66.20 66.27 66.27 66.47 66.53 66.53 66.53 66.60 66.73 66.73 66.73 66.73 66.80 66.87 66.93 67.07 67.13 67.33 67.47 67.47 67.53 67.60 67.60 67.80 68.07 68.60 68.67 68.67 68.73 68.80 68.80 68.87 69.53 69.60 69.60 69.87 69.93 70.07 70.07 70.47 70.67 70.67 70.73 70.73 70.73 70.73 70.80 | ||||||||||||||||||||||||||||||||||
Tables (Output of Computation) | ||||||||||||||||||||||||||||||||||
| ||||||||||||||||||||||||||||||||||
Figures (Output of Computation) | ||||||||||||||||||||||||||||||||||
Input Parameters & R Code | ||||||||||||||||||||||||||||||||||
| Parameters (Session): | ||||||||||||||||||||||||||||||||||
| par1 = 10 ; | ||||||||||||||||||||||||||||||||||
| Parameters (R input): | ||||||||||||||||||||||||||||||||||
| par1 = 10 ; | ||||||||||||||||||||||||||||||||||
| R code (references can be found in the software module): | ||||||||||||||||||||||||||||||||||
bitmap(file='test1.png') | ||||||||||||||||||||||||||||||||||