Free Statistics

of Irreproducible Research!

Author's title

Author*The author of this computation has been verified*
R Software Modulerwasp_tukeylambda.wasp
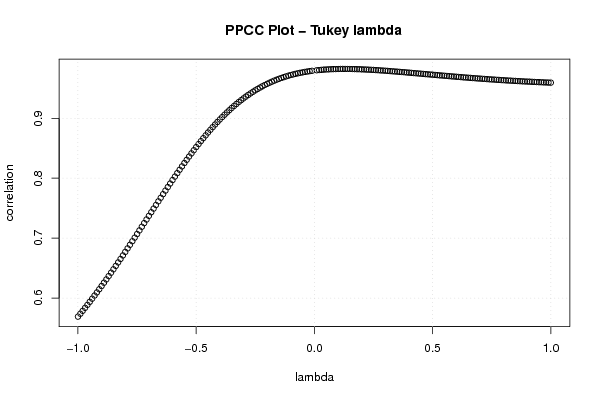
Title produced by softwareTukey lambda PPCC Plot
Date of computationSat, 16 Oct 2010 15:30:31 +0000
Cite this page as followsStatistical Computations at FreeStatistics.org, Office for Research Development and Education, URL https://freestatistics.org/blog/index.php?v=date/2010/Oct/16/t1287242982153zwbkq0n5wy9a.htm/, Retrieved Sat, 27 Apr 2024 14:07:26 +0000
Statistical Computations at FreeStatistics.org, Office for Research Development and Education, URL https://freestatistics.org/blog/index.php?pk=83872, Retrieved Sat, 27 Apr 2024 14:07:26 +0000
QR Codes:

Original text written by user:
IsPrivate?No (this computation is public)
User-defined keywords
Estimated Impact114
Family? (F = Feedback message, R = changed R code, M = changed R Module, P = changed Parameters, D = changed Data)
-     [Tukey lambda PPCC Plot] [Intrinsic Motivat...] [2010-10-12 12:09:04] [b98453cac15ba1066b407e146608df68]
F    D    [Tukey lambda PPCC Plot] [Ws 3 - Q3 - Extri...] [2010-10-16 15:30:31] [0829c729852d8a4b1b0c41cf0848af95] [Current]
Feedback Forum
2010-10-24 06:35:25 [6f5a430a34dfbeab884e51a2f2a26434] [reply
Hier maak je een foute conclusie. De verdeling is ook hier normaal verdeeld, als je bijvoorbeeld kijkt naar de hoogste correlatiewaarde bij de Tukey lambda, dan zie je dat deze overeen komt met de approx. Normal (lambda=0.14). Ook wijst de QQ-plot niet op een sterke afwijking, bijna alle punten liggen netjes op de rechte.

Post a new message
Dataseries X:
17
17
18
21
20
28
19
22
16
18
25
17
14
11
27
20
22
22
21
23
17
24
14
17
23
24
24
8
22
23
25
21
24
15
22
21
25
16
28
23
21
21
26
22
21
18
12
25
17
24
15
13
26
16
24
21
20
14
25
25
20
22
20
26
18
22
24
17
24
20
19
20
15
23
26
22
20
24
26
21
25
13
20
22
23
28
22
20
6
21
20
18
23
20
24
22
21
18
21
23
23
15
21
24
23
21
21
20
11
22
27
25
18
20
24
10
27
21
21
18
15
24
22
14
28
18
26
17
19
22
18
24
15
18
26
11
26
21
23
23
15
22
26
16
20
18
22
16
19
20
19
23
24
25
21
21
23
27
23
18
16
16


Summary of computational transaction
Raw Inputview raw input (R code)
Raw Outputview raw output of R engine
Computing time2 seconds
R Server'RServer@AstonUniversity' @ vre.aston.ac.uk

\begin{tabular}{lllllllll}
\hline
Summary of computational transaction \tabularnewline
Raw Input & view raw input (R code)  \tabularnewline
Raw Output & view raw output of R engine  \tabularnewline
Computing time & 2 seconds \tabularnewline
R Server & 'RServer@AstonUniversity' @ vre.aston.ac.uk \tabularnewline
\hline
\end{tabular}
%Source: https://freestatistics.org/blog/index.php?pk=83872&T=0

[TABLE]
[ROW][C]Summary of computational transaction[/C][/ROW]
[ROW][C]Raw Input[/C][C]view raw input (R code) [/C][/ROW]
[ROW][C]Raw Output[/C][C]view raw output of R engine [/C][/ROW]
[ROW][C]Computing time[/C][C]2 seconds[/C][/ROW]
[ROW][C]R Server[/C][C]'RServer@AstonUniversity' @ vre.aston.ac.uk[/C][/ROW]
[/TABLE]
Source: https://freestatistics.org/blog/index.php?pk=83872&T=0

Globally Unique Identifier (entire table): ba.freestatistics.org/blog/index.php?pk=83872&T=0

As an alternative you can also use a QR Code:  

The GUIDs for individual cells are displayed in the table below:

Summary of computational transaction
Raw Inputview raw input (R code)
Raw Outputview raw output of R engine
Computing time2 seconds
R Server'RServer@AstonUniversity' @ vre.aston.ac.uk


Tukey Lambda - Key Values
Distribution (lambda)Correlation
Approx. Cauchy (lambda=-1)0.568937474494277
Exact Logistic (lambda=0)0.979638929264212
Approx. Normal (lambda=0.14)0.982289060668812
U-shaped (lambda=0.5)0.972679027481748
Exactly Uniform (lambda=1)0.959434494091641

\begin{tabular}{lllllllll}
\hline
Tukey Lambda - Key Values \tabularnewline
Distribution (lambda) & Correlation \tabularnewline
Approx. Cauchy (lambda=-1) & 0.568937474494277 \tabularnewline
Exact Logistic (lambda=0) & 0.979638929264212 \tabularnewline
Approx. Normal (lambda=0.14) & 0.982289060668812 \tabularnewline
U-shaped (lambda=0.5) & 0.972679027481748 \tabularnewline
Exactly Uniform (lambda=1) & 0.959434494091641 \tabularnewline
\hline
\end{tabular}
%Source: https://freestatistics.org/blog/index.php?pk=83872&T=1

[TABLE]
[ROW][C]Tukey Lambda - Key Values[/C][/ROW]
[ROW][C]Distribution (lambda)[/C][C]Correlation[/C][/ROW]
[ROW][C]Approx. Cauchy (lambda=-1)[/C][C]0.568937474494277[/C][/ROW]
[ROW][C]Exact Logistic (lambda=0)[/C][C]0.979638929264212[/C][/ROW]
[ROW][C]Approx. Normal (lambda=0.14)[/C][C]0.982289060668812[/C][/ROW]
[ROW][C]U-shaped (lambda=0.5)[/C][C]0.972679027481748[/C][/ROW]
[ROW][C]Exactly Uniform (lambda=1)[/C][C]0.959434494091641[/C][/ROW]
[/TABLE]
Source: https://freestatistics.org/blog/index.php?pk=83872&T=1

Globally Unique Identifier (entire table): ba.freestatistics.org/blog/index.php?pk=83872&T=1

As an alternative you can also use a QR Code:  

The GUIDs for individual cells are displayed in the table below:

Tukey Lambda - Key Values
Distribution (lambda)Correlation
Approx. Cauchy (lambda=-1)0.568937474494277
Exact Logistic (lambda=0)0.979638929264212
Approx. Normal (lambda=0.14)0.982289060668812
U-shaped (lambda=0.5)0.972679027481748
Exactly Uniform (lambda=1)0.959434494091641


Parameters (Session):
Parameters (R input):
R code (references can be found in the software module):
gp <- function(lambda, p)
{
(p^lambda-(1-p)^lambda)/lambda
}
sortx <- sort(x)
c <- array(NA,dim=c(201))
for (i in 1:201)
{
if (i != 101) c[i] <- cor(gp(ppoints(x), lambda=(i-101)/100),sortx)
}
bitmap(file='test1.png')
plot((-100:100)/100,c[1:201],xlab='lambda',ylab='correlation',main='PPCC Plot - Tukey lambda')
grid()
dev.off()
load(file='createtable')
a<-table.start()
a<-table.row.start(a)
a<-table.element(a,'Tukey Lambda - Key Values',2,TRUE)
a<-table.row.end(a)
a<-table.row.start(a)
a<-table.element(a,'Distribution (lambda)',1,TRUE)
a<-table.element(a,'Correlation',1,TRUE)
a<-table.row.end(a)
a<-table.row.start(a)
a<-table.element(a,'Approx. Cauchy (lambda=-1)',header=TRUE)
a<-table.element(a,c[1])
a<-table.row.end(a)
a<-table.row.start(a)
a<-table.element(a,'Exact Logistic (lambda=0)',header=TRUE)
a<-table.element(a,(c[100]+c[102])/2)
a<-table.row.end(a)
a<-table.row.start(a)
a<-table.element(a,'Approx. Normal (lambda=0.14)',header=TRUE)
a<-table.element(a,c[115])
a<-table.row.end(a)
a<-table.row.start(a)
a<-table.element(a,'U-shaped (lambda=0.5)',header=TRUE)
a<-table.element(a,c[151])
a<-table.row.end(a)
a<-table.row.start(a)
a<-table.element(a,'Exactly Uniform (lambda=1)',header=TRUE)
a<-table.element(a,c[201])
a<-table.row.end(a)
a<-table.end(a)
table.save(a,file='mytable.tab')