Free Statistics

of Irreproducible Research!

Author's title

Author*The author of this computation has been verified*
R Software Modulerwasp_babies.wasp
Title produced by softwareExercise 1.13
Date of computationTue, 12 Oct 2010 10:25:53 +0000
Cite this page as followsStatistical Computations at FreeStatistics.org, Office for Research Development and Education, URL https://freestatistics.org/blog/index.php?v=date/2010/Oct/12/t128687909446ffigeczdl0e8o.htm/, Retrieved Tue, 30 Apr 2024 15:53:35 +0000
Statistical Computations at FreeStatistics.org, Office for Research Development and Education, URL https://freestatistics.org/blog/index.php?pk=82832, Retrieved Tue, 30 Apr 2024 15:53:35 +0000
QR Codes:

Original text written by user:
IsPrivate?No (this computation is public)
User-defined keywords
Estimated Impact115
Family? (F = Feedback message, R = changed R code, M = changed R Module, P = changed Parameters, D = changed Data)
F     [Exercise 1.13] [babies] [2010-10-12 09:24:37] [3df61981e9f4dafed65341be376c4457]
F   P     [Exercise 1.13] [task 2 babies] [2010-10-12 10:25:53] [6e52d1bada9435d33ddf990b22ee4b00] [Current]
Feedback Forum
2010-10-18 19:21:31 [] [reply
JGedeeltelijk juist (1/2)
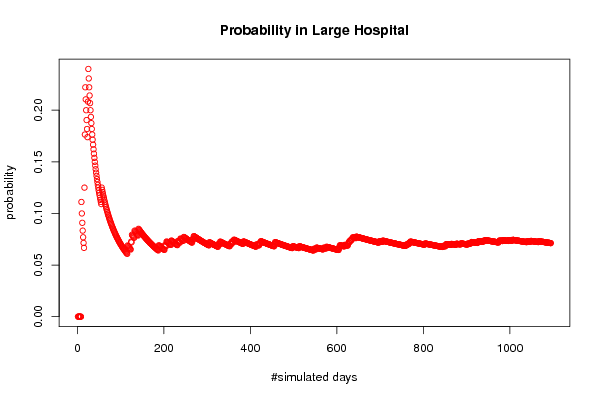
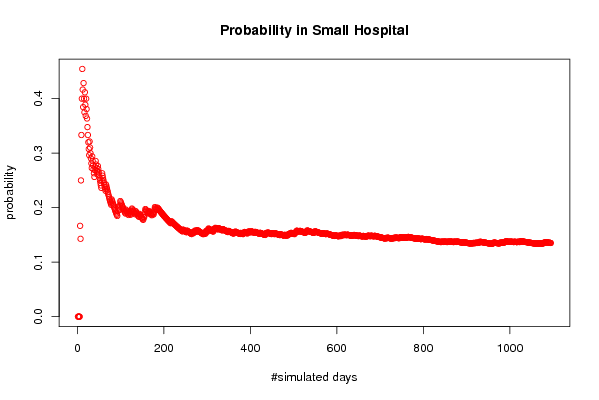
Door de periode groter te maken, worden de gegevens betrouwbaarder want het kan zijn dat er in het eerste jaar slechte metingen waren maar het is bijna onmogelijk dat je gedurende 10 jaar slechte metingen hebt. M.a.w. hoe langer de periode, hoe meer de grafiek geconvergeerd wordt.
Je bent er nog vergeten bij te vermelden dat we zeker gebruik kunnen maken van de formule van de binomiaal verdeling. Deze formule is wetenschappelijker en nauwkeuriger en wordt als volgt geïnterpreteerd: p = de kans op een jongen, q = de kans op een meisje (= p - 1) (In het geval van deze oefening zijn beide kansen 0,5), n = aantal geboortes (voor de grote ziekenhuizen is dit 45) en x = de succeskans, in dit geval 27 (= 60% van de 45 geboortes) De kans dat min. 60% van de geboortes jongetjes zijn is 6,67% in de grote ziekenhuizen(De kans dat er op een dag van 45 geboortes tussen de 0 en de 27 jongetjes worden geboren is 0,9342 --> 1 - 0,9342 = 0,0676)
2010-10-19 16:54:15 [07e9eb4976a13216fde13362eef7fcc8] [reply
Je vergroot de tijdsspanne, wat de nauwkeurigheid van het resultaat groter maakt, dus correct. Wel bijzonder korte uitleg.

Post a new message


Summary of computational transaction
Raw Inputview raw input (R code)
Raw Outputview raw output of R engine
Computing time3 seconds
R Server'Gwilym Jenkins' @ 72.249.127.135

\begin{tabular}{lllllllll}
\hline
Summary of computational transaction \tabularnewline
Raw Input & view raw input (R code)  \tabularnewline
Raw Output & view raw output of R engine  \tabularnewline
Computing time & 3 seconds \tabularnewline
R Server & 'Gwilym Jenkins' @ 72.249.127.135 \tabularnewline
\hline
\end{tabular}
%Source: https://freestatistics.org/blog/index.php?pk=82832&T=0

[TABLE]
[ROW][C]Summary of computational transaction[/C][/ROW]
[ROW][C]Raw Input[/C][C]view raw input (R code) [/C][/ROW]
[ROW][C]Raw Output[/C][C]view raw output of R engine [/C][/ROW]
[ROW][C]Computing time[/C][C]3 seconds[/C][/ROW]
[ROW][C]R Server[/C][C]'Gwilym Jenkins' @ 72.249.127.135[/C][/ROW]
[/TABLE]
Source: https://freestatistics.org/blog/index.php?pk=82832&T=0

Globally Unique Identifier (entire table): ba.freestatistics.org/blog/index.php?pk=82832&T=0

As an alternative you can also use a QR Code:  

The GUIDs for individual cells are displayed in the table below:

Summary of computational transaction
Raw Inputview raw input (R code)
Raw Outputview raw output of R engine
Computing time3 seconds
R Server'Gwilym Jenkins' @ 72.249.127.135


Exercise 1.13 p. 14 (Introduction to Probability, 2nd ed.)
Number of simulated days1095
Expected number of births in Large Hospital45
Expected number of births in Small Hospital15
Percentage of Male births per day(for which the probability is computed)0.6
#Females births in Large Hospital24681
#Males births in Large Hospital24594
#Female births in Small Hospital8217
#Male births in Small Hospital8208
Probability of more than 60 % of male births in Large Hospital0.0712328767123288
Probability of more than 60 % of male births in Small Hospital0.135159817351598
#Days per Year when more than 60 % of male births occur in Large Hospital26
#Days per Year when more than 60 % of male births occur in Small Hospital49.3333333333333

\begin{tabular}{lllllllll}
\hline
Exercise 1.13 p. 14 (Introduction to Probability, 2nd ed.) \tabularnewline
Number of simulated days & 1095 \tabularnewline
Expected number of births in Large Hospital & 45 \tabularnewline
Expected number of births in Small Hospital & 15 \tabularnewline
Percentage of Male births per day(for which the probability is computed) & 0.6 \tabularnewline
#Females births in Large Hospital & 24681 \tabularnewline
#Males births in Large Hospital & 24594 \tabularnewline
#Female births in Small Hospital & 8217 \tabularnewline
#Male births in Small Hospital & 8208 \tabularnewline
Probability of more than 60 % of male births in Large Hospital & 0.0712328767123288 \tabularnewline
Probability of more than 60 % of male births in Small Hospital & 0.135159817351598 \tabularnewline
#Days per Year when more than 60 % of male births occur in Large Hospital & 26 \tabularnewline
#Days per Year when more than 60 % of male births occur in Small Hospital & 49.3333333333333 \tabularnewline
\hline
\end{tabular}
%Source: https://freestatistics.org/blog/index.php?pk=82832&T=1

[TABLE]
[ROW][C]Exercise 1.13 p. 14 (Introduction to Probability, 2nd ed.)[/C][/ROW]
[ROW][C]Number of simulated days[/C][C]1095[/C][/ROW]
[ROW][C]Expected number of births in Large Hospital[/C][C]45[/C][/ROW]
[ROW][C]Expected number of births in Small Hospital[/C][C]15[/C][/ROW]
[ROW][C]Percentage of Male births per day(for which the probability is computed)[/C][C]0.6[/C][/ROW]
[ROW][C]#Females births in Large Hospital[/C][C]24681[/C][/ROW]
[ROW][C]#Males births in Large Hospital[/C][C]24594[/C][/ROW]
[ROW][C]#Female births in Small Hospital[/C][C]8217[/C][/ROW]
[ROW][C]#Male births in Small Hospital[/C][C]8208[/C][/ROW]
[ROW][C]Probability of more than 60 % of male births in Large Hospital[/C][C]0.0712328767123288[/C][/ROW]
[C]Probability of more than 60 % of male births in Small Hospital[/C][C]0.135159817351598[/C][/ROW]
[ROW][C]#Days per Year when more than 60 % of male births occur in Large Hospital[/C][C]26[/C][/ROW]
[C]#Days per Year when more than 60 % of male births occur in Small Hospital[/C][C]49.3333333333333[/C][/ROW]
[/TABLE]
Source: https://freestatistics.org/blog/index.php?pk=82832&T=1

Globally Unique Identifier (entire table): ba.freestatistics.org/blog/index.php?pk=82832&T=1

As an alternative you can also use a QR Code:  

The GUIDs for individual cells are displayed in the table below:

Exercise 1.13 p. 14 (Introduction to Probability, 2nd ed.)
Number of simulated days1095
Expected number of births in Large Hospital45
Expected number of births in Small Hospital15
Percentage of Male births per day(for which the probability is computed)0.6
#Females births in Large Hospital24681
#Males births in Large Hospital24594
#Female births in Small Hospital8217
#Male births in Small Hospital8208
Probability of more than 60 % of male births in Large Hospital0.0712328767123288
Probability of more than 60 % of male births in Small Hospital0.135159817351598
#Days per Year when more than 60 % of male births occur in Large Hospital26
#Days per Year when more than 60 % of male births occur in Small Hospital49.3333333333333


Parameters (Session):
par1 = 1095 ; par2 = 45 ; par3 = 15 ; par4 = 0.6 ;
Parameters (R input):
par1 = 1095 ; par2 = 45 ; par3 = 15 ; par4 = 0.6 ;
R code (references can be found in the software module):
par1 <- as.numeric(par1)
par2 <- as.numeric(par2)
par3 <- as.numeric(par3)
par4 <- as.numeric(par4)
numsuccessbig <- 0
numsuccesssmall <- 0
bighospital <- array(NA,dim=c(par1,par2))
smallhospital <- array(NA,dim=c(par1,par3))
bigprob <- array(NA,dim=par1)
smallprob <- array(NA,dim=par1)
for (i in 1:par1) {
bighospital[i,] <- sample(c('F','M'),par2,replace=TRUE)
if (as.matrix(table(bighospital[i,]))[2] > par4*par2) numsuccessbig = numsuccessbig + 1
bigprob[i] <- numsuccessbig/i
smallhospital[i,] <- sample(c('F','M'),par3,replace=TRUE)
if (as.matrix(table(smallhospital[i,]))[2] > par4*par3) numsuccesssmall = numsuccesssmall + 1
smallprob[i] <- numsuccesssmall/i
}
tbig <- as.matrix(table(bighospital))
tsmall <- as.matrix(table(smallhospital))
tbig
tsmall
numsuccessbig/par1
bigprob[par1]
numsuccesssmall/par1
smallprob[par1]
numsuccessbig/par1*365
bigprob[par1]*365
numsuccesssmall/par1*365
smallprob[par1]*365
bitmap(file='test1.png')
plot(bigprob,col=2,main='Probability in Large Hospital',xlab='#simulated days',ylab='probability')
dev.off()
bitmap(file='test2.png')
plot(smallprob,col=2,main='Probability in Small Hospital',xlab='#simulated days',ylab='probability')
dev.off()
load(file='createtable')
a<-table.start()
a<-table.row.start(a)
a<-table.element(a,'Exercise 1.13 p. 14 (Introduction to Probability, 2nd ed.)',2,TRUE)
a<-table.row.end(a)
a<-table.row.start(a)
a<-table.element(a,'Number of simulated days',header=TRUE)
a<-table.element(a,par1)
a<-table.row.end(a)
a<-table.row.start(a)
a<-table.element(a,'Expected number of births in Large Hospital',header=TRUE)
a<-table.element(a,par2)
a<-table.row.end(a)
a<-table.row.start(a)
a<-table.element(a,'Expected number of births in Small Hospital',header=TRUE)
a<-table.element(a,par3)
a<-table.row.end(a)
a<-table.row.start(a)
a<-table.element(a,'Percentage of Male births per day
(for which the probability is computed)',header=TRUE)
a<-table.element(a,par4)
a<-table.row.end(a)
a<-table.row.start(a)
a<-table.element(a,'#Females births in Large Hospital',header=TRUE)
a<-table.element(a,tbig[1])
a<-table.row.end(a)
a<-table.row.start(a)
a<-table.element(a,'#Males births in Large Hospital',header=TRUE)
a<-table.element(a,tbig[2])
a<-table.row.end(a)
a<-table.row.start(a)
a<-table.element(a,'#Female births in Small Hospital',header=TRUE)
a<-table.element(a,tsmall[1])
a<-table.row.end(a)
a<-table.row.start(a)
a<-table.element(a,'#Male births in Small Hospital',header=TRUE)
a<-table.element(a,tsmall[2])
a<-table.row.end(a)
a<-table.row.start(a)
dum1 <- paste('Probability of more than', par4*100, sep=' ')
dum <- paste(dum1, '% of male births in Large Hospital', sep=' ')
a<-table.element(a, dum, header=TRUE)
a<-table.element(a, bigprob[par1])
a<-table.row.end(a)
dum <- paste(dum1, '% of male births in Small Hospital', sep=' ')
a<-table.element(a, dum, header=TRUE)
a<-table.element(a, smallprob[par1])
a<-table.row.end(a)
a<-table.row.start(a)
dum1 <- paste('#Days per Year when more than', par4*100, sep=' ')
dum <- paste(dum1, '% of male births occur in Large Hospital', sep=' ')
a<-table.element(a, dum, header=TRUE)
a<-table.element(a, bigprob[par1]*365)
a<-table.row.end(a)
dum <- paste(dum1, '% of male births occur in Small Hospital', sep=' ')
a<-table.element(a, dum, header=TRUE)
a<-table.element(a, smallprob[par1]*365)
a<-table.row.end(a)
a<-table.end(a)
table.save(a,file='mytable.tab')