Free Statistics

of Irreproducible Research!

Author's title

Author*Unverified author*
R Software Modulerwasp_harrell_davis.wasp
Title produced by softwareHarrell-Davis Quantiles
Date of computationMon, 11 Oct 2010 11:45:46 +0000
Cite this page as followsStatistical Computations at FreeStatistics.org, Office for Research Development and Education, URL https://freestatistics.org/blog/index.php?v=date/2010/Oct/11/t1286797477jy17u5b3su8o4c4.htm/, Retrieved Fri, 29 Mar 2024 15:02:46 +0000
Statistical Computations at FreeStatistics.org, Office for Research Development and Education, URL https://freestatistics.org/blog/index.php?pk=82445, Retrieved Fri, 29 Mar 2024 15:02:46 +0000
QR Codes:

Original text written by user:
IsPrivate?No (this computation is public)
User-defined keywordsKDGP1W41
Estimated Impact151
Family? (F = Feedback message, R = changed R code, M = changed R Module, P = changed Parameters, D = changed Data)
-       [Harrell-Davis Quantiles] [] [2010-10-11 11:45:46] [c6158409503ffaeb6d7b5957d384c3e1] [Current]
Feedback Forum

Post a new message


Summary of computational transaction
Raw Inputview raw input (R code)
Raw Outputview raw output of R engine
Computing time1 seconds
R Server'Gwilym Jenkins' @ 72.249.127.135

\begin{tabular}{lllllllll}
\hline
Summary of computational transaction \tabularnewline
Raw Input & view raw input (R code)  \tabularnewline
Raw Output & view raw output of R engine  \tabularnewline
Computing time & 1 seconds \tabularnewline
R Server & 'Gwilym Jenkins' @ 72.249.127.135 \tabularnewline
\hline
\end{tabular}
%Source: https://freestatistics.org/blog/index.php?pk=82445&T=0

[TABLE]
[ROW][C]Summary of computational transaction[/C][/ROW]
[ROW][C]Raw Input[/C][C]view raw input (R code) [/C][/ROW]
[ROW][C]Raw Output[/C][C]view raw output of R engine [/C][/ROW]
[ROW][C]Computing time[/C][C]1 seconds[/C][/ROW]
[ROW][C]R Server[/C][C]'Gwilym Jenkins' @ 72.249.127.135[/C][/ROW]
[/TABLE]
Source: https://freestatistics.org/blog/index.php?pk=82445&T=0

Globally Unique Identifier (entire table): ba.freestatistics.org/blog/index.php?pk=82445&T=0

As an alternative you can also use a QR Code:  

The GUIDs for individual cells are displayed in the table below:

Summary of computational transaction
Raw Inputview raw input (R code)
Raw Outputview raw output of R engine
Computing time1 seconds
R Server'Gwilym Jenkins' @ 72.249.127.135


Harrell-Davis Quantiles
quantilesvaluestandard error
0.1135.8998764228826.17477380052541
0.2166.6752010783879.43480784307638
0.3193.10535086818510.1664093184706
0.4226.54753629155912.4906438806074
0.5261.84770052976216.7643689394466
0.6304.95958076565415.5613840076562
0.7345.12928542210913.660164796795
0.8389.99584480895617.4506220830322
0.9448.99817596462319.2280557726555

\begin{tabular}{lllllllll}
\hline
Harrell-Davis Quantiles \tabularnewline
quantiles & value & standard error \tabularnewline
0.1 & 135.899876422882 & 6.17477380052541 \tabularnewline
0.2 & 166.675201078387 & 9.43480784307638 \tabularnewline
0.3 & 193.105350868185 & 10.1664093184706 \tabularnewline
0.4 & 226.547536291559 & 12.4906438806074 \tabularnewline
0.5 & 261.847700529762 & 16.7643689394466 \tabularnewline
0.6 & 304.959580765654 & 15.5613840076562 \tabularnewline
0.7 & 345.129285422109 & 13.660164796795 \tabularnewline
0.8 & 389.995844808956 & 17.4506220830322 \tabularnewline
0.9 & 448.998175964623 & 19.2280557726555 \tabularnewline
\hline
\end{tabular}
%Source: https://freestatistics.org/blog/index.php?pk=82445&T=1

[TABLE]
[ROW][C]Harrell-Davis Quantiles[/C][/ROW]
[ROW][C]quantiles[/C][C]value[/C][C]standard error[/C][/ROW]
[ROW][C]0.1[/C][C]135.899876422882[/C][C]6.17477380052541[/C][/ROW]
[ROW][C]0.2[/C][C]166.675201078387[/C][C]9.43480784307638[/C][/ROW]
[ROW][C]0.3[/C][C]193.105350868185[/C][C]10.1664093184706[/C][/ROW]
[ROW][C]0.4[/C][C]226.547536291559[/C][C]12.4906438806074[/C][/ROW]
[ROW][C]0.5[/C][C]261.847700529762[/C][C]16.7643689394466[/C][/ROW]
[ROW][C]0.6[/C][C]304.959580765654[/C][C]15.5613840076562[/C][/ROW]
[ROW][C]0.7[/C][C]345.129285422109[/C][C]13.660164796795[/C][/ROW]
[ROW][C]0.8[/C][C]389.995844808956[/C][C]17.4506220830322[/C][/ROW]
[ROW][C]0.9[/C][C]448.998175964623[/C][C]19.2280557726555[/C][/ROW]
[/TABLE]
Source: https://freestatistics.org/blog/index.php?pk=82445&T=1

Globally Unique Identifier (entire table): ba.freestatistics.org/blog/index.php?pk=82445&T=1

As an alternative you can also use a QR Code:  

The GUIDs for individual cells are displayed in the table below:

Harrell-Davis Quantiles
quantilesvaluestandard error
0.1135.8998764228826.17477380052541
0.2166.6752010783879.43480784307638
0.3193.10535086818510.1664093184706
0.4226.54753629155912.4906438806074
0.5261.84770052976216.7643689394466
0.6304.95958076565415.5613840076562
0.7345.12928542210913.660164796795
0.8389.99584480895617.4506220830322
0.9448.99817596462319.2280557726555


Parameters (Session):
par1 = 0.1 ; par2 = 0.9 ; par3 = 0.1 ;
Parameters (R input):
par1 = 0.1 ; par2 = 0.9 ; par3 = 0.1 ;
R code (references can be found in the software module):
par1 <- as(par1,'numeric')
par2 <- as(par2,'numeric')
par3 <- as(par3,'numeric')
library(Hmisc)
myseq <- seq(par1, par2, par3)
hd <- hdquantile(x, probs = myseq, se = TRUE, na.rm = FALSE, names = TRUE, weights=FALSE)
bitmap(file='test1.png')
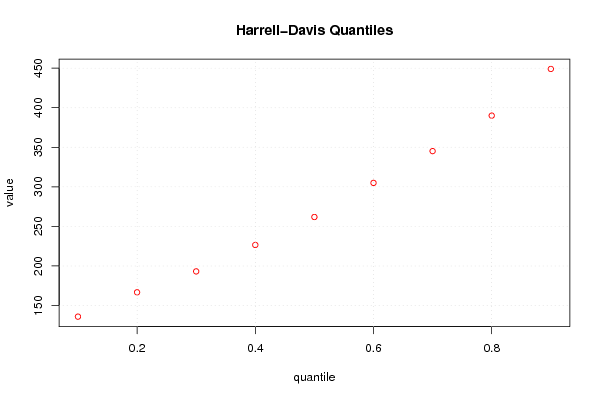
plot(myseq,hd,col=2,main=main,xlab=xlab,ylab=ylab)
grid()
dev.off()
load(file='createtable')
a<-table.start()
a<-table.row.start(a)
a<-table.element(a,'Harrell-Davis Quantiles',3,TRUE)
a<-table.row.end(a)
a<-table.row.start(a)
a<-table.element(a,'quantiles',header=TRUE)
a<-table.element(a,'value',header=TRUE)
a<-table.element(a,'standard error',header=TRUE)
a<-table.row.end(a)
length(hd)
for (i in 1:length(hd))
{
a<-table.row.start(a)
a<-table.element(a,as(labels(hd)[i],'numeric'),header=TRUE)
a<-table.element(a,as.matrix(hd[i])[1,1])
a<-table.element(a,as.matrix(attr(hd,'se')[i])[1,1])
a<-table.row.end(a)
}
a<-table.end(a)
table.save(a,file='mytable.tab')