Free Statistics

of Irreproducible Research!

Author's title

Author*The author of this computation has been verified*
R Software Modulerwasp_babies.wasp
Title produced by softwareExercise 1.13
Date of computationFri, 08 Oct 2010 11:42:02 +0000
Cite this page as followsStatistical Computations at FreeStatistics.org, Office for Research Development and Education, URL https://freestatistics.org/blog/index.php?v=date/2010/Oct/08/t1286538198hkcme0abwlk4j8j.htm/, Retrieved Thu, 02 May 2024 00:27:11 +0000
Statistical Computations at FreeStatistics.org, Office for Research Development and Education, URL https://freestatistics.org/blog/index.php?pk=81968, Retrieved Thu, 02 May 2024 00:27:11 +0000
QR Codes:

Original text written by user:
IsPrivate?No (this computation is public)
User-defined keywords
Estimated Impact125
Family? (F = Feedback message, R = changed R code, M = changed R Module, P = changed Parameters, D = changed Data)
F     [Variability] [Variability of th...] [2010-09-25 09:46:38] [b98453cac15ba1066b407e146608df68]
F RMPD    [Exercise 1.13] [Babies] [2010-10-08 11:42:02] [8e16b01a5be2b3f7f3ad6418d9d6fd5b] [Current]
Feedback Forum
2010-10-15 17:57:16 [Stefanie Van Esbroeck] [reply
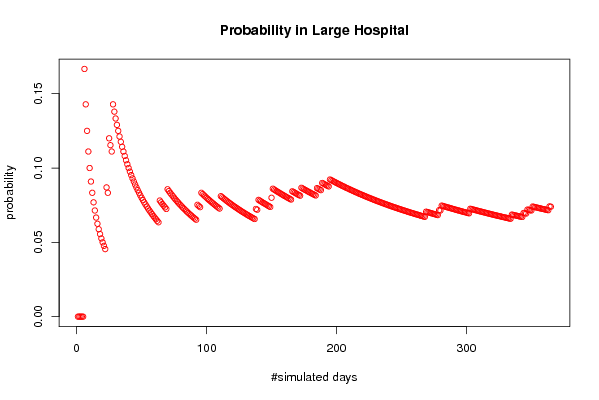
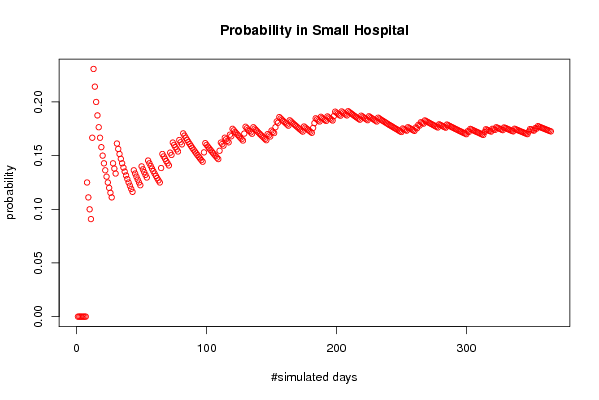
De student heeft een goede interpretatie gegeven maar hij/zij had ook nog het verschil kunnen uitleggen tussen de twee grafieken. Zo kon de student aan zijn conclusie toevoegen dat er in het resultaat van taak 2 nu wel sprake is van convergentie in het grote ziekenhuis. De kans dat er een jongen geboren word, is nog steeds waarschijnlijker in het kleine ziekenhuis. Dit komt omdat het aantal dagen in het kleine ziekenhuis (55 dagen) hoger ligt dan in het grote ziekenhuis (26 dagen). De waarschijnlijkheid dat in het grote ziekenhuis meer dan 60% van de geboortes per dag jongens zijn, is 7%, in het kleine ziekenhuis is dit 15%. Deze resultaten zijn miniem verschillend van taak 1.

Bij de oplossing met de binomiale verdeling heeft de student een foute berekening gemaakt. Ik heb deze fout ook gemaakt in mijn eigen werk. Maar ik weet waar ik verkeerd zat en heb daarom deze vraag opnieuw berekend zoals het hoort. Dit zijn mijn berekeningen:

Groot ziekenhuis:
x= de stochastische variabele (27= 60% van 45)
n= aantal experimenten (45)
p= de waarschijnlijkheid op een geboorte van een jongen (50%)
q= de waarschijnlijkheid op een geboorte van een meisje (50%)
Daarna heb ik de binomiale verdeling in Excel berekend. Deze formule staat standaard ingesteld.De uitkomst van deze formule p(x<=27) = 0.9324
Daarna heb ik de waarschijnlijkheid afgetrokken van 1. Dus 1 – 0.9324 = 0.0676.
De waarschijnlijkheid dat in het groot ziekenhuis meer dan 60% van de geboortes per dag jongens zijn, is 7%.

Klein ziekenhuis
x= de stochastische variabele (9= 60% van 15)
n= aantal experimenten (15)
p= de waarschijnlijkheid op een geboorte van een jongen (50%)
q= de waarschijnlijkheid op een geboorte van een meisje (50%)
We berekenen de binomiale verdeling in Excel. Deze formule staat standaard ingesteld in Excel. De uitkomst van deze formule is p(x<=9) = 0,849121
Dan moeten we vervolgens deze waarschijnlijkheid aftrekken van 1: 1 – 0,849121= 0,150879. De waarschijnlijkheid dat in het klein ziekenhuis meer dan 60% van de geboortes per dag jongens zijn, is 15%. We kunnen dus concluderen dat de we inderdaad hetzelfde resultaat verkrijgen als met de berekening via de computer.Dit brengt wel een nadeel met zich mee dat er afrondingsfouten kunnen voorkomen. Dit is iets wat niet kan voorkomen als je het wiskundig berekend.
2010-10-17 15:58:24 [ac60b0733d04acb78c99358c3a0e1148] [reply
Het is correct geïnterpreteerd om het experiment over een grotere tijdspanne te laten gelden. Op deze manier verkrijg je meer experimenten en zal het resultaat duidelijker worden.
Aan de andere kant is de berekening via de Binomiale verdeling verkeerd. Ikzelf heb het ook zo opgelost als de student.
De fout zit hem onder andere in het bepalen van de p en de q: De waarschijnlijkheid op de geboorte van een jongen is namelijk 50% (en niet 60%), en de waarschijnlijkheid op een geboorte van een meisje is ook 50% (en niet 40%).
Vanuit dit opzicht verkrijg je al een heel andere formule.
De andere gegevens die van nut zijn voor de formule zijn n (het aantal experimenten) en x (de stochastische variabele). Deze laatste 2 variëren naargelang het over het klein of groot ziekenhuis gaat.
2010-10-17 16:41:23 [ac60b0733d04acb78c99358c3a0e1148] [reply
Het is correct geïnterpreteerd om het experiment over een grotere tijdspanne te laten gelden. Op deze manier verkrijg je meer experimenten en zal het resultaat duidelijker worden.
Aan de andere kant is de berekening via de Binomiale verdeling verkeerd. Ikzelf heb het ook zo opgelost als de student.
De fout zit hem onder andere in het bepalen van de p en de q: De waarschijnlijkheid op de geboorte van een jongen is namelijk 50% (en niet 60%), en de waarschijnlijkheid op een geboorte van een meisje is ook 50% (en niet 40%).
Vanuit dit opzicht verkrijg je al een heel andere formule.
De andere gegevens die van nut zijn voor de formule zijn n (het aantal experimenten) en x (de stochastische variabele). Deze laatste 2 variëren naargelang het over het klein of groot ziekenhuis gaat.

Post a new message


Summary of computational transaction
Raw Inputview raw input (R code)
Raw Outputview raw output of R engine
Computing time1 seconds
R Server'Gwilym Jenkins' @ 72.249.127.135

\begin{tabular}{lllllllll}
\hline
Summary of computational transaction \tabularnewline
Raw Input & view raw input (R code)  \tabularnewline
Raw Output & view raw output of R engine  \tabularnewline
Computing time & 1 seconds \tabularnewline
R Server & 'Gwilym Jenkins' @ 72.249.127.135 \tabularnewline
\hline
\end{tabular}
%Source: https://freestatistics.org/blog/index.php?pk=81968&T=0

[TABLE]
[ROW][C]Summary of computational transaction[/C][/ROW]
[ROW][C]Raw Input[/C][C]view raw input (R code) [/C][/ROW]
[ROW][C]Raw Output[/C][C]view raw output of R engine [/C][/ROW]
[ROW][C]Computing time[/C][C]1 seconds[/C][/ROW]
[ROW][C]R Server[/C][C]'Gwilym Jenkins' @ 72.249.127.135[/C][/ROW]
[/TABLE]
Source: https://freestatistics.org/blog/index.php?pk=81968&T=0

Globally Unique Identifier (entire table): ba.freestatistics.org/blog/index.php?pk=81968&T=0

As an alternative you can also use a QR Code:  

The GUIDs for individual cells are displayed in the table below:

Summary of computational transaction
Raw Inputview raw input (R code)
Raw Outputview raw output of R engine
Computing time1 seconds
R Server'Gwilym Jenkins' @ 72.249.127.135


Exercise 1.13 p. 14 (Introduction to Probability, 2nd ed.)
Number of simulated days365
Expected number of births in Large Hospital45
Expected number of births in Small Hospital15
Percentage of Male births per day(for which the probability is computed)0.6
#Females births in Large Hospital8160
#Males births in Large Hospital8265
#Female births in Small Hospital2706
#Male births in Small Hospital2769
Probability of more than 60 % of male births in Large Hospital0.073972602739726
Probability of more than 60 % of male births in Small Hospital0.172602739726027
#Days per Year when more than 60 % of male births occur in Large Hospital27
#Days per Year when more than 60 % of male births occur in Small Hospital63

\begin{tabular}{lllllllll}
\hline
Exercise 1.13 p. 14 (Introduction to Probability, 2nd ed.) \tabularnewline
Number of simulated days & 365 \tabularnewline
Expected number of births in Large Hospital & 45 \tabularnewline
Expected number of births in Small Hospital & 15 \tabularnewline
Percentage of Male births per day(for which the probability is computed) & 0.6 \tabularnewline
#Females births in Large Hospital & 8160 \tabularnewline
#Males births in Large Hospital & 8265 \tabularnewline
#Female births in Small Hospital & 2706 \tabularnewline
#Male births in Small Hospital & 2769 \tabularnewline
Probability of more than 60 % of male births in Large Hospital & 0.073972602739726 \tabularnewline
Probability of more than 60 % of male births in Small Hospital & 0.172602739726027 \tabularnewline
#Days per Year when more than 60 % of male births occur in Large Hospital & 27 \tabularnewline
#Days per Year when more than 60 % of male births occur in Small Hospital & 63 \tabularnewline
\hline
\end{tabular}
%Source: https://freestatistics.org/blog/index.php?pk=81968&T=1

[TABLE]
[ROW][C]Exercise 1.13 p. 14 (Introduction to Probability, 2nd ed.)[/C][/ROW]
[ROW][C]Number of simulated days[/C][C]365[/C][/ROW]
[ROW][C]Expected number of births in Large Hospital[/C][C]45[/C][/ROW]
[ROW][C]Expected number of births in Small Hospital[/C][C]15[/C][/ROW]
[ROW][C]Percentage of Male births per day(for which the probability is computed)[/C][C]0.6[/C][/ROW]
[ROW][C]#Females births in Large Hospital[/C][C]8160[/C][/ROW]
[ROW][C]#Males births in Large Hospital[/C][C]8265[/C][/ROW]
[ROW][C]#Female births in Small Hospital[/C][C]2706[/C][/ROW]
[ROW][C]#Male births in Small Hospital[/C][C]2769[/C][/ROW]
[ROW][C]Probability of more than 60 % of male births in Large Hospital[/C][C]0.073972602739726[/C][/ROW]
[C]Probability of more than 60 % of male births in Small Hospital[/C][C]0.172602739726027[/C][/ROW]
[ROW][C]#Days per Year when more than 60 % of male births occur in Large Hospital[/C][C]27[/C][/ROW]
[C]#Days per Year when more than 60 % of male births occur in Small Hospital[/C][C]63[/C][/ROW]
[/TABLE]
Source: https://freestatistics.org/blog/index.php?pk=81968&T=1

Globally Unique Identifier (entire table): ba.freestatistics.org/blog/index.php?pk=81968&T=1

As an alternative you can also use a QR Code:  

The GUIDs for individual cells are displayed in the table below:

Exercise 1.13 p. 14 (Introduction to Probability, 2nd ed.)
Number of simulated days365
Expected number of births in Large Hospital45
Expected number of births in Small Hospital15
Percentage of Male births per day(for which the probability is computed)0.6
#Females births in Large Hospital8160
#Males births in Large Hospital8265
#Female births in Small Hospital2706
#Male births in Small Hospital2769
Probability of more than 60 % of male births in Large Hospital0.073972602739726
Probability of more than 60 % of male births in Small Hospital0.172602739726027
#Days per Year when more than 60 % of male births occur in Large Hospital27
#Days per Year when more than 60 % of male births occur in Small Hospital63


Parameters (Session):
par1 = 365 ; par2 = 45 ; par3 = 15 ; par4 = 0.6 ;
Parameters (R input):
par1 = 365 ; par2 = 45 ; par3 = 15 ; par4 = 0.6 ;
R code (references can be found in the software module):
par1 <- as.numeric(par1)
par2 <- as.numeric(par2)
par3 <- as.numeric(par3)
par4 <- as.numeric(par4)
numsuccessbig <- 0
numsuccesssmall <- 0
bighospital <- array(NA,dim=c(par1,par2))
smallhospital <- array(NA,dim=c(par1,par3))
bigprob <- array(NA,dim=par1)
smallprob <- array(NA,dim=par1)
for (i in 1:par1) {
bighospital[i,] <- sample(c('F','M'),par2,replace=TRUE)
if (as.matrix(table(bighospital[i,]))[2] > par4*par2) numsuccessbig = numsuccessbig + 1
bigprob[i] <- numsuccessbig/i
smallhospital[i,] <- sample(c('F','M'),par3,replace=TRUE)
if (as.matrix(table(smallhospital[i,]))[2] > par4*par3) numsuccesssmall = numsuccesssmall + 1
smallprob[i] <- numsuccesssmall/i
}
tbig <- as.matrix(table(bighospital))
tsmall <- as.matrix(table(smallhospital))
tbig
tsmall
numsuccessbig/par1
bigprob[par1]
numsuccesssmall/par1
smallprob[par1]
numsuccessbig/par1*365
bigprob[par1]*365
numsuccesssmall/par1*365
smallprob[par1]*365
bitmap(file='test1.png')
plot(bigprob,col=2,main='Probability in Large Hospital',xlab='#simulated days',ylab='probability')
dev.off()
bitmap(file='test2.png')
plot(smallprob,col=2,main='Probability in Small Hospital',xlab='#simulated days',ylab='probability')
dev.off()
load(file='createtable')
a<-table.start()
a<-table.row.start(a)
a<-table.element(a,'Exercise 1.13 p. 14 (Introduction to Probability, 2nd ed.)',2,TRUE)
a<-table.row.end(a)
a<-table.row.start(a)
a<-table.element(a,'Number of simulated days',header=TRUE)
a<-table.element(a,par1)
a<-table.row.end(a)
a<-table.row.start(a)
a<-table.element(a,'Expected number of births in Large Hospital',header=TRUE)
a<-table.element(a,par2)
a<-table.row.end(a)
a<-table.row.start(a)
a<-table.element(a,'Expected number of births in Small Hospital',header=TRUE)
a<-table.element(a,par3)
a<-table.row.end(a)
a<-table.row.start(a)
a<-table.element(a,'Percentage of Male births per day
(for which the probability is computed)',header=TRUE)
a<-table.element(a,par4)
a<-table.row.end(a)
a<-table.row.start(a)
a<-table.element(a,'#Females births in Large Hospital',header=TRUE)
a<-table.element(a,tbig[1])
a<-table.row.end(a)
a<-table.row.start(a)
a<-table.element(a,'#Males births in Large Hospital',header=TRUE)
a<-table.element(a,tbig[2])
a<-table.row.end(a)
a<-table.row.start(a)
a<-table.element(a,'#Female births in Small Hospital',header=TRUE)
a<-table.element(a,tsmall[1])
a<-table.row.end(a)
a<-table.row.start(a)
a<-table.element(a,'#Male births in Small Hospital',header=TRUE)
a<-table.element(a,tsmall[2])
a<-table.row.end(a)
a<-table.row.start(a)
dum1 <- paste('Probability of more than', par4*100, sep=' ')
dum <- paste(dum1, '% of male births in Large Hospital', sep=' ')
a<-table.element(a, dum, header=TRUE)
a<-table.element(a, bigprob[par1])
a<-table.row.end(a)
dum <- paste(dum1, '% of male births in Small Hospital', sep=' ')
a<-table.element(a, dum, header=TRUE)
a<-table.element(a, smallprob[par1])
a<-table.row.end(a)
a<-table.row.start(a)
dum1 <- paste('#Days per Year when more than', par4*100, sep=' ')
dum <- paste(dum1, '% of male births occur in Large Hospital', sep=' ')
a<-table.element(a, dum, header=TRUE)
a<-table.element(a, bigprob[par1]*365)
a<-table.row.end(a)
dum <- paste(dum1, '% of male births occur in Small Hospital', sep=' ')
a<-table.element(a, dum, header=TRUE)
a<-table.element(a, smallprob[par1]*365)
a<-table.row.end(a)
a<-table.end(a)
table.save(a,file='mytable.tab')