Free Statistics

of Irreproducible Research!

Author's title

Author*The author of this computation has been verified*
R Software Modulerwasp_notchedbox1.wasp
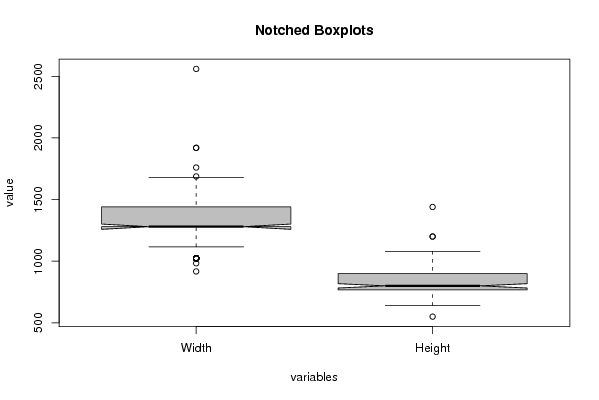
Title produced by softwareNotched Boxplots
Date of computationMon, 04 Oct 2010 19:36:32 +0000
Cite this page as followsStatistical Computations at FreeStatistics.org, Office for Research Development and Education, URL https://freestatistics.org/blog/index.php?v=date/2010/Oct/04/t1286221003o9wtn8vc8lowlaa.htm/, Retrieved Sun, 28 Apr 2024 06:59:23 +0000
Statistical Computations at FreeStatistics.org, Office for Research Development and Education, URL https://freestatistics.org/blog/index.php?pk=81078, Retrieved Sun, 28 Apr 2024 06:59:23 +0000
QR Codes:

Original text written by user:
IsPrivate?No (this computation is public)
User-defined keywords
Estimated Impact119
Family? (F = Feedback message, R = changed R code, M = changed R Module, P = changed Parameters, D = changed Data)
-     [Notched Boxplots] [Screen Width and ...] [2010-09-25 10:03:47] [b98453cac15ba1066b407e146608df68]
F   PD    [Notched Boxplots] [Boxplots Width & ...] [2010-10-04 19:36:32] [61e5ee05de011f44efa37f086a4e2271] [Current]
Feedback Forum
2010-10-09 14:25:57 [01b8b2bcf185aaeb880175e70c026485] [reply
bij deze taak moesten de extreme waarden verwijderd worden. Dit kan op twee manieren gebeuren.Ofwel gaat men de exteme waarden manueel verwijderen uit het databestand door hier alle waarden die groter zijn dan het 75e percentiel en kleiner zijn dan het 25e percentiel te verwijderen. Deze data plakt men dan in het datavak. Ofwel verwijdert men de extreme waarden door de broncode aan te passen en bovenaan het volgende toe te voegen: z <- z[z[,1]*z[,2]>800000 & z[,1]*z[,2]<1700000,]
Wanneer men één van deze twee manieren toepast, bekomt men een boxplot waar alle extreme waarden uit verwijderd zijn.
2010-10-10 09:38:33 [48eb36e2c01435ad7e4ea7854a9d98fe] [reply
Ik ben het inderdaad eens met wat de student hierboven reeds heeft beschreven als tips om de uitschieters te kunnen verwijderen.

Daarnaast vond ik ook de conclusie die door de studente waren getrokken uit de observatie van de notched boxplots niet helemaal duidelijk. Het is namelijk zo dat het 25ste percentiel (m.a.w. de onderste grens van de 'rechthoek') betekent dat 25 van de waarnemingen lager liggen dat deze waarde.
De lijn in de 'box' is het 50ste percentiel en stemt overeen met de mediaan; 50% van de waarnemingen zijn dus kleiner dan deze waarde.
Ten slotte stelt de bovenste grens van de 'rechthoek' het 75ste percentiel voor; 25% van de waarnemingen zijn groter dan deze waarde en 75% van de waarnemingen zijn kleiner dan deze waarde.

Post a new message
Dataseries X:
917	550
983	737
1024	768
1024	768
1024	768
1024	768
1024	768
1024	768
1024	768
1024	768
1024	768
1024	768
1024	768
1024	768
1024	768
1024	640
1024	768
1024	768
1024	768
1024	768
1024	768
1024	768
1024	768
1117	698
1120	700
1140	641
1143	857
1152	864
1152	864
1176	735
1176	735
1257	785
1280	800
1280	800
1280	768
1280	800
1280	768
1280	800
1280	800
1280	800
1280	1024
1280	1024
1280	800
1280	800
1280	800
1280	800
1280	800
1280	768
1280	800
1280	800
1280	800
1280	1024
1280	1024
1280	800
1280	768
1280	800
1280	800
1280	800
1280	800
1280	1024
1280	800
1280	800
1280	800
1280	800
1280	1024
1280	800
1280	800
1280	800
1280	800
1280	800
1280	800
1280	800
1280	800
1280	800
1280	800
1280	800
1280	800
1280	800
1280	800
1280	800
1280	1024
1280	800
1280	1024
1280	800
1280	800
1280	800
1280	800
1280	800
1280	1024
1280	1024
1280	800
1280	800
1280	800
1366	768
1366	768
1366	768
1366	768
1366	768
1366	768
1366	768
1366	768
1408	880
1408	880
1440	900
1440	900
1440	900
1440	900
1440	900
1440	900
1440	900
1440	900
1440	900
1440	900
1440	900
1440	900
1440	900
1440	900
1440	900
1440	900
1440	900
1440	900
1440	900
1440	900
1440	900
1503	845
1600	900
1600	1200
1600	900
1600	900
1600	900
1680	1050
1680	1050
1680	1050
1680	1050
1688	949
1760	990
1920	1080
1920	1200
2560	1440


Summary of computational transaction
Raw Inputview raw input (R code)
Raw Outputview raw output of R engine
Computing time1 seconds
R Server'Gwilym Jenkins' @ 72.249.127.135

\begin{tabular}{lllllllll}
\hline
Summary of computational transaction \tabularnewline
Raw Input & view raw input (R code)  \tabularnewline
Raw Output & view raw output of R engine  \tabularnewline
Computing time & 1 seconds \tabularnewline
R Server & 'Gwilym Jenkins' @ 72.249.127.135 \tabularnewline
\hline
\end{tabular}
%Source: https://freestatistics.org/blog/index.php?pk=81078&T=0

[TABLE]
[ROW][C]Summary of computational transaction[/C][/ROW]
[ROW][C]Raw Input[/C][C]view raw input (R code) [/C][/ROW]
[ROW][C]Raw Output[/C][C]view raw output of R engine [/C][/ROW]
[ROW][C]Computing time[/C][C]1 seconds[/C][/ROW]
[ROW][C]R Server[/C][C]'Gwilym Jenkins' @ 72.249.127.135[/C][/ROW]
[/TABLE]
Source: https://freestatistics.org/blog/index.php?pk=81078&T=0

Globally Unique Identifier (entire table): ba.freestatistics.org/blog/index.php?pk=81078&T=0

As an alternative you can also use a QR Code:  

The GUIDs for individual cells are displayed in the table below:

Summary of computational transaction
Raw Inputview raw input (R code)
Raw Outputview raw output of R engine
Computing time1 seconds
R Server'Gwilym Jenkins' @ 72.249.127.135


Boxplot statistics
Variablelower whiskerlower hingemedianupper hingeupper whisker
Width11171280128014401680
Height6407688009001080

\begin{tabular}{lllllllll}
\hline
Boxplot statistics \tabularnewline
Variable & lower whisker & lower hinge & median & upper hinge & upper whisker \tabularnewline
Width & 1117 & 1280 & 1280 & 1440 & 1680 \tabularnewline
Height & 640 & 768 & 800 & 900 & 1080 \tabularnewline
\hline
\end{tabular}
%Source: https://freestatistics.org/blog/index.php?pk=81078&T=1

[TABLE]
[ROW][C]Boxplot statistics[/C][/ROW]
[ROW][C]Variable[/C][C]lower whisker[/C][C]lower hinge[/C][C]median[/C][C]upper hinge[/C][C]upper whisker[/C][/ROW]
[ROW][C]Width[/C][C]1117[/C][C]1280[/C][C]1280[/C][C]1440[/C][C]1680[/C][/ROW]
[ROW][C]Height[/C][C]640[/C][C]768[/C][C]800[/C][C]900[/C][C]1080[/C][/ROW]
[/TABLE]
Source: https://freestatistics.org/blog/index.php?pk=81078&T=1

Globally Unique Identifier (entire table): ba.freestatistics.org/blog/index.php?pk=81078&T=1

As an alternative you can also use a QR Code:  

The GUIDs for individual cells are displayed in the table below:

Boxplot statistics
Variablelower whiskerlower hingemedianupper hingeupper whisker
Width11171280128014401680
Height6407688009001080


Boxplot Notches
Variablelower boundmedianupper bound
Width1258.5577838576912801301.44221614231
Height782.310171682595800817.689828317405

\begin{tabular}{lllllllll}
\hline
Boxplot Notches \tabularnewline
Variable & lower bound & median & upper bound \tabularnewline
Width & 1258.55778385769 & 1280 & 1301.44221614231 \tabularnewline
Height & 782.310171682595 & 800 & 817.689828317405 \tabularnewline
\hline
\end{tabular}
%Source: https://freestatistics.org/blog/index.php?pk=81078&T=2

[TABLE]
[ROW][C]Boxplot Notches[/C][/ROW]
[ROW][C]Variable[/C][C]lower bound[/C][C]median[/C][C]upper bound[/C][/ROW]
[ROW][C]Width[/C][C]1258.55778385769[/C][C]1280[/C][C]1301.44221614231[/C][/ROW]
[ROW][C]Height[/C][C]782.310171682595[/C][C]800[/C][C]817.689828317405[/C][/ROW]
[/TABLE]
Source: https://freestatistics.org/blog/index.php?pk=81078&T=2

Globally Unique Identifier (entire table): ba.freestatistics.org/blog/index.php?pk=81078&T=2

As an alternative you can also use a QR Code:  

The GUIDs for individual cells are displayed in the table below:

Boxplot Notches
Variablelower boundmedianupper bound
Width1258.5577838576912801301.44221614231
Height782.310171682595800817.689828317405


Parameters (Session):
par1 = 50 ; par2 = grey ; par3 = FALSE ; par4 = Unknown ;
Parameters (R input):
par1 = grey ;
R code (references can be found in the software module):
z <- as.data.frame(t(y))
bitmap(file='test1.png')
(r<-boxplot(z ,xlab=xlab,ylab=ylab,main=main,notch=TRUE,col=par1))
dev.off()
load(file='createtable')
a<-table.start()
a<-table.row.start(a)
a<-table.element(a,hyperlink('overview.htm','Boxplot statistics','Boxplot overview'),6,TRUE)
a<-table.row.end(a)
a<-table.row.start(a)
a<-table.element(a,'Variable',1,TRUE)
a<-table.element(a,hyperlink('lower_whisker.htm','lower whisker','definition of lower whisker'),1,TRUE)
a<-table.element(a,hyperlink('lower_hinge.htm','lower hinge','definition of lower hinge'),1,TRUE)
a<-table.element(a,hyperlink('central_tendency.htm','median','definitions about measures of central tendency'),1,TRUE)
a<-table.element(a,hyperlink('upper_hinge.htm','upper hinge','definition of upper hinge'),1,TRUE)
a<-table.element(a,hyperlink('upper_whisker.htm','upper whisker','definition of upper whisker'),1,TRUE)
a<-table.row.end(a)
for (i in 1:length(y[,1]))
{
a<-table.row.start(a)
a<-table.element(a,dimnames(t(x))[[2]][i],1,TRUE)
for (j in 1:5)
{
a<-table.element(a,r$stats[j,i])
}
a<-table.row.end(a)
}
a<-table.end(a)
table.save(a,file='mytable.tab')
a<-table.start()
a<-table.row.start(a)
a<-table.element(a,'Boxplot Notches',4,TRUE)
a<-table.row.end(a)
a<-table.row.start(a)
a<-table.element(a,'Variable',1,TRUE)
a<-table.element(a,'lower bound',1,TRUE)
a<-table.element(a,'median',1,TRUE)
a<-table.element(a,'upper bound',1,TRUE)
a<-table.row.end(a)
for (i in 1:length(y[,1]))
{
a<-table.row.start(a)
a<-table.element(a,dimnames(t(x))[[2]][i],1,TRUE)
a<-table.element(a,r$conf[1,i])
a<-table.element(a,r$stats[3,i])
a<-table.element(a,r$conf[2,i])
a<-table.row.end(a)
}
a<-table.end(a)
table.save(a,file='mytable1.tab')