Free Statistics

of Irreproducible Research!

Author's title

Author*The author of this computation has been verified*
R Software Modulerwasp_notchedbox1.wasp
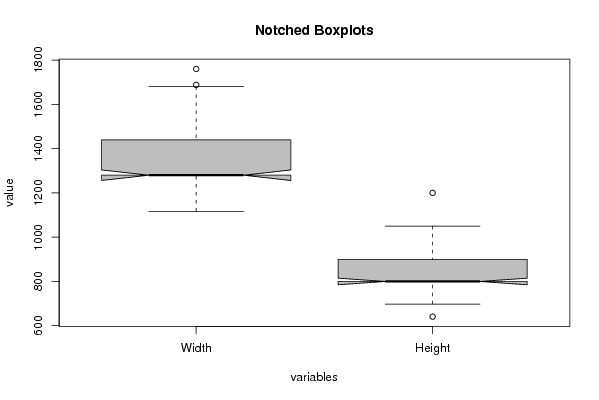
Title produced by softwareNotched Boxplots
Date of computationMon, 04 Oct 2010 19:36:23 +0000
Cite this page as followsStatistical Computations at FreeStatistics.org, Office for Research Development and Education, URL https://freestatistics.org/blog/index.php?v=date/2010/Oct/04/t1286220944amkky01qi2fafy1.htm/, Retrieved Sun, 28 Apr 2024 16:28:25 +0000
Statistical Computations at FreeStatistics.org, Office for Research Development and Education, URL https://freestatistics.org/blog/index.php?pk=81077, Retrieved Sun, 28 Apr 2024 16:28:25 +0000
QR Codes:

Original text written by user:Interpretation: An outlier can cause problems if you’re trying to draw conclusions from your data. By removing the outliers, your results will be more exact and accurate. Another conclusion is that the mean will represent the data more accurate .
IsPrivate?No (this computation is public)
User-defined keywords
Estimated Impact134
Family? (F = Feedback message, R = changed R code, M = changed R Module, P = changed Parameters, D = changed Data)
-     [Notched Boxplots] [Screen Width and ...] [2010-09-25 10:03:47] [b98453cac15ba1066b407e146608df68]
-    D  [Notched Boxplots] [TASK 7 : NOTCHED ...] [2010-10-04 00:17:09] [e5530f2c7259a109047d868b22ce3896]
F    D      [Notched Boxplots] [TASK 7 : NOTCHED ...] [2010-10-04 19:36:23] [05a3d060fb1d372fa2d84e37f098db3c] [Current]
Feedback Forum
2010-10-09 11:09:53 [48eb36e2c01435ad7e4ea7854a9d98fe] [reply
De student heeft hier inderdaad nieuwe notched boxplots gecreëerd waarbij de outliers werden weggelaten, maar het is niet geheel duidelijk waarop men zich heeft gebaseerd om dit te doen.

Wel is het zo dat de student het interval iets te klein heeft genomen en daardoor te veel waarden heeft geëlimineerd. Een goed interval voor het aantal pixels (hoogte * breedte)van de gebruikte computerschermen is ]800000,1700000[. De gegevens kan men aanpassen door de broncode (R- code)te wijzigen naar z <- z[z[,1]*z[,2]>800000 & z[,1]*z[,2]<1700000,].

Wat betreft de interpretatie is het zo dat de notched boxplot net één van de grafische voorstellingen is die het minst rekening houdt met de aanwezigheid van eventuele outliers.
De conclusie ivm het gemiddelde klopt enkel indien er geen extreme uitschieters zijn of indien deze werden verwijderd.

Post a new message
Dataseries X:
1280	1024
1120	700
1280	800
1280	1024
1280	800
1280	800
1280	1024
1280	800
1280	800
1280	1024
1688	949
1440	900
1600	1200
1280	800
1280	800
1280	768
1176	735
1280	800
1503	845
1440	900
1366	768
1280	768
1280	800
1280	768
1280	1024
1280	800
1440	900
1280	800
1440	900
1440	900
1143	857
1280	800
1440	900
1280	800
1366	768
1408	880
1366	768
1176	735
1257	785
1280	800
1280	800
1440	900
1680	1050
1440	900
1140	641
1280	1024
1280	800
1280	800
1280	800
1280	800
1440	900
1280	800
1152	864
1280	1024
1280	800
1440	900
1280	800
1280	1024
1440	900
1280	800
1280	800
1440	900
1280	800
1280	1024
1600	900
1366	768
1280	800
1280	800
1440	900
1366	768
1280	800
1280	800
1440	900
1280	800
1280	800
1408	880
1280	800
1600	900
1600	900
1680	1050
1440	900
1440	900
1280	800
1760	990
1280	800
1280	800
1280	800
1366	768
1440	900
1280	800
1280	1024
1600	900
1117	698
1440	900
1280	800
1440	900
1280	800
1280	800
1280	800
1440	900
1280	800
1152	864
1280	768
1366	768
1680	1050
1680	1050
1280	800
1366	768
1440	900
1280	800
1280	800
1280	800
1280	800


Summary of computational transaction
Raw Inputview raw input (R code)
Raw Outputview raw output of R engine
Computing time1 seconds
R Server'George Udny Yule' @ 72.249.76.132

\begin{tabular}{lllllllll}
\hline
Summary of computational transaction \tabularnewline
Raw Input & view raw input (R code)  \tabularnewline
Raw Output & view raw output of R engine  \tabularnewline
Computing time & 1 seconds \tabularnewline
R Server & 'George Udny Yule' @ 72.249.76.132 \tabularnewline
\hline
\end{tabular}
%Source: https://freestatistics.org/blog/index.php?pk=81077&T=0

[TABLE]
[ROW][C]Summary of computational transaction[/C][/ROW]
[ROW][C]Raw Input[/C][C]view raw input (R code) [/C][/ROW]
[ROW][C]Raw Output[/C][C]view raw output of R engine [/C][/ROW]
[ROW][C]Computing time[/C][C]1 seconds[/C][/ROW]
[ROW][C]R Server[/C][C]'George Udny Yule' @ 72.249.76.132[/C][/ROW]
[/TABLE]
Source: https://freestatistics.org/blog/index.php?pk=81077&T=0

Globally Unique Identifier (entire table): ba.freestatistics.org/blog/index.php?pk=81077&T=0

As an alternative you can also use a QR Code:  

The GUIDs for individual cells are displayed in the table below:

Summary of computational transaction
Raw Inputview raw input (R code)
Raw Outputview raw output of R engine
Computing time1 seconds
R Server'George Udny Yule' @ 72.249.76.132


Boxplot statistics
Variablelower whiskerlower hingemedianupper hingeupper whisker
Width11171280128014401680
Height6988008009001050

\begin{tabular}{lllllllll}
\hline
Boxplot statistics \tabularnewline
Variable & lower whisker & lower hinge & median & upper hinge & upper whisker \tabularnewline
Width & 1117 & 1280 & 1280 & 1440 & 1680 \tabularnewline
Height & 698 & 800 & 800 & 900 & 1050 \tabularnewline
\hline
\end{tabular}
%Source: https://freestatistics.org/blog/index.php?pk=81077&T=1

[TABLE]
[ROW][C]Boxplot statistics[/C][/ROW]
[ROW][C]Variable[/C][C]lower whisker[/C][C]lower hinge[/C][C]median[/C][C]upper hinge[/C][C]upper whisker[/C][/ROW]
[ROW][C]Width[/C][C]1117[/C][C]1280[/C][C]1280[/C][C]1440[/C][C]1680[/C][/ROW]
[ROW][C]Height[/C][C]698[/C][C]800[/C][C]800[/C][C]900[/C][C]1050[/C][/ROW]
[/TABLE]
Source: https://freestatistics.org/blog/index.php?pk=81077&T=1

Globally Unique Identifier (entire table): ba.freestatistics.org/blog/index.php?pk=81077&T=1

As an alternative you can also use a QR Code:  

The GUIDs for individual cells are displayed in the table below:

Boxplot statistics
Variablelower whiskerlower hingemedianupper hingeupper whisker
Width11171280128014401680
Height6988008009001050


Boxplot Notches
Variablelower boundmedianupper bound
Width1256.2185764472612801303.78142355274
Height785.13661027954800814.86338972046

\begin{tabular}{lllllllll}
\hline
Boxplot Notches \tabularnewline
Variable & lower bound & median & upper bound \tabularnewline
Width & 1256.21857644726 & 1280 & 1303.78142355274 \tabularnewline
Height & 785.13661027954 & 800 & 814.86338972046 \tabularnewline
\hline
\end{tabular}
%Source: https://freestatistics.org/blog/index.php?pk=81077&T=2

[TABLE]
[ROW][C]Boxplot Notches[/C][/ROW]
[ROW][C]Variable[/C][C]lower bound[/C][C]median[/C][C]upper bound[/C][/ROW]
[ROW][C]Width[/C][C]1256.21857644726[/C][C]1280[/C][C]1303.78142355274[/C][/ROW]
[ROW][C]Height[/C][C]785.13661027954[/C][C]800[/C][C]814.86338972046[/C][/ROW]
[/TABLE]
Source: https://freestatistics.org/blog/index.php?pk=81077&T=2

Globally Unique Identifier (entire table): ba.freestatistics.org/blog/index.php?pk=81077&T=2

As an alternative you can also use a QR Code:  

The GUIDs for individual cells are displayed in the table below:

Boxplot Notches
Variablelower boundmedianupper bound
Width1256.2185764472612801303.78142355274
Height785.13661027954800814.86338972046


Parameters (Session):
par1 = grey ;
Parameters (R input):
par1 = grey ;
R code (references can be found in the software module):
z <- as.data.frame(t(y))
bitmap(file='test1.png')
(r<-boxplot(z ,xlab=xlab,ylab=ylab,main=main,notch=TRUE,col=par1))
dev.off()
load(file='createtable')
a<-table.start()
a<-table.row.start(a)
a<-table.element(a,hyperlink('overview.htm','Boxplot statistics','Boxplot overview'),6,TRUE)
a<-table.row.end(a)
a<-table.row.start(a)
a<-table.element(a,'Variable',1,TRUE)
a<-table.element(a,hyperlink('lower_whisker.htm','lower whisker','definition of lower whisker'),1,TRUE)
a<-table.element(a,hyperlink('lower_hinge.htm','lower hinge','definition of lower hinge'),1,TRUE)
a<-table.element(a,hyperlink('central_tendency.htm','median','definitions about measures of central tendency'),1,TRUE)
a<-table.element(a,hyperlink('upper_hinge.htm','upper hinge','definition of upper hinge'),1,TRUE)
a<-table.element(a,hyperlink('upper_whisker.htm','upper whisker','definition of upper whisker'),1,TRUE)
a<-table.row.end(a)
for (i in 1:length(y[,1]))
{
a<-table.row.start(a)
a<-table.element(a,dimnames(t(x))[[2]][i],1,TRUE)
for (j in 1:5)
{
a<-table.element(a,r$stats[j,i])
}
a<-table.row.end(a)
}
a<-table.end(a)
table.save(a,file='mytable.tab')
a<-table.start()
a<-table.row.start(a)
a<-table.element(a,'Boxplot Notches',4,TRUE)
a<-table.row.end(a)
a<-table.row.start(a)
a<-table.element(a,'Variable',1,TRUE)
a<-table.element(a,'lower bound',1,TRUE)
a<-table.element(a,'median',1,TRUE)
a<-table.element(a,'upper bound',1,TRUE)
a<-table.row.end(a)
for (i in 1:length(y[,1]))
{
a<-table.row.start(a)
a<-table.element(a,dimnames(t(x))[[2]][i],1,TRUE)
a<-table.element(a,r$conf[1,i])
a<-table.element(a,r$stats[3,i])
a<-table.element(a,r$conf[2,i])
a<-table.row.end(a)
}
a<-table.end(a)
table.save(a,file='mytable1.tab')