Free Statistics

of Irreproducible Research!

Author's title

Author*The author of this computation has been verified*
R Software Modulerwasp_correlation.wasp
Title produced by softwarePearson Correlation
Date of computationMon, 04 Oct 2010 18:32:37 +0000
Cite this page as followsStatistical Computations at FreeStatistics.org, Office for Research Development and Education, URL https://freestatistics.org/blog/index.php?v=date/2010/Oct/04/t1286217101obwgflwpglylpw6.htm/, Retrieved Sun, 28 Apr 2024 02:05:52 +0000
Statistical Computations at FreeStatistics.org, Office for Research Development and Education, URL https://freestatistics.org/blog/index.php?pk=80911, Retrieved Sun, 28 Apr 2024 02:05:52 +0000
QR Codes:

Original text written by user:
IsPrivate?No (this computation is public)
User-defined keywords
Estimated Impact127
Family? (F = Feedback message, R = changed R code, M = changed R Module, P = changed Parameters, D = changed Data)
F     [Pearson Correlation] [Screen dimensions] [2010-09-25 10:10:17] [b98453cac15ba1066b407e146608df68]
F    D    [Pearson Correlation] [] [2010-10-04 18:32:37] [0605ea080d54454c99180f574351b8e4] [Current]
Feedback Forum
2010-10-10 08:58:26 [1951de723fd2749e12bc2f1a75bd3e74] [reply
Bij deze opdracht moet niets herberekend worden.
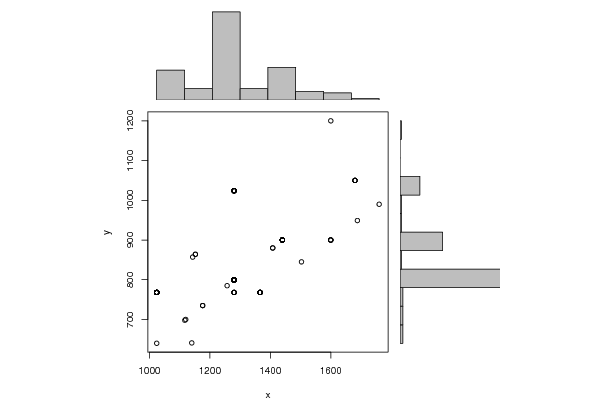
Je ziet 2 histogrammen naast de y- en x-as. Er zijn nogal wat schermen met exact of ongeveer dezelfde aantal pixels, dat zie je in het histogram aan de piek. Bij de bolletjes zie het je het moeilijker omdat de punten op elkaar liggen.

Je kan 3 lijnen/stralen zien, die een beetje divergeren, dat zijn de verhoudingen van schermen.
2010-10-12 13:59:23 [ac60b0733d04acb78c99358c3a0e1148] [reply
Er zijn inderdaad 3 lijnen te onderscheiden in de puntenwolk, in plaats van 1 rechte.

Post a new message
Dataseries X:
1024
1024
1024
1024
1024
1024
1024
1024
1024
1024
1024
1024
1024
1024
1024
1024
1024
1024
1024
1024
1024
1117
1120
1140
1143
1152
1152
1176
1176
1257
1280
1280
1280
1280
1280
1280
1280
1280
1280
1280
1280
1280
1280
1280
1280
1280
1280
1280
1280
1280
1280
1280
1280
1280
1280
1280
1280
1280
1280
1280
1280
1280
1280
1280
1280
1280
1280
1280
1280
1280
1280
1280
1280
1280
1280
1280
1280
1280
1280
1280
1280
1280
1280
1280
1280
1280
1280
1280
1280
1280
1280
1366
1366
1366
1366
1366
1366
1366
1366
1408
1408
1440
1440
1440
1440
1440
1440
1440
1440
1440
1440
1440
1440
1440
1440
1440
1440
1440
1440
1440
1440
1440
1503
1600
1600
1600
1600
1600
1680
1680
1680
1680
1688
1760
Dataseries Y:
768
768
768
768
768
768
768
768
768
768
768
768
768
768
640
768
768
768
768
768
768
698
700
641
857
864
864
735
735
785
1024
800
1024
800
800
1024
800
800
1024
800
800
768
800
768
800
768
1024
800
800
800
800
800
800
1024
800
800
800
800
800
1024
800
800
1024
800
800
800
1024
800
800
800
800
800
800
800
800
800
800
800
800
1024
800
800
800
800
800
768
800
800
800
800
800
768
768
768
768
768
768
768
768
880
880
900
900
900
900
900
900
900
900
900
900
900
900
900
900
900
900
900
900
900
900
900
845
1200
900
900
900
900
1050
1050
1050
1050
949
990


Summary of computational transaction
Raw Inputview raw input (R code)
Raw Outputview raw output of R engine
Computing time0 seconds
R Server'George Udny Yule' @ 72.249.76.132

\begin{tabular}{lllllllll}
\hline
Summary of computational transaction \tabularnewline
Raw Input & view raw input (R code)  \tabularnewline
Raw Output & view raw output of R engine  \tabularnewline
Computing time & 0 seconds \tabularnewline
R Server & 'George Udny Yule' @ 72.249.76.132 \tabularnewline
\hline
\end{tabular}
%Source: https://freestatistics.org/blog/index.php?pk=80911&T=0

[TABLE]
[ROW][C]Summary of computational transaction[/C][/ROW]
[ROW][C]Raw Input[/C][C]view raw input (R code) [/C][/ROW]
[ROW][C]Raw Output[/C][C]view raw output of R engine [/C][/ROW]
[ROW][C]Computing time[/C][C]0 seconds[/C][/ROW]
[ROW][C]R Server[/C][C]'George Udny Yule' @ 72.249.76.132[/C][/ROW]
[/TABLE]
Source: https://freestatistics.org/blog/index.php?pk=80911&T=0

Globally Unique Identifier (entire table): ba.freestatistics.org/blog/index.php?pk=80911&T=0

As an alternative you can also use a QR Code:  

The GUIDs for individual cells are displayed in the table below:

Summary of computational transaction
Raw Inputview raw input (R code)
Raw Outputview raw output of R engine
Computing time0 seconds
R Server'George Udny Yule' @ 72.249.76.132


Pearson Product Moment Correlation - Ungrouped Data
StatisticVariable XVariable Y
Mean1296.05970149254838.649253731343
Biased Variance27726.05613722438648.43667854756
Biased Standard Deviation166.51142944922592.9969713407246
Covariance9914.85568398608
Correlation0.635507068928499
Determination0.403869234658092
T-Test9.45663405693548
p-value (2 sided)0
p-value (1 sided)0
Degrees of Freedom132
Number of Observations134

\begin{tabular}{lllllllll}
\hline
Pearson Product Moment Correlation - Ungrouped Data \tabularnewline
Statistic & Variable X & Variable Y \tabularnewline
Mean & 1296.05970149254 & 838.649253731343 \tabularnewline
Biased Variance & 27726.0561372243 & 8648.43667854756 \tabularnewline
Biased Standard Deviation & 166.511429449225 & 92.9969713407246 \tabularnewline
Covariance & 9914.85568398608 \tabularnewline
Correlation & 0.635507068928499 \tabularnewline
Determination & 0.403869234658092 \tabularnewline
T-Test & 9.45663405693548 \tabularnewline
p-value (2 sided) & 0 \tabularnewline
p-value (1 sided) & 0 \tabularnewline
Degrees of Freedom & 132 \tabularnewline
Number of Observations & 134 \tabularnewline
\hline
\end{tabular}
%Source: https://freestatistics.org/blog/index.php?pk=80911&T=1

[TABLE]
[ROW][C]Pearson Product Moment Correlation - Ungrouped Data[/C][/ROW]
[ROW][C]Statistic[/C][C]Variable X[/C][C]Variable Y[/C][/ROW]
[ROW][C]Mean[/C][C]1296.05970149254[/C][C]838.649253731343[/C][/ROW]
[ROW][C]Biased Variance[/C][C]27726.0561372243[/C][C]8648.43667854756[/C][/ROW]
[ROW][C]Biased Standard Deviation[/C][C]166.511429449225[/C][C]92.9969713407246[/C][/ROW]
[ROW][C]Covariance[/C][C]9914.85568398608[/C][/ROW]
[ROW][C]Correlation[/C][C]0.635507068928499[/C][/ROW]
[ROW][C]Determination[/C][C]0.403869234658092[/C][/ROW]
[ROW][C]T-Test[/C][C]9.45663405693548[/C][/ROW]
[ROW][C]p-value (2 sided)[/C][C]0[/C][/ROW]
[ROW][C]p-value (1 sided)[/C][C]0[/C][/ROW]
[ROW][C]Degrees of Freedom[/C][C]132[/C][/ROW]
[ROW][C]Number of Observations[/C][C]134[/C][/ROW]
[/TABLE]
Source: https://freestatistics.org/blog/index.php?pk=80911&T=1

Globally Unique Identifier (entire table): ba.freestatistics.org/blog/index.php?pk=80911&T=1

As an alternative you can also use a QR Code:  

The GUIDs for individual cells are displayed in the table below:

Pearson Product Moment Correlation - Ungrouped Data
StatisticVariable XVariable Y
Mean1296.05970149254838.649253731343
Biased Variance27726.05613722438648.43667854756
Biased Standard Deviation166.51142944922592.9969713407246
Covariance9914.85568398608
Correlation0.635507068928499
Determination0.403869234658092
T-Test9.45663405693548
p-value (2 sided)0
p-value (1 sided)0
Degrees of Freedom132
Number of Observations134


Parameters (Session):
Parameters (R input):
R code (references can be found in the software module):
bitmap(file='test1.png')
histx <- hist(x, plot=FALSE)
histy <- hist(y, plot=FALSE)
maxcounts <- max(c(histx$counts, histx$counts))
xrange <- c(min(x),max(x))
yrange <- c(min(y),max(y))
nf <- layout(matrix(c(2,0,1,3),2,2,byrow=TRUE), c(3,1), c(1,3), TRUE)
par(mar=c(4,4,1,1))
plot(x, y, xlim=xrange, ylim=yrange, xlab=xlab, ylab=ylab)
par(mar=c(0,4,1,1))
barplot(histx$counts, axes=FALSE, ylim=c(0, maxcounts), space=0)
par(mar=c(4,0,1,1))
barplot(histy$counts, axes=FALSE, xlim=c(0, maxcounts), space=0, horiz=TRUE)
dev.off()
lx = length(x)
makebiased = (lx-1)/lx
varx = var(x)*makebiased
vary = var(y)*makebiased
corxy <- cor.test(x,y,method='pearson')
cxy <- as.matrix(corxy$estimate)[1,1]
load(file='createtable')
a<-table.start()
a<-table.row.start(a)
a<-table.element(a,'Pearson Product Moment Correlation - Ungrouped Data',3,TRUE)
a<-table.row.end(a)
a<-table.row.start(a)
a<-table.element(a,'Statistic',1,TRUE)
a<-table.element(a,'Variable X',1,TRUE)
a<-table.element(a,'Variable Y',1,TRUE)
a<-table.row.end(a)
a<-table.row.start(a)
a<-table.element(a,hyperlink('arithmetic_mean.htm','Mean',''),header=TRUE)
a<-table.element(a,mean(x))
a<-table.element(a,mean(y))
a<-table.row.end(a)
a<-table.row.start(a)
a<-table.element(a,hyperlink('biased.htm','Biased Variance',''),header=TRUE)
a<-table.element(a,varx)
a<-table.element(a,vary)
a<-table.row.end(a)
a<-table.row.start(a)
a<-table.element(a,hyperlink('biased1.htm','Biased Standard Deviation',''),header=TRUE)
a<-table.element(a,sqrt(varx))
a<-table.element(a,sqrt(vary))
a<-table.row.end(a)
a<-table.row.start(a)
a<-table.element(a,hyperlink('covariance.htm','Covariance',''),header=TRUE)
a<-table.element(a,cov(x,y),2)
a<-table.row.end(a)
a<-table.row.start(a)
a<-table.element(a,hyperlink('pearson_correlation.htm','Correlation',''),header=TRUE)
a<-table.element(a,cxy,2)
a<-table.row.end(a)
a<-table.row.start(a)
a<-table.element(a,hyperlink('coeff_of_determination.htm','Determination',''),header=TRUE)
a<-table.element(a,cxy*cxy,2)
a<-table.row.end(a)
a<-table.row.start(a)
a<-table.element(a,hyperlink('ttest_statistic.htm','T-Test',''),header=TRUE)
a<-table.element(a,as.matrix(corxy$statistic)[1,1],2)
a<-table.row.end(a)
a<-table.row.start(a)
a<-table.element(a,'p-value (2 sided)',header=TRUE)
a<-table.element(a,(p2 <- as.matrix(corxy$p.value)[1,1]),2)
a<-table.row.end(a)
a<-table.row.start(a)
a<-table.element(a,'p-value (1 sided)',header=TRUE)
a<-table.element(a,p2/2,2)
a<-table.row.end(a)
a<-table.row.start(a)
a<-table.element(a,'Degrees of Freedom',header=TRUE)
a<-table.element(a,lx-2,2)
a<-table.row.end(a)
a<-table.row.start(a)
a<-table.element(a,'Number of Observations',header=TRUE)
a<-table.element(a,lx,2)
a<-table.row.end(a)
a<-table.end(a)
table.save(a,file='mytable.tab')