Free Statistics

of Irreproducible Research!

Author's title

Author*The author of this computation has been verified*
R Software Modulerwasp_notchedbox1.wasp
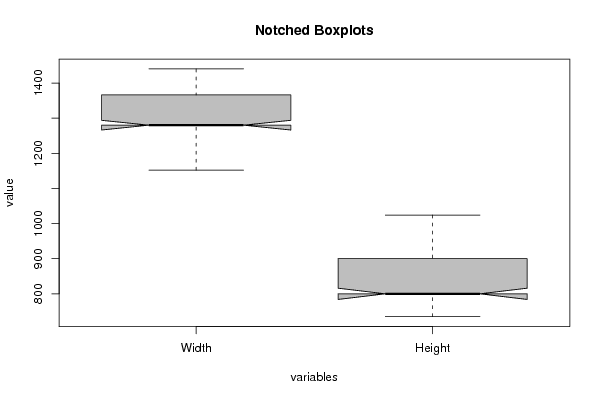
Title produced by softwareNotched Boxplots
Date of computationMon, 04 Oct 2010 18:21:04 +0000
Cite this page as followsStatistical Computations at FreeStatistics.org, Office for Research Development and Education, URL https://freestatistics.org/blog/index.php?v=date/2010/Oct/04/t1286216529kigkqs1qrsx93h3.htm/, Retrieved Sun, 28 Apr 2024 05:33:58 +0000
Statistical Computations at FreeStatistics.org, Office for Research Development and Education, URL https://freestatistics.org/blog/index.php?pk=80883, Retrieved Sun, 28 Apr 2024 05:33:58 +0000
QR Codes:

Original text written by user:
IsPrivate?No (this computation is public)
User-defined keywords
Estimated Impact113
Family? (F = Feedback message, R = changed R code, M = changed R Module, P = changed Parameters, D = changed Data)
-     [Notched Boxplots] [Screen Width and ...] [2010-09-25 10:03:47] [b98453cac15ba1066b407e146608df68]
F    D    [Notched Boxplots] [Task 7: Notched B...] [2010-10-04 18:21:04] [ee4a783fb13f41eb2e9bc8a0c4f26279] [Current]
- R         [Notched Boxplots] [] [2011-10-04 18:34:19] [d3c56829b3e69baec30b0d469b5d7237]
Feedback Forum
2010-10-08 14:48:47 [347d11d64cf4ded9ba0714e7297d928b] [reply
Niet volledig (1/2).
De student heeft teveel uitschieters weg gelaten. Een methode hiervoor was om gewoon alle data binnen het interval ]800000, 1700000[ te nemen. Hierdoor onstaan er nog paar uitschieters.
Ondanks dit foutje kan je wel zien dat de student de boxplot correct kan aflezen.
2010-10-09 08:33:55 [48eb36e2c01435ad7e4ea7854a9d98fe] [reply
Het is bij deze opdracht niet helemaal duidelijk waarop de student zich gebaseerd heeft om bepaalde resoluties (de eerste 27 en de laatste 14) weg te laten.

Wel is het inderdaad zo dat de student net iets te veel outliers heeft weggelaten. Een goed interval voor het aantal pixels (hoogte * breedte)van de gebruikte computerschermen is ]800000, 1700000[. De gegevens kan men opnieuw aanpassen door de broncode te wijzigen naar z <- z[z[,1]*z[,2]>800000 & z[,1]*z[,2]<1700000,].

Echter de interpretatie van de boxplot heeft de student wel zeer goed gedaan. De student is er namelijk in geslaagd om de juiste gegevens af te lezen uit deze notched boxplots.
2010-10-12 15:57:43 [Jasper Ledeganck] [reply
De student heeft ervoor gekozen om zo goed als alle outliers weg te laten uit de gegevensreeks. Dit was misschien niet nodig geweest, aangezien sommige outliers weldegelijk hun nut hebben in de berekeningen. Met de overgebleven gegevens heeft de student een degelijke boxplot gecreëerd, en deze correct geanalyseerd.De ons aangereikte oplossing is echter als volgt: Indien we aan de R-code de volgende regel toevoegen: z <- z[z[,1]*z[,2]>800000 & z[,1]*z[,2]<1700000,], dan worden enkel de schermen met een aantal pixels tusen 800.000 en 1.700.000 weergegeven. Hierbij zijn de outliers weggewerkt, terwijl de boxen amper gewijzigd zijn.


Post a new message
Dataseries X:
917	550
983	737
1024	768
1024	768
1024	768
1024	768
1024	768
1024	768
1024	768
1024	768
1024	768
1024	768
1024	768
1024	768
1024	768
1024	768
1024	640
1024	768
1024	768
1024	768
1024	768
1024	768
1024	768
1117	698
1120	700
1140	641
1143	857
1152	864
1152	864
1176	735
1176	735
1257	785
1280	1024
1280	800
1280	1024
1280	800
1280	800
1280	1024
1280	800
1280	800
1280	1024
1280	800
1280	800
1280	768
1280	800
1280	768
1280	800
1280	768
1280	1024
1280	800
1280	800
1280	800
1280	800
1280	800
1280	800
1280	1024
1280	800
1280	800
1280	800
1280	800
1280	800
1280	1024
1280	800
1280	800
1280	1024
1280	800
1280	800
1280	800
1280	1024
1280	800
1280	800
1280	800
1280	800
1280	800
1280	800
1280	800
1280	800
1280	800
1280	800
1280	800
1280	800
1280	1024
1280	800
1280	800
1280	800
1280	800
1280	800
1280	768
1280	800
1280	800
1280	800
1280	800
1280	800
1366	768
1366	768
1366	768
1366	768
1366	768
1366	768
1366	768
1366	768
1408	880
1408	880
1440	900
1440	900
1440	900
1440	900
1440	900
1440	900
1440	900
1440	900
1440	900
1440	900
1440	900
1440	900
1440	900
1440	900
1440	900
1440	900
1440	900
1440	900
1440	900
1440	900
1440	900
1503	845
1600	1200
1600	900
1600	900
1600	900
1600	900
1680	1050
1680	1050
1680	1050
1680	1050
1688	949
1760	990
1920	1200
1920	1080
2560	1440


Summary of computational transaction
Raw Inputview raw input (R code)
Raw Outputview raw output of R engine
Computing time1 seconds
R Server'Gwilym Jenkins' @ 72.249.127.135

\begin{tabular}{lllllllll}
\hline
Summary of computational transaction \tabularnewline
Raw Input & view raw input (R code)  \tabularnewline
Raw Output & view raw output of R engine  \tabularnewline
Computing time & 1 seconds \tabularnewline
R Server & 'Gwilym Jenkins' @ 72.249.127.135 \tabularnewline
\hline
\end{tabular}
%Source: https://freestatistics.org/blog/index.php?pk=80883&T=0

[TABLE]
[ROW][C]Summary of computational transaction[/C][/ROW]
[ROW][C]Raw Input[/C][C]view raw input (R code) [/C][/ROW]
[ROW][C]Raw Output[/C][C]view raw output of R engine [/C][/ROW]
[ROW][C]Computing time[/C][C]1 seconds[/C][/ROW]
[ROW][C]R Server[/C][C]'Gwilym Jenkins' @ 72.249.127.135[/C][/ROW]
[/TABLE]
Source: https://freestatistics.org/blog/index.php?pk=80883&T=0

Globally Unique Identifier (entire table): ba.freestatistics.org/blog/index.php?pk=80883&T=0

As an alternative you can also use a QR Code:  

The GUIDs for individual cells are displayed in the table below:

Summary of computational transaction
Raw Inputview raw input (R code)
Raw Outputview raw output of R engine
Computing time1 seconds
R Server'Gwilym Jenkins' @ 72.249.127.135


Boxplot statistics
Variablelower whiskerlower hingemedianupper hingeupper whisker
Width11521280128013661440
Height7358008009001024

\begin{tabular}{lllllllll}
\hline
Boxplot statistics \tabularnewline
Variable & lower whisker & lower hinge & median & upper hinge & upper whisker \tabularnewline
Width & 1152 & 1280 & 1280 & 1366 & 1440 \tabularnewline
Height & 735 & 800 & 800 & 900 & 1024 \tabularnewline
\hline
\end{tabular}
%Source: https://freestatistics.org/blog/index.php?pk=80883&T=1

[TABLE]
[ROW][C]Boxplot statistics[/C][/ROW]
[ROW][C]Variable[/C][C]lower whisker[/C][C]lower hinge[/C][C]median[/C][C]upper hinge[/C][C]upper whisker[/C][/ROW]
[ROW][C]Width[/C][C]1152[/C][C]1280[/C][C]1280[/C][C]1366[/C][C]1440[/C][/ROW]
[ROW][C]Height[/C][C]735[/C][C]800[/C][C]800[/C][C]900[/C][C]1024[/C][/ROW]
[/TABLE]
Source: https://freestatistics.org/blog/index.php?pk=80883&T=1

Globally Unique Identifier (entire table): ba.freestatistics.org/blog/index.php?pk=80883&T=1

As an alternative you can also use a QR Code:  

The GUIDs for individual cells are displayed in the table below:

Boxplot statistics
Variablelower whiskerlower hingemedianupper hingeupper whisker
Width11521280128013661440
Height7358008009001024


Boxplot Notches
Variablelower boundmedianupper bound
Width1266.2034763081612801293.79652369184
Height783.957530590889800816.042469409111

\begin{tabular}{lllllllll}
\hline
Boxplot Notches \tabularnewline
Variable & lower bound & median & upper bound \tabularnewline
Width & 1266.20347630816 & 1280 & 1293.79652369184 \tabularnewline
Height & 783.957530590889 & 800 & 816.042469409111 \tabularnewline
\hline
\end{tabular}
%Source: https://freestatistics.org/blog/index.php?pk=80883&T=2

[TABLE]
[ROW][C]Boxplot Notches[/C][/ROW]
[ROW][C]Variable[/C][C]lower bound[/C][C]median[/C][C]upper bound[/C][/ROW]
[ROW][C]Width[/C][C]1266.20347630816[/C][C]1280[/C][C]1293.79652369184[/C][/ROW]
[ROW][C]Height[/C][C]783.957530590889[/C][C]800[/C][C]816.042469409111[/C][/ROW]
[/TABLE]
Source: https://freestatistics.org/blog/index.php?pk=80883&T=2

Globally Unique Identifier (entire table): ba.freestatistics.org/blog/index.php?pk=80883&T=2

As an alternative you can also use a QR Code:  

The GUIDs for individual cells are displayed in the table below:

Boxplot Notches
Variablelower boundmedianupper bound
Width1266.2034763081612801293.79652369184
Height783.957530590889800816.042469409111


Parameters (Session):
par1 = grey ;
Parameters (R input):
par1 = grey ;
R code (references can be found in the software module):
z <- as.data.frame(t(y))
bitmap(file='test1.png')
(r<-boxplot(z ,xlab=xlab,ylab=ylab,main=main,notch=TRUE,col=par1))
dev.off()
load(file='createtable')
a<-table.start()
a<-table.row.start(a)
a<-table.element(a,hyperlink('overview.htm','Boxplot statistics','Boxplot overview'),6,TRUE)
a<-table.row.end(a)
a<-table.row.start(a)
a<-table.element(a,'Variable',1,TRUE)
a<-table.element(a,hyperlink('lower_whisker.htm','lower whisker','definition of lower whisker'),1,TRUE)
a<-table.element(a,hyperlink('lower_hinge.htm','lower hinge','definition of lower hinge'),1,TRUE)
a<-table.element(a,hyperlink('central_tendency.htm','median','definitions about measures of central tendency'),1,TRUE)
a<-table.element(a,hyperlink('upper_hinge.htm','upper hinge','definition of upper hinge'),1,TRUE)
a<-table.element(a,hyperlink('upper_whisker.htm','upper whisker','definition of upper whisker'),1,TRUE)
a<-table.row.end(a)
for (i in 1:length(y[,1]))
{
a<-table.row.start(a)
a<-table.element(a,dimnames(t(x))[[2]][i],1,TRUE)
for (j in 1:5)
{
a<-table.element(a,r$stats[j,i])
}
a<-table.row.end(a)
}
a<-table.end(a)
table.save(a,file='mytable.tab')
a<-table.start()
a<-table.row.start(a)
a<-table.element(a,'Boxplot Notches',4,TRUE)
a<-table.row.end(a)
a<-table.row.start(a)
a<-table.element(a,'Variable',1,TRUE)
a<-table.element(a,'lower bound',1,TRUE)
a<-table.element(a,'median',1,TRUE)
a<-table.element(a,'upper bound',1,TRUE)
a<-table.row.end(a)
for (i in 1:length(y[,1]))
{
a<-table.row.start(a)
a<-table.element(a,dimnames(t(x))[[2]][i],1,TRUE)
a<-table.element(a,r$conf[1,i])
a<-table.element(a,r$stats[3,i])
a<-table.element(a,r$conf[2,i])
a<-table.row.end(a)
}
a<-table.end(a)
table.save(a,file='mytable1.tab')