Free Statistics
of Irreproducible Research!
Description of Statistical Computation | |||||||||||||||||||||||||||||||||||||||||||||
|---|---|---|---|---|---|---|---|---|---|---|---|---|---|---|---|---|---|---|---|---|---|---|---|---|---|---|---|---|---|---|---|---|---|---|---|---|---|---|---|---|---|---|---|---|---|
| Author's title | |||||||||||||||||||||||||||||||||||||||||||||
| Author | *The author of this computation has been verified* | ||||||||||||||||||||||||||||||||||||||||||||
| R Software Module | rwasp_bidensity.wasp | ||||||||||||||||||||||||||||||||||||||||||||
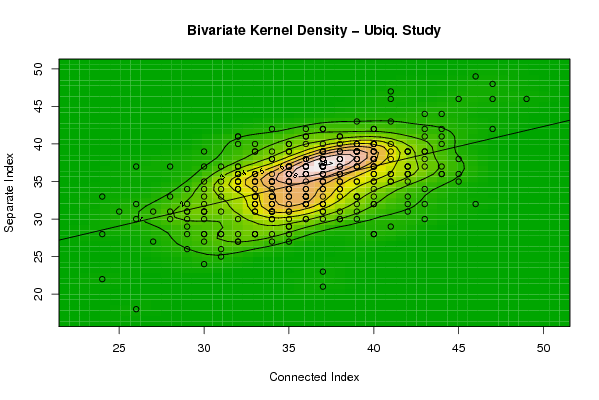
| Title produced by software | Bivariate Kernel Density Estimation | ||||||||||||||||||||||||||||||||||||||||||||
| Date of computation | Mon, 04 Oct 2010 07:40:49 +0000 | ||||||||||||||||||||||||||||||||||||||||||||
| Cite this page as follows | Statistical Computations at FreeStatistics.org, Office for Research Development and Education, URL https://freestatistics.org/blog/index.php?v=date/2010/Oct/04/t1286177972yp6631v9melb6a6.htm/, Retrieved Sun, 28 Apr 2024 11:09:41 +0000 | ||||||||||||||||||||||||||||||||||||||||||||
| Statistical Computations at FreeStatistics.org, Office for Research Development and Education, URL https://freestatistics.org/blog/index.php?pk=80428, Retrieved Sun, 28 Apr 2024 11:09:41 +0000 | |||||||||||||||||||||||||||||||||||||||||||||
| QR Codes: | |||||||||||||||||||||||||||||||||||||||||||||
|
| |||||||||||||||||||||||||||||||||||||||||||||
| Original text written by user: | |||||||||||||||||||||||||||||||||||||||||||||
| IsPrivate? | No (this computation is public) | ||||||||||||||||||||||||||||||||||||||||||||
| User-defined keywords | |||||||||||||||||||||||||||||||||||||||||||||
| Estimated Impact | 1077 | ||||||||||||||||||||||||||||||||||||||||||||
Tree of Dependent Computations | |||||||||||||||||||||||||||||||||||||||||||||
| Family? (F = Feedback message, R = changed R code, M = changed R Module, P = changed Parameters, D = changed Data) | |||||||||||||||||||||||||||||||||||||||||||||
| F [Bivariate Kernel Density Estimation] [Connected vs Sepa...] [2010-10-04 07:40:49] [d76b387543b13b5e3afd8ff9e5fdc89f] [Current] F [Bivariate Kernel Density Estimation] [Connected vs Sepa...] [2010-10-08 13:51:26] [aeb27d5c05332f2e597ad139ee63fbe4] - [Bivariate Kernel Density Estimation] [WS 2 Task 7] [2010-10-09 12:23:06] [afe9379cca749d06b3d6872e02cc47ed] - [Bivariate Kernel Density Estimation] [Task 7 probability] [2010-10-10 09:42:24] [87d60b8864dc39f7ed759c345edfb471] - [Bivariate Kernel Density Estimation] [Workshop 2 – Pr...] [2010-10-11 18:41:05] [603e2f5305d3a2a4e062624458fa1155] - [Bivariate Kernel Density Estimation] [] [2010-10-11 21:07:20] [f4dc4aa51d65be851b8508203d9f6001] F [Bivariate Kernel Density Estimation] [Task 7b] [2010-10-11 23:15:40] [48146708a479232c43a8f6e52fbf83b4] - PD [Bivariate Kernel Density Estimation] [Paper - Bivariate...] [2010-11-12 21:24:52] [6ff9fb24bdca608d2f4f1f9db3f6445e] - PD [Bivariate Kernel Density Estimation] [computation17] [2010-11-16 11:51:47] [dc30d19c3bc2be07fe595ad36c2cf923] - PD [Bivariate Kernel Density Estimation] [Paper - Bivariate...] [2010-11-12 21:24:52] [6ff9fb24bdca608d2f4f1f9db3f6445e] - R D [Bivariate Kernel Density Estimation] [Kernel Density Pl...] [2010-12-17 20:27:42] [87116ee6ef949037dfa02b8eb1a3bf97] - R P [Bivariate Kernel Density Estimation] [Workshop 2 - Task 7] [2011-10-07 08:41:41] [fbaf17a8836493f6de0f4e0e997711e1] - R P [Bivariate Kernel Density Estimation] [Task 7] [2011-10-07 14:10:38] [088a244c534fec2347300624359db3c1] - RM [Bivariate Kernel Density Estimation] [] [2011-10-07 15:33:21] [ee8c3a74bf3b349877806e9a50913c60] - RM [Bivariate Kernel Density Estimation] [] [2011-10-08 13:32:16] [06c08141d7d783218a8164fd2ea166f2] - R P [Bivariate Kernel Density Estimation] [] [2011-10-08 21:37:00] [a9a952c1cbc7081c25fad93a34aab827] - D [Bivariate Kernel Density Estimation] [PAPER: werklooshe...] [2011-12-20 21:18:56] [f0cb027b41af06223bae4ee77475f3bc] - R P [Bivariate Kernel Density Estimation] [Task 7 b] [2011-10-09 12:43:10] [1321c14511baa35aebbc5dda661708fe] - R P [Bivariate Kernel Density Estimation] [Task 7.2] [2011-10-09 17:49:33] [80bca13c5f9401fbb753952fd2952f4a] - [Bivariate Kernel Density Estimation] [Bivariate Kernel ...] [2012-12-05 15:47:08] [f8da7216ca6ab56f40bda6dd57b36742] - R P [Bivariate Kernel Density Estimation] [taak 7a] [2011-10-10 08:36:34] [c4580079d5d2b3f0ba412f27cdc441be] - R P [Bivariate Kernel Density Estimation] [] [2011-10-10 16:28:58] [aefb5c2d4042694c5b6b82f93ac1885a] - R P [Bivariate Kernel Density Estimation] [] [2011-10-10 16:30:55] [aefb5c2d4042694c5b6b82f93ac1885a] - R P [Bivariate Kernel Density Estimation] [Workshop 3 - Task 9] [2011-10-10 19:28:17] [6a3e51c0c7ab195427042dfaef1df5a0] - RM [Bivariate Kernel Density Estimation] [task 7] [2011-10-11 08:21:30] [379dab8110dbf77cfcc4b7951c3a599f] - R P [Bivariate Kernel Density Estimation] [bivairate kernel ...] [2011-10-11 08:39:38] [f2efe7b37bd12d7944b0ea184fe3529a] - RM [Bivariate Kernel Density Estimation] [ws2 -task 7] [2011-10-11 08:52:35] [7e261c986c934df955dd3ac53e9d45c6] - R P [Bivariate Kernel Density Estimation] [] [2011-10-11 10:38:28] [72554d79606dc183296fd485368f0ec1] - R P [Bivariate Kernel Density Estimation] [Vraag 7] [2011-10-11 11:00:03] [c505444e07acba7694d29053ca5d114e] - RM [Bivariate Kernel Density Estimation] [] [2011-10-11 12:55:35] [ad2d4c5ace9fa07b356a7b5098237581] - RM [Bivariate Kernel Density Estimation] [WS2 - Task 7] [2011-10-11 15:19:35] [74b1e5a3104ff0b2404b2865a63336ad] - RM [Bivariate Kernel Density Estimation] [WS2 - Task 7] [2011-10-11 15:19:35] [74b1e5a3104ff0b2404b2865a63336ad] - R P [Bivariate Kernel Density Estimation] [Workshop 2 - Fabr...] [2011-10-11 15:20:05] [60c0c94f647e2c90e494ab0f2a2f1926] - R P [Bivariate Kernel Density Estimation] [] [2011-10-11 15:40:08] [a1957df0bc37aec4aa3c994e6a08412c] - R P [Bivariate Kernel Density Estimation] [] [2011-10-11 15:52:26] [a1957df0bc37aec4aa3c994e6a08412c] - RM [Bivariate Kernel Density Estimation] [Workshop 2 Task 7.2] [2011-10-11 16:32:27] [59e9c089bdd600b584669dddc48fbcc3] - RM [Bivariate Kernel Density Estimation] [Workshop 2 Task 7.2] [2011-10-11 16:34:39] [59e9c089bdd600b584669dddc48fbcc3] - RM [Bivariate Kernel Density Estimation] [] [2011-10-11 17:11:06] [e21b9c93af4eb9605ecfaf58a559e5ab] - RM [Bivariate Kernel Density Estimation] [Task 7.2] [2011-10-11 19:45:49] [e51846b5e808727784baa8d5c183dcd5] - RM [Bivariate Kernel Density Estimation] [] [2011-10-11 21:04:35] [50e3859e0b739a5118d466e989dfc0cb] - RM [Bivariate Kernel Density Estimation] [WS 2 - 7.2 ] [2011-10-17 10:59:04] [2c786c21adba4dd4c8af44dce5258f06] - RM [Bivariate Kernel Density Estimation] [] [2011-12-02 16:50:36] [ee8c3a74bf3b349877806e9a50913c60] - RM [Bivariate Kernel Density Estimation] [Paper 1.1.2. Conn...] [2011-12-06 18:22:06] [9d4f280afcb4ecc352d7c6f913a0a151] - R PD [Bivariate Kernel Density Estimation] [Bivariate Kernel ...] [2011-12-16 14:05:29] [379dab8110dbf77cfcc4b7951c3a599f] - R P [Bivariate Kernel Density Estimation] [Connected vs sepe...] [2011-12-16 18:31:05] [c035d973aa8488be257660c2dc4ec375] - R P [Bivariate Kernel Density Estimation] [] [2011-12-18 13:23:13] [bdca8f3e7c3554be8c1291e54f61d441] - R PD [Bivariate Kernel Density Estimation] [bvfbvbvv] [2011-12-21 17:59:44] [a9671b130b33f9fcb98554992ce4582f] - RM [Bivariate Kernel Density Estimation] [Connected vs Sepa...] [2011-12-22 15:15:01] [1321c14511baa35aebbc5dda661708fe] - R PD [Bivariate Kernel Density Estimation] [] [2011-12-22 15:53:54] [18e0b15711387f6270134133fa101957] [Truncated] | |||||||||||||||||||||||||||||||||||||||||||||
| Feedback Forum | |||||||||||||||||||||||||||||||||||||||||||||
Post a new message | |||||||||||||||||||||||||||||||||||||||||||||
Dataset | |||||||||||||||||||||||||||||||||||||||||||||
| Dataseries X: | |||||||||||||||||||||||||||||||||||||||||||||
34 33 29 34 32 35 41 27 40 40 36 40 43 40 33 37 32 26 36 39 38 34 35 41 42 36 39 33 33 36 37 36 34 32 35 39 30 25 29 39 31 26 28 40 32 35 32 41 34 36 38 34 32 34 32 40 43 35 45 36 39 31 36 36 37 40 35 36 32 36 37 42 37 36 36 33 37 35 37 28 33 45 38 43 37 36 40 39 43 32 37 34 44 35 34 37 40 36 44 35 34 40 34 39 36 40 37 35 45 39 39 37 38 46 37 27 33 42 33 33 33 38 37 35 33 39 38 39 38 30 43 34 39 36 32 37 42 40 35 39 34 28 30 36 31 34 33 37 40 39 42 47 38 38 40 37 29 37 37 33 31 36 37 39 35 33 37 42 31 32 36 32 40 32 30 37 42 37 47 37 31 41 44 40 37 33 35 40 38 36 36 35 30 37 43 33 39 38 40 29 35 37 26 28 38 29 35 38 39 44 33 35 42 30 36 40 39 36 37 37 37 36 30 32 35 42 41 35 33 39 34 39 41 34 30 29 33 40 32 37 37 36 41 34 38 40 42 32 40 38 35 34 38 24 39 42 44 35 37 34 41 33 42 30 30 40 49 39 29 39 35 35 34 24 47 24 30 34 41 32 32 35 37 40 45 35 39 46 33 40 35 38 36 34 30 44 37 36 37 34 43 31 34 38 38 34 26 36 35 37 40 43 29 30 36 38 43 41 31 36 44 35 42 31 38 34 40 41 30 43 | |||||||||||||||||||||||||||||||||||||||||||||
| Dataseries Y: | |||||||||||||||||||||||||||||||||||||||||||||
30 28 31 35 35 37 39 31 38 37 37 35 37 42 28 37 36 37 33 40 30 36 33 40 37 37 39 35 36 34 36 32 33 27 37 32 31 31 32 37 25 30 37 37 40 35 35 43 32 42 35 27 30 31 36 36 41 34 36 33 35 28 33 38 37 39 34 32 36 36 35 33 42 36 33 36 32 35 38 33 32 38 39 39 39 30 38 38 42 41 31 39 40 31 34 23 28 36 41 29 31 33 35 35 34 40 34 36 35 39 33 37 40 32 37 27 35 37 32 31 31 38 34 30 34 37 38 33 35 27 34 35 39 35 34 36 36 32 39 40 35 31 35 38 37 31 32 35 39 31 39 48 33 36 40 37 34 42 39 28 26 30 30 39 37 40 38 35 33 34 33 41 36 27 33 38 31 31 46 33 34 47 36 38 32 33 34 34 37 37 41 27 31 38 30 36 30 34 32 29 29 39 32 30 39 30 40 41 38 37 33 34 36 39 41 42 38 40 32 40 37 36 28 36 35 32 38 32 39 39 31 33 46 38 24 28 35 39 37 38 38 32 36 28 38 28 37 28 40 34 33 32 30 33 37 39 42 36 35 32 35 33 36 31 32 38 46 39 31 39 36 37 33 22 42 28 28 31 36 37 35 31 37 38 46 40 43 49 39 37 36 31 32 38 37 36 21 32 36 35 39 28 42 36 41 30 18 37 28 39 40 44 26 34 37 37 32 29 31 32 44 39 39 35 36 33 35 35 30 38 | |||||||||||||||||||||||||||||||||||||||||||||
Tables (Output of Computation) | |||||||||||||||||||||||||||||||||||||||||||||
| |||||||||||||||||||||||||||||||||||||||||||||
Figures (Output of Computation) | |||||||||||||||||||||||||||||||||||||||||||||
Input Parameters & R Code | |||||||||||||||||||||||||||||||||||||||||||||
| Parameters (Session): | |||||||||||||||||||||||||||||||||||||||||||||
| par1 = 50 ; par2 = 50 ; par3 = 0 ; par4 = 0 ; par5 = 0 ; par6 = Y ; par7 = Y ; | |||||||||||||||||||||||||||||||||||||||||||||
| Parameters (R input): | |||||||||||||||||||||||||||||||||||||||||||||
| par1 = 50 ; par2 = 50 ; par3 = 0 ; par4 = 0 ; par5 = 0 ; par6 = Y ; par7 = Y ; | |||||||||||||||||||||||||||||||||||||||||||||
| R code (references can be found in the software module): | |||||||||||||||||||||||||||||||||||||||||||||
par1 <- as(par1,'numeric') | |||||||||||||||||||||||||||||||||||||||||||||