Free Statistics
of Irreproducible Research!
Description of Statistical Computation | |||||||||||||||||||||||||||||||||||||||||||||||||||||||||||||||||||||||||||||||||||||||||||||||||||
|---|---|---|---|---|---|---|---|---|---|---|---|---|---|---|---|---|---|---|---|---|---|---|---|---|---|---|---|---|---|---|---|---|---|---|---|---|---|---|---|---|---|---|---|---|---|---|---|---|---|---|---|---|---|---|---|---|---|---|---|---|---|---|---|---|---|---|---|---|---|---|---|---|---|---|---|---|---|---|---|---|---|---|---|---|---|---|---|---|---|---|---|---|---|---|---|---|---|---|---|
| Author's title | |||||||||||||||||||||||||||||||||||||||||||||||||||||||||||||||||||||||||||||||||||||||||||||||||||
| Author | *The author of this computation has been verified* | ||||||||||||||||||||||||||||||||||||||||||||||||||||||||||||||||||||||||||||||||||||||||||||||||||
| R Software Module | rwasp_correlation.wasp | ||||||||||||||||||||||||||||||||||||||||||||||||||||||||||||||||||||||||||||||||||||||||||||||||||
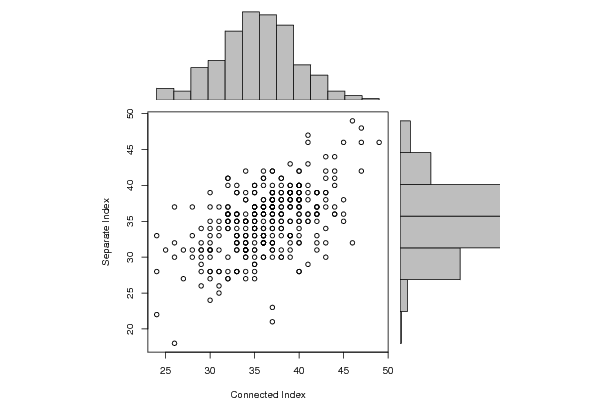
| Title produced by software | Pearson Correlation | ||||||||||||||||||||||||||||||||||||||||||||||||||||||||||||||||||||||||||||||||||||||||||||||||||
| Date of computation | Mon, 04 Oct 2010 07:35:56 +0000 | ||||||||||||||||||||||||||||||||||||||||||||||||||||||||||||||||||||||||||||||||||||||||||||||||||
| Cite this page as follows | Statistical Computations at FreeStatistics.org, Office for Research Development and Education, URL https://freestatistics.org/blog/index.php?v=date/2010/Oct/04/t1286177687uc19g682ty1w165.htm/, Retrieved Sat, 27 Apr 2024 17:12:43 +0000 | ||||||||||||||||||||||||||||||||||||||||||||||||||||||||||||||||||||||||||||||||||||||||||||||||||
| Statistical Computations at FreeStatistics.org, Office for Research Development and Education, URL https://freestatistics.org/blog/index.php?pk=80427, Retrieved Sat, 27 Apr 2024 17:12:43 +0000 | |||||||||||||||||||||||||||||||||||||||||||||||||||||||||||||||||||||||||||||||||||||||||||||||||||
| QR Codes: | |||||||||||||||||||||||||||||||||||||||||||||||||||||||||||||||||||||||||||||||||||||||||||||||||||
|
| |||||||||||||||||||||||||||||||||||||||||||||||||||||||||||||||||||||||||||||||||||||||||||||||||||
| Original text written by user: | |||||||||||||||||||||||||||||||||||||||||||||||||||||||||||||||||||||||||||||||||||||||||||||||||||
| IsPrivate? | No (this computation is public) | ||||||||||||||||||||||||||||||||||||||||||||||||||||||||||||||||||||||||||||||||||||||||||||||||||
| User-defined keywords | |||||||||||||||||||||||||||||||||||||||||||||||||||||||||||||||||||||||||||||||||||||||||||||||||||
| Estimated Impact | 506 | ||||||||||||||||||||||||||||||||||||||||||||||||||||||||||||||||||||||||||||||||||||||||||||||||||
Tree of Dependent Computations | |||||||||||||||||||||||||||||||||||||||||||||||||||||||||||||||||||||||||||||||||||||||||||||||||||
| Family? (F = Feedback message, R = changed R code, M = changed R Module, P = changed Parameters, D = changed Data) | |||||||||||||||||||||||||||||||||||||||||||||||||||||||||||||||||||||||||||||||||||||||||||||||||||
| - [Pearson Correlation] [Connected vs Sepa...] [2010-10-04 07:35:56] [d76b387543b13b5e3afd8ff9e5fdc89f] [Current] F [Pearson Correlation] [Connected vs Sepa...] [2010-10-08 13:44:47] [aeb27d5c05332f2e597ad139ee63fbe4] F [Pearson Correlation] [Task7] [2010-10-10 13:34:19] [945bcebba5e7ac34a41d6888338a1ba9] F [Pearson Correlation] [Task 7a] [2010-10-11 23:13:12] [48146708a479232c43a8f6e52fbf83b4] - PD [Pearson Correlation] [Paper - Pearson] [2010-11-12 21:21:48] [6ff9fb24bdca608d2f4f1f9db3f6445e] - PD [Pearson Correlation] [computation16] [2010-11-16 11:45:29] [dc30d19c3bc2be07fe595ad36c2cf923] - D [Pearson Correlation] [] [2010-11-13 16:18:29] [39e83c7b0ac936e906a817a1bb402750] - D [Pearson Correlation] [] [2010-11-13 16:27:39] [39e83c7b0ac936e906a817a1bb402750] - PD [Pearson Correlation] [] [2010-11-13 17:22:12] [39e83c7b0ac936e906a817a1bb402750] - D [Pearson Correlation] [] [2010-11-13 17:26:35] [39e83c7b0ac936e906a817a1bb402750] - RM [Pearson Correlation] [Task 7] [2011-10-07 14:12:13] [088a244c534fec2347300624359db3c1] - R [Pearson Correlation] [] [2011-10-07 15:07:24] [ee8c3a74bf3b349877806e9a50913c60] - RM [Pearson Correlation] [] [2011-10-08 13:31:39] [06c08141d7d783218a8164fd2ea166f2] - R [Pearson Correlation] [] [2011-10-08 21:36:01] [a9a952c1cbc7081c25fad93a34aab827] - D [Pearson Correlation] [PAPER: werklooshe...] [2011-12-20 21:12:47] [f0cb027b41af06223bae4ee77475f3bc] - R [Pearson Correlation] [Task 7 a] [2011-10-09 12:41:46] [1321c14511baa35aebbc5dda661708fe] - R [Pearson Correlation] [Task 7] [2011-10-09 17:47:31] [80bca13c5f9401fbb753952fd2952f4a] - [Pearson Correlation] [Pearson correlation] [2012-12-05 15:45:45] [f8da7216ca6ab56f40bda6dd57b36742] - RMP [Pearson Correlation] [taak 7b] [2011-10-10 08:37:51] [c4580079d5d2b3f0ba412f27cdc441be] - R [Pearson Correlation] [] [2011-10-10 16:28:01] [aefb5c2d4042694c5b6b82f93ac1885a] - RM [Pearson Correlation] [task 7] [2011-10-11 08:20:51] [379dab8110dbf77cfcc4b7951c3a599f] - R [Pearson Correlation] [Vraag 7] [2011-10-11 10:58:41] [c505444e07acba7694d29053ca5d114e] - RM [Pearson Correlation] [] [2011-10-11 12:55:01] [ad2d4c5ace9fa07b356a7b5098237581] - R P [Pearson Correlation] [] [2011-10-11 15:39:09] [a1957df0bc37aec4aa3c994e6a08412c] - R P [Pearson Correlation] [] [2011-10-11 15:51:24] [a1957df0bc37aec4aa3c994e6a08412c] - R [Pearson Correlation] [Workshop 2 - Task 9] [2011-10-11 16:11:46] [620e5553455d245695b6e856984b13e0] - RM [Pearson Correlation] [Workshop 2 Task 7.1] [2011-10-11 16:31:25] [59e9c089bdd600b584669dddc48fbcc3] - RM [Pearson Correlation] [] [2011-10-11 17:11:00] [e21b9c93af4eb9605ecfaf58a559e5ab] - RM [Pearson Correlation] [Task 7.1] [2011-10-11 19:44:04] [e51846b5e808727784baa8d5c183dcd5] - RM [Pearson Correlation] [Workshop 2 - task 7] [2011-10-11 22:31:23] [43a132f5d1d3e2c258a569e3803c6f06] - R D [Pearson Correlation] [] [2011-10-13 13:41:08] [6d8d5ddb787739e9d7807ef3376f0127] - RM D [Random Number Generator - Log-Normal Distribution] [] [2011-10-13 13:50:03] [6d8d5ddb787739e9d7807ef3376f0127] - P [Random Number Generator - Log-Normal Distribution] [] [2011-12-15 14:26:40] [6d8d5ddb787739e9d7807ef3376f0127] - R D [Pearson Correlation] [] [2011-10-14 09:53:14] [088a244c534fec2347300624359db3c1] - RM [Pearson Correlation] [WS 2 - 7.1 ] [2011-10-17 10:58:59] [2c786c21adba4dd4c8af44dce5258f06] - R D [Pearson Correlation] [Scatterplot] [2011-11-13 13:58:16] [7ec97e350862fea9ec6e4fa3b5b6058f] - RMPD [Linear Regression Graphical Model Validation] [Linear Regression...] [2011-11-13 13:59:28] [7ec97e350862fea9ec6e4fa3b5b6058f] - RMPD [Linear Regression Graphical Model Validation] [Diesel prijzen ve...] [2011-11-13 14:49:20] [7ec97e350862fea9ec6e4fa3b5b6058f] - R D [Pearson Correlation] [] [2011-11-14 19:02:55] [14511500b645ce5186c706473940fe45] - RMPD [Bivariate Kernel Density Estimation] [] [2011-11-14 19:08:14] [14511500b645ce5186c706473940fe45] - R [Pearson Correlation] [] [2011-11-29 14:44:44] [d623f9be707a26b8ffaece1fc4d5a7ee] - [Pearson Correlation] [] [2011-11-29 17:08:06] [85c740202f6a07d51229b0a6b62ca11c] - [Pearson Correlation] [] [2011-12-06 22:08:57] [74be16979710d4c4e7c6647856088456] - [Pearson Correlation] [] [2011-12-15 07:51:25] [f98f9dc58dd24d7896d4ecb781e1c75c] - [Pearson Correlation] [] [2011-12-20 08:20:52] [74be16979710d4c4e7c6647856088456] - M [Pearson Correlation] [] [2011-12-22 11:59:18] [74be16979710d4c4e7c6647856088456] - RMPD [Bivariate Kernel Density Estimation] [] [2011-11-29 14:53:34] [d623f9be707a26b8ffaece1fc4d5a7ee] - R [Bivariate Kernel Density Estimation] [] [2011-11-29 17:11:45] [85c740202f6a07d51229b0a6b62ca11c] - R [Bivariate Kernel Density Estimation] [] [2011-12-06 22:10:11] [74be16979710d4c4e7c6647856088456] [Truncated] | |||||||||||||||||||||||||||||||||||||||||||||||||||||||||||||||||||||||||||||||||||||||||||||||||||
| Feedback Forum | |||||||||||||||||||||||||||||||||||||||||||||||||||||||||||||||||||||||||||||||||||||||||||||||||||
Post a new message | |||||||||||||||||||||||||||||||||||||||||||||||||||||||||||||||||||||||||||||||||||||||||||||||||||
Dataset | |||||||||||||||||||||||||||||||||||||||||||||||||||||||||||||||||||||||||||||||||||||||||||||||||||
| Dataseries X: | |||||||||||||||||||||||||||||||||||||||||||||||||||||||||||||||||||||||||||||||||||||||||||||||||||
34 33 29 34 32 35 41 27 40 40 36 40 43 40 33 37 32 26 36 39 38 34 35 41 42 36 39 33 33 36 37 36 34 32 35 39 30 25 29 39 31 26 28 40 32 35 32 41 34 36 38 34 32 34 32 40 43 35 45 36 39 31 36 36 37 40 35 36 32 36 37 42 37 36 36 33 37 35 37 28 33 45 38 43 37 36 40 39 43 32 37 34 44 35 34 37 40 36 44 35 34 40 34 39 36 40 37 35 45 39 39 37 38 46 37 27 33 42 33 33 33 38 37 35 33 39 38 39 38 30 43 34 39 36 32 37 42 40 35 39 34 28 30 36 31 34 33 37 40 39 42 47 38 38 40 37 29 37 37 33 31 36 37 39 35 33 37 42 31 32 36 32 40 32 30 37 42 37 47 37 31 41 44 40 37 33 35 40 38 36 36 35 30 37 43 33 39 38 40 29 35 37 26 28 38 29 35 38 39 44 33 35 42 30 36 40 39 36 37 37 37 36 30 32 35 42 41 35 33 39 34 39 41 34 30 29 33 40 32 37 37 36 41 34 38 40 42 32 40 38 35 34 38 24 39 42 44 35 37 34 41 33 42 30 30 40 49 39 29 39 35 35 34 24 47 24 30 34 41 32 32 35 37 40 45 35 39 46 33 40 35 38 36 34 30 44 37 36 37 34 43 31 34 38 38 34 26 36 35 37 40 43 29 30 36 38 43 41 31 36 44 35 42 31 38 34 40 41 30 43 | |||||||||||||||||||||||||||||||||||||||||||||||||||||||||||||||||||||||||||||||||||||||||||||||||||
| Dataseries Y: | |||||||||||||||||||||||||||||||||||||||||||||||||||||||||||||||||||||||||||||||||||||||||||||||||||
30 28 31 35 35 37 39 31 38 37 37 35 37 42 28 37 36 37 33 40 30 36 33 40 37 37 39 35 36 34 36 32 33 27 37 32 31 31 32 37 25 30 37 37 40 35 35 43 32 42 35 27 30 31 36 36 41 34 36 33 35 28 33 38 37 39 34 32 36 36 35 33 42 36 33 36 32 35 38 33 32 38 39 39 39 30 38 38 42 41 31 39 40 31 34 23 28 36 41 29 31 33 35 35 34 40 34 36 35 39 33 37 40 32 37 27 35 37 32 31 31 38 34 30 34 37 38 33 35 27 34 35 39 35 34 36 36 32 39 40 35 31 35 38 37 31 32 35 39 31 39 48 33 36 40 37 34 42 39 28 26 30 30 39 37 40 38 35 33 34 33 41 36 27 33 38 31 31 46 33 34 47 36 38 32 33 34 34 37 37 41 27 31 38 30 36 30 34 32 29 29 39 32 30 39 30 40 41 38 37 33 34 36 39 41 42 38 40 32 40 37 36 28 36 35 32 38 32 39 39 31 33 46 38 24 28 35 39 37 38 38 32 36 28 38 28 37 28 40 34 33 32 30 33 37 39 42 36 35 32 35 33 36 31 32 38 46 39 31 39 36 37 33 22 42 28 28 31 36 37 35 31 37 38 46 40 43 49 39 37 36 31 32 38 37 36 21 32 36 35 39 28 42 36 41 30 18 37 28 39 40 44 26 34 37 37 32 29 31 32 44 39 39 35 36 33 35 35 30 38 | |||||||||||||||||||||||||||||||||||||||||||||||||||||||||||||||||||||||||||||||||||||||||||||||||||
Tables (Output of Computation) | |||||||||||||||||||||||||||||||||||||||||||||||||||||||||||||||||||||||||||||||||||||||||||||||||||
| |||||||||||||||||||||||||||||||||||||||||||||||||||||||||||||||||||||||||||||||||||||||||||||||||||
Figures (Output of Computation) | |||||||||||||||||||||||||||||||||||||||||||||||||||||||||||||||||||||||||||||||||||||||||||||||||||
Input Parameters & R Code | |||||||||||||||||||||||||||||||||||||||||||||||||||||||||||||||||||||||||||||||||||||||||||||||||||
| Parameters (Session): | |||||||||||||||||||||||||||||||||||||||||||||||||||||||||||||||||||||||||||||||||||||||||||||||||||
| Parameters (R input): | |||||||||||||||||||||||||||||||||||||||||||||||||||||||||||||||||||||||||||||||||||||||||||||||||||
| R code (references can be found in the software module): | |||||||||||||||||||||||||||||||||||||||||||||||||||||||||||||||||||||||||||||||||||||||||||||||||||
bitmap(file='test1.png') | |||||||||||||||||||||||||||||||||||||||||||||||||||||||||||||||||||||||||||||||||||||||||||||||||||