Free Statistics
of Irreproducible Research!
Description of Statistical Computation | |||||||||||||||||||||||||||||||||||||||||||||||||||||||||||||||||||||||||||||||||||||||||||||||||||
|---|---|---|---|---|---|---|---|---|---|---|---|---|---|---|---|---|---|---|---|---|---|---|---|---|---|---|---|---|---|---|---|---|---|---|---|---|---|---|---|---|---|---|---|---|---|---|---|---|---|---|---|---|---|---|---|---|---|---|---|---|---|---|---|---|---|---|---|---|---|---|---|---|---|---|---|---|---|---|---|---|---|---|---|---|---|---|---|---|---|---|---|---|---|---|---|---|---|---|---|
| Author's title | |||||||||||||||||||||||||||||||||||||||||||||||||||||||||||||||||||||||||||||||||||||||||||||||||||
| Author | *The author of this computation has been verified* | ||||||||||||||||||||||||||||||||||||||||||||||||||||||||||||||||||||||||||||||||||||||||||||||||||
| R Software Module | rwasp_correlation.wasp | ||||||||||||||||||||||||||||||||||||||||||||||||||||||||||||||||||||||||||||||||||||||||||||||||||
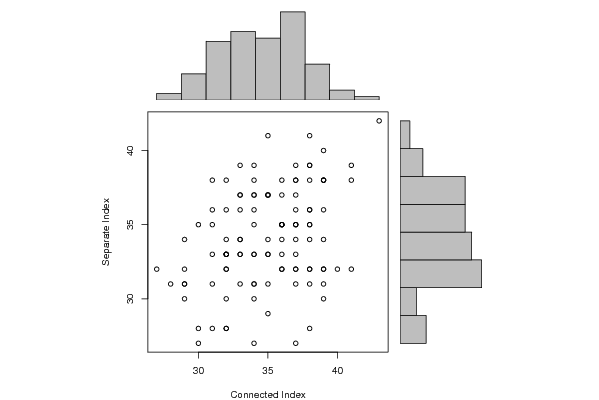
| Title produced by software | Pearson Correlation | ||||||||||||||||||||||||||||||||||||||||||||||||||||||||||||||||||||||||||||||||||||||||||||||||||
| Date of computation | Mon, 04 Oct 2010 07:34:27 +0000 | ||||||||||||||||||||||||||||||||||||||||||||||||||||||||||||||||||||||||||||||||||||||||||||||||||
| Cite this page as follows | Statistical Computations at FreeStatistics.org, Office for Research Development and Education, URL https://freestatistics.org/blog/index.php?v=date/2010/Oct/04/t1286177596qys31fvplos78yi.htm/, Retrieved Sun, 28 Apr 2024 13:54:58 +0000 | ||||||||||||||||||||||||||||||||||||||||||||||||||||||||||||||||||||||||||||||||||||||||||||||||||
| Statistical Computations at FreeStatistics.org, Office for Research Development and Education, URL https://freestatistics.org/blog/index.php?pk=80426, Retrieved Sun, 28 Apr 2024 13:54:58 +0000 | |||||||||||||||||||||||||||||||||||||||||||||||||||||||||||||||||||||||||||||||||||||||||||||||||||
| QR Codes: | |||||||||||||||||||||||||||||||||||||||||||||||||||||||||||||||||||||||||||||||||||||||||||||||||||
|
| |||||||||||||||||||||||||||||||||||||||||||||||||||||||||||||||||||||||||||||||||||||||||||||||||||
| Original text written by user: | |||||||||||||||||||||||||||||||||||||||||||||||||||||||||||||||||||||||||||||||||||||||||||||||||||
| IsPrivate? | No (this computation is public) | ||||||||||||||||||||||||||||||||||||||||||||||||||||||||||||||||||||||||||||||||||||||||||||||||||
| User-defined keywords | |||||||||||||||||||||||||||||||||||||||||||||||||||||||||||||||||||||||||||||||||||||||||||||||||||
| Estimated Impact | 766 | ||||||||||||||||||||||||||||||||||||||||||||||||||||||||||||||||||||||||||||||||||||||||||||||||||
Tree of Dependent Computations | |||||||||||||||||||||||||||||||||||||||||||||||||||||||||||||||||||||||||||||||||||||||||||||||||||
| Family? (F = Feedback message, R = changed R code, M = changed R Module, P = changed Parameters, D = changed Data) | |||||||||||||||||||||||||||||||||||||||||||||||||||||||||||||||||||||||||||||||||||||||||||||||||||
| F [Pearson Correlation] [Connected vs Sepa...] [2010-10-04 07:34:27] [d76b387543b13b5e3afd8ff9e5fdc89f] [Current] F [Pearson Correlation] [Connected vs Sepa...] [2010-10-08 13:59:04] [aeb27d5c05332f2e597ad139ee63fbe4] - [Pearson Correlation] [] [2010-10-11 10:38:30] [033eb2749a430605d9b2be7c4aac4a0c] F [Pearson Correlation] [Task 8a] [2010-10-11 23:38:33] [48146708a479232c43a8f6e52fbf83b4] - R P [Pearson Correlation] [Task 8] [2011-10-07 14:23:07] [088a244c534fec2347300624359db3c1] - R [Pearson Correlation] [] [2011-10-08 21:37:53] [a9a952c1cbc7081c25fad93a34aab827] - R [Pearson Correlation] [Task 8 a] [2011-10-09 12:49:45] [1321c14511baa35aebbc5dda661708fe] - R [Pearson Correlation] [] [2011-10-10 16:57:11] [aefb5c2d4042694c5b6b82f93ac1885a] - R [Pearson Correlation] [task 8] [2011-10-11 08:48:50] [379dab8110dbf77cfcc4b7951c3a599f] - R [Pearson Correlation] [task 8] [2011-10-11 08:48:50] [379dab8110dbf77cfcc4b7951c3a599f] - RM [Pearson Correlation] [ws 2 - task 8] [2011-10-11 09:14:15] [7e261c986c934df955dd3ac53e9d45c6] - R [Pearson Correlation] [WS1-8 ] [2011-10-11 10:14:23] [2c786c21adba4dd4c8af44dce5258f06] - R [Pearson Correlation] [] [2011-10-11 13:19:49] [ad2d4c5ace9fa07b356a7b5098237581] - RM [Pearson Correlation] [] [2011-10-11 13:21:22] [ad2d4c5ace9fa07b356a7b5098237581] - R [Pearson Correlation] [Task 8] [2011-10-11 14:50:23] [80bca13c5f9401fbb753952fd2952f4a] - R P [Pearson Correlation] [] [2011-10-11 15:53:03] [a1957df0bc37aec4aa3c994e6a08412c] - R [Pearson Correlation] [Workshop 2 - Task 9] [2011-10-11 16:07:29] [620e5553455d245695b6e856984b13e0] - RM [Pearson Correlation] [Workshop 2 Task 8.1] [2011-10-11 17:03:51] [59e9c089bdd600b584669dddc48fbcc3] - RM [Pearson Correlation] [] [2011-10-11 17:22:53] [e21b9c93af4eb9605ecfaf58a559e5ab] - RM [Pearson Correlation] [Task 8.1] [2011-10-11 20:04:09] [e51846b5e808727784baa8d5c183dcd5] - R PD [Pearson Correlation] [] [2011-11-15 11:51:55] [18e0b15711387f6270134133fa101957] - R D [Pearson Correlation] [Paper Deel 1 Scat...] [2011-12-21 15:07:30] [8501ca4b76170905b8a207a77f626994] - RM [Pearson Correlation] [Connected vs Sepa...] [2011-12-22 15:13:52] [1321c14511baa35aebbc5dda661708fe] - RMP [Pearson Correlation] [Workshop - Task 8] [2012-10-05 10:32:14] [37f59b7a972c225c3d32d27fed432050] - RMP [Pearson Correlation] [Workshop 2 - Task 8] [2012-10-05 10:44:30] [37f59b7a972c225c3d32d27fed432050] - RM [Pearson Correlation] [WS2 - taak 8] [2012-10-05 11:39:15] [8ce6c7315af51b5eb6923c5fe455d382] - RM [Pearson Correlation] [WS2 - Task8] [2012-10-05 13:47:15] [0604709baf8ca89a71bc0fcadc3cdffd] - RM [Pearson Correlation] [Task 7 workshop 2...] [2012-10-06 11:31:27] [8c30f4dd45e15fd207e4faf2fdf6253e] - RM [Pearson Correlation] [Task 8 workshop 2...] [2012-10-06 11:32:04] [8c30f4dd45e15fd207e4faf2fdf6253e] - R [Pearson Correlation] [scatterplot - taak 8] [2012-10-06 12:49:20] [677a26acc722ccb2eb1c0d7cc83e1e7a] - R [Pearson Correlation] [Task 8.1] [2012-10-06 12:56:40] [9d6050326bbbd058eed49c2dec5f39c1] - RM [Pearson Correlation] [Task 8] [2012-10-07 18:17:37] [783d8509970888a6ec44a5a7a0d2a339] - RM [Pearson Correlation] [Task 8 Computation] [2012-10-08 10:13:04] [ed906dce46ddef36a6228cf206971146] - RM [Pearson Correlation] [Task 8 Computatio...] [2012-10-08 10:24:26] [ed906dce46ddef36a6228cf206971146] - R [Pearson Correlation] [Task 8] [2012-10-08 14:54:50] [f8da7216ca6ab56f40bda6dd57b36742] - R [Pearson Correlation] [Taak 8] [2012-10-08 20:38:28] [c5e00e3d2459b4cd6380f7873395bbc5] - R [Pearson Correlation] [WS2 task 8a] [2012-10-09 07:53:00] [d31c851fa7fbee45412c0a7bcdad10e5] - RM [Pearson Correlation] [Taak 7: ws2] [2012-10-09 09:27:08] [73586a5ad7cb70bd9d8f219d68ef24b6] - RM [Pearson Correlation] [workshop 2: task 8 a] [2012-10-09 16:25:05] [dbae308bdff61c0f4902cc85498d0d35] - R [Pearson Correlation] [vraag 8] [2012-10-09 17:14:44] [5971e03025aa6333f85f7b726952428d] - R [Pearson Correlation] [Workshop 2: Task ...] [2012-10-09 17:28:37] [318be0e97d03618d227a3f8f0242bca0] - RM [Pearson Correlation] [Workshop 2 Taak 8] [2012-10-09 17:33:11] [05f184ff1dd8ec5f8655ec5b10c677e2] - R P [Pearson Correlation] [Workshop 2 – Pr...] [2012-10-09 18:21:47] [b8fff3381cd5ab6dded5825409053f97] - R [Pearson Correlation] [workshop 2 taak 8...] [2012-10-09 21:50:24] [081ff4808467d7c84e980fa7f896f721] - RM [Pearson Correlation] [Pearson correlation] [2012-12-09 16:54:07] [c85dbc843174c8f40de92b1c92b5205a] - RM [Pearson Correlation] [Paper] [2012-12-11 11:16:06] [0883bf8f4217d775edf6393676d58a73] - R [Pearson Correlation] [Paper - Pearson ] [2012-12-12 20:06:23] [7dcdf88f8d4909016d1a598b3c226ce5] - RM [Pearson Correlation] [Workshop 2 - Task 8] [2013-10-15 12:37:43] [fc82b8c760ed89156a53b254f8e95ae0] - RM [Pearson Correlation] [] [2013-10-15 20:08:38] [67894a4ff6098ffac356bc81e6028257] [Truncated] | |||||||||||||||||||||||||||||||||||||||||||||||||||||||||||||||||||||||||||||||||||||||||||||||||||
| Feedback Forum | |||||||||||||||||||||||||||||||||||||||||||||||||||||||||||||||||||||||||||||||||||||||||||||||||||
Post a new message | |||||||||||||||||||||||||||||||||||||||||||||||||||||||||||||||||||||||||||||||||||||||||||||||||||
Dataset | |||||||||||||||||||||||||||||||||||||||||||||||||||||||||||||||||||||||||||||||||||||||||||||||||||
| Dataseries X: | |||||||||||||||||||||||||||||||||||||||||||||||||||||||||||||||||||||||||||||||||||||||||||||||||||
41 39 30 31 34 35 39 34 36 37 38 36 38 39 33 32 36 38 39 32 32 31 39 37 39 41 36 33 33 34 31 27 37 34 34 32 29 36 29 35 37 34 38 35 38 37 38 33 36 38 32 32 32 34 32 37 39 29 37 35 30 38 34 31 34 35 36 30 39 35 38 31 34 38 34 39 37 34 28 37 33 37 35 37 32 33 38 33 29 33 31 36 35 32 29 39 37 35 37 32 38 37 36 32 33 40 38 41 36 43 | |||||||||||||||||||||||||||||||||||||||||||||||||||||||||||||||||||||||||||||||||||||||||||||||||||
| Dataseries Y: | |||||||||||||||||||||||||||||||||||||||||||||||||||||||||||||||||||||||||||||||||||||||||||||||||||
38 32 35 33 37 29 31 36 35 38 31 34 35 38 37 33 32 38 38 32 33 31 38 39 32 32 35 37 33 33 28 32 31 37 30 33 31 33 31 33 32 33 32 33 28 35 39 34 38 32 38 30 33 38 32 32 34 34 36 34 28 34 35 35 31 37 35 27 40 37 36 38 39 41 27 30 37 31 31 27 36 38 37 33 34 31 39 34 32 33 36 32 41 28 30 36 35 31 34 36 36 35 37 28 39 32 35 39 35 42 | |||||||||||||||||||||||||||||||||||||||||||||||||||||||||||||||||||||||||||||||||||||||||||||||||||
Tables (Output of Computation) | |||||||||||||||||||||||||||||||||||||||||||||||||||||||||||||||||||||||||||||||||||||||||||||||||||
| |||||||||||||||||||||||||||||||||||||||||||||||||||||||||||||||||||||||||||||||||||||||||||||||||||
Figures (Output of Computation) | |||||||||||||||||||||||||||||||||||||||||||||||||||||||||||||||||||||||||||||||||||||||||||||||||||
Input Parameters & R Code | |||||||||||||||||||||||||||||||||||||||||||||||||||||||||||||||||||||||||||||||||||||||||||||||||||
| Parameters (Session): | |||||||||||||||||||||||||||||||||||||||||||||||||||||||||||||||||||||||||||||||||||||||||||||||||||
| Parameters (R input): | |||||||||||||||||||||||||||||||||||||||||||||||||||||||||||||||||||||||||||||||||||||||||||||||||||
| R code (references can be found in the software module): | |||||||||||||||||||||||||||||||||||||||||||||||||||||||||||||||||||||||||||||||||||||||||||||||||||
bitmap(file='test1.png') | |||||||||||||||||||||||||||||||||||||||||||||||||||||||||||||||||||||||||||||||||||||||||||||||||||