| Tabulation of Results | ||
| popularity x hands | ||
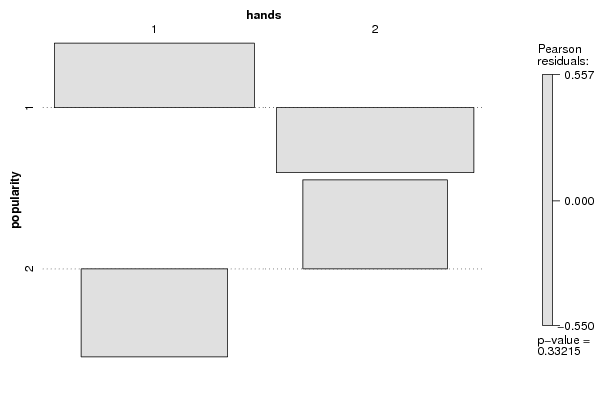
| 1 | 2 | 1 | 53 | 46 | 2 | 24 | 29 |
| Tabulation of Expected Results | ||
| popularity x hands | ||
| 1 | 2 | 1 | 50.15 | 48.85 | 2 | 26.85 | 26.15 |
| Statistical Results | |
| Pearson's Chi-squared test with Yates' continuity correction | |
| Chi Square Statistic | 0.64 |
| Degrees of Freedom | 1 |
| P value | 0.42 |