Free Statistics

of Irreproducible Research!

Author's title

Author*The author of this computation has been verified*
R Software Modulerwasp_multipleregression.wasp
Title produced by softwareMultiple Regression
Date of computationSat, 27 Nov 2010 19:21:25 +0000
Cite this page as followsStatistical Computations at FreeStatistics.org, Office for Research Development and Education, URL https://freestatistics.org/blog/index.php?v=date/2010/Nov/27/t1290885821uy1zqxmn3oxy4ku.htm/, Retrieved Mon, 29 Apr 2024 11:43:42 +0000
Statistical Computations at FreeStatistics.org, Office for Research Development and Education, URL https://freestatistics.org/blog/index.php?pk=102432, Retrieved Mon, 29 Apr 2024 11:43:42 +0000
QR Codes:

Original text written by user:
IsPrivate?No (this computation is public)
User-defined keywords
Estimated Impact127
Family? (F = Feedback message, R = changed R code, M = changed R Module, P = changed Parameters, D = changed Data)
-     [Multiple Regression] [Q1 The Seatbeltlaw] [2007-11-14 19:27:43] [8cd6641b921d30ebe00b648d1481bba0]
- RMPD  [Multiple Regression] [Seatbelt] [2009-11-12 13:54:52] [b98453cac15ba1066b407e146608df68]
-   PD      [Multiple Regression] [ws 8 trend] [2010-11-27 19:21:25] [09489ba95453d3f5c9e6f2eaeda915af] [Current]
Feedback Forum

Post a new message
Dataseries X:
94.6
95.9
104.7
102.8
98.1
113.9
80.9
95.7
113.2
105.9
108.8
102.3
99
100.7
115.5
100.7
109.9
114.6
85.4
100.5
114.8
116.5
112.9
102
106
105.3
118.8
106.1
109.3
117.2
92.5
104.2
112.5
122.4
113.3
100
110.7
112.8
109.8
117.3
109.1
115.9
96
99.8
116.8
115.7
99.4
94.3
91
93.2
103.1
94.1
91.8
102.7
82.6
89.1
104.5
105.1
95.1
88.7
86.3
91.8
111.5
99.7
97.5
111.7
86.2
95.4


Summary of computational transaction
Raw Inputview raw input (R code)
Raw Outputview raw output of R engine
Computing time6 seconds
R Server'George Udny Yule' @ 72.249.76.132

\begin{tabular}{lllllllll}
\hline
Summary of computational transaction \tabularnewline
Raw Input & view raw input (R code)  \tabularnewline
Raw Output & view raw output of R engine  \tabularnewline
Computing time & 6 seconds \tabularnewline
R Server & 'George Udny Yule' @ 72.249.76.132 \tabularnewline
\hline
\end{tabular}
%Source: https://freestatistics.org/blog/index.php?pk=102432&T=0

[TABLE]
[ROW][C]Summary of computational transaction[/C][/ROW]
[ROW][C]Raw Input[/C][C]view raw input (R code) [/C][/ROW]
[ROW][C]Raw Output[/C][C]view raw output of R engine [/C][/ROW]
[ROW][C]Computing time[/C][C]6 seconds[/C][/ROW]
[ROW][C]R Server[/C][C]'George Udny Yule' @ 72.249.76.132[/C][/ROW]
[/TABLE]
Source: https://freestatistics.org/blog/index.php?pk=102432&T=0

Globally Unique Identifier (entire table): ba.freestatistics.org/blog/index.php?pk=102432&T=0

As an alternative you can also use a QR Code:  

The GUIDs for individual cells are displayed in the table below:

Summary of computational transaction
Raw Inputview raw input (R code)
Raw Outputview raw output of R engine
Computing time6 seconds
R Server'George Udny Yule' @ 72.249.76.132


Multiple Linear Regression - Estimated Regression Equation
productie[t] = + 101.158333333333 -0.0403240740740826M1[t] + 2.07907407407409M2[t] + 12.7984722222222M3[t] + 5.78453703703704M4[t] + 5.0539351851852M5[t] + 15.2066666666667M6[t] -10.0906018518518M7[t] + 0.195462962962974M8[t] + 14.5918055555556M9[t] + 15.4545370370371M10[t] + 8.33726851851853M11[t] -0.102731481481481t + e[t]

\begin{tabular}{lllllllll}
\hline
Multiple Linear Regression - Estimated Regression Equation \tabularnewline
productie[t] =  +  101.158333333333 -0.0403240740740826M1[t] +  2.07907407407409M2[t] +  12.7984722222222M3[t] +  5.78453703703704M4[t] +  5.0539351851852M5[t] +  15.2066666666667M6[t] -10.0906018518518M7[t] +  0.195462962962974M8[t] +  14.5918055555556M9[t] +  15.4545370370371M10[t] +  8.33726851851853M11[t] -0.102731481481481t  + e[t] \tabularnewline
\hline
\end{tabular}
%Source: https://freestatistics.org/blog/index.php?pk=102432&T=1

[TABLE]
[ROW][C]Multiple Linear Regression - Estimated Regression Equation[/C][/ROW]
[ROW][C]productie[t] =  +  101.158333333333 -0.0403240740740826M1[t] +  2.07907407407409M2[t] +  12.7984722222222M3[t] +  5.78453703703704M4[t] +  5.0539351851852M5[t] +  15.2066666666667M6[t] -10.0906018518518M7[t] +  0.195462962962974M8[t] +  14.5918055555556M9[t] +  15.4545370370371M10[t] +  8.33726851851853M11[t] -0.102731481481481t  + e[t][/C][/ROW]
[/TABLE]
Source: https://freestatistics.org/blog/index.php?pk=102432&T=1

Globally Unique Identifier (entire table): ba.freestatistics.org/blog/index.php?pk=102432&T=1

As an alternative you can also use a QR Code:  

The GUIDs for individual cells are displayed in the table below:

Multiple Linear Regression - Estimated Regression Equation
productie[t] = + 101.158333333333 -0.0403240740740826M1[t] + 2.07907407407409M2[t] + 12.7984722222222M3[t] + 5.78453703703704M4[t] + 5.0539351851852M5[t] + 15.2066666666667M6[t] -10.0906018518518M7[t] + 0.195462962962974M8[t] + 14.5918055555556M9[t] + 15.4545370370371M10[t] + 8.33726851851853M11[t] -0.102731481481481t + e[t]


Multiple Linear Regression - Ordinary Least Squares
VariableParameterS.D.T-STATH0: parameter = 02-tail p-value1-tail p-value
(Intercept)101.1583333333333.32336430.438500
M1-0.04032407407408264.030084-0.010.9920530.496026
M22.079074074074094.0281810.51610.6078310.303915
M312.79847222222224.0266993.17840.0024310.001216
M45.784537037037044.0256411.43690.1564040.078202
M55.05393518518524.0250061.25560.2145570.107278
M615.20666666666674.0247943.77820.000390.000195
M7-10.09060185185184.025006-2.5070.0151610.00758
M80.1954629629629744.0256410.04860.961450.480725
M914.59180555555564.2055853.46960.0010210.00051
M1015.45453703703714.2045713.67570.000540.00027
M118.337268518518534.2039631.98320.0523480.026174
t-0.1027314814814810.041285-2.48840.0158910.007945

\begin{tabular}{lllllllll}
\hline
Multiple Linear Regression - Ordinary Least Squares \tabularnewline
Variable & Parameter & S.D. & T-STATH0: parameter = 0 & 2-tail p-value & 1-tail p-value \tabularnewline
(Intercept) & 101.158333333333 & 3.323364 & 30.4385 & 0 & 0 \tabularnewline
M1 & -0.0403240740740826 & 4.030084 & -0.01 & 0.992053 & 0.496026 \tabularnewline
M2 & 2.07907407407409 & 4.028181 & 0.5161 & 0.607831 & 0.303915 \tabularnewline
M3 & 12.7984722222222 & 4.026699 & 3.1784 & 0.002431 & 0.001216 \tabularnewline
M4 & 5.78453703703704 & 4.025641 & 1.4369 & 0.156404 & 0.078202 \tabularnewline
M5 & 5.0539351851852 & 4.025006 & 1.2556 & 0.214557 & 0.107278 \tabularnewline
M6 & 15.2066666666667 & 4.024794 & 3.7782 & 0.00039 & 0.000195 \tabularnewline
M7 & -10.0906018518518 & 4.025006 & -2.507 & 0.015161 & 0.00758 \tabularnewline
M8 & 0.195462962962974 & 4.025641 & 0.0486 & 0.96145 & 0.480725 \tabularnewline
M9 & 14.5918055555556 & 4.205585 & 3.4696 & 0.001021 & 0.00051 \tabularnewline
M10 & 15.4545370370371 & 4.204571 & 3.6757 & 0.00054 & 0.00027 \tabularnewline
M11 & 8.33726851851853 & 4.203963 & 1.9832 & 0.052348 & 0.026174 \tabularnewline
t & -0.102731481481481 & 0.041285 & -2.4884 & 0.015891 & 0.007945 \tabularnewline
\hline
\end{tabular}
%Source: https://freestatistics.org/blog/index.php?pk=102432&T=2

[TABLE]
[ROW][C]Multiple Linear Regression - Ordinary Least Squares[/C][/ROW]
[ROW][C]Variable[/C][C]Parameter[/C][C]S.D.[/C][C]T-STATH0: parameter = 0[/C][C]2-tail p-value[/C][C]1-tail p-value[/C][/ROW]
[ROW][C](Intercept)[/C][C]101.158333333333[/C][C]3.323364[/C][C]30.4385[/C][C]0[/C][C]0[/C][/ROW]
[ROW][C]M1[/C][C]-0.0403240740740826[/C][C]4.030084[/C][C]-0.01[/C][C]0.992053[/C][C]0.496026[/C][/ROW]
[ROW][C]M2[/C][C]2.07907407407409[/C][C]4.028181[/C][C]0.5161[/C][C]0.607831[/C][C]0.303915[/C][/ROW]
[ROW][C]M3[/C][C]12.7984722222222[/C][C]4.026699[/C][C]3.1784[/C][C]0.002431[/C][C]0.001216[/C][/ROW]
[ROW][C]M4[/C][C]5.78453703703704[/C][C]4.025641[/C][C]1.4369[/C][C]0.156404[/C][C]0.078202[/C][/ROW]
[ROW][C]M5[/C][C]5.0539351851852[/C][C]4.025006[/C][C]1.2556[/C][C]0.214557[/C][C]0.107278[/C][/ROW]
[ROW][C]M6[/C][C]15.2066666666667[/C][C]4.024794[/C][C]3.7782[/C][C]0.00039[/C][C]0.000195[/C][/ROW]
[ROW][C]M7[/C][C]-10.0906018518518[/C][C]4.025006[/C][C]-2.507[/C][C]0.015161[/C][C]0.00758[/C][/ROW]
[ROW][C]M8[/C][C]0.195462962962974[/C][C]4.025641[/C][C]0.0486[/C][C]0.96145[/C][C]0.480725[/C][/ROW]
[ROW][C]M9[/C][C]14.5918055555556[/C][C]4.205585[/C][C]3.4696[/C][C]0.001021[/C][C]0.00051[/C][/ROW]
[ROW][C]M10[/C][C]15.4545370370371[/C][C]4.204571[/C][C]3.6757[/C][C]0.00054[/C][C]0.00027[/C][/ROW]
[ROW][C]M11[/C][C]8.33726851851853[/C][C]4.203963[/C][C]1.9832[/C][C]0.052348[/C][C]0.026174[/C][/ROW]
[ROW][C]t[/C][C]-0.102731481481481[/C][C]0.041285[/C][C]-2.4884[/C][C]0.015891[/C][C]0.007945[/C][/ROW]
[/TABLE]
Source: https://freestatistics.org/blog/index.php?pk=102432&T=2

Globally Unique Identifier (entire table): ba.freestatistics.org/blog/index.php?pk=102432&T=2

As an alternative you can also use a QR Code:  

The GUIDs for individual cells are displayed in the table below:

Multiple Linear Regression - Ordinary Least Squares
VariableParameterS.D.T-STATH0: parameter = 02-tail p-value1-tail p-value
(Intercept)101.1583333333333.32336430.438500
M1-0.04032407407408264.030084-0.010.9920530.496026
M22.079074074074094.0281810.51610.6078310.303915
M312.79847222222224.0266993.17840.0024310.001216
M45.784537037037044.0256411.43690.1564040.078202
M55.05393518518524.0250061.25560.2145570.107278
M615.20666666666674.0247943.77820.000390.000195
M7-10.09060185185184.025006-2.5070.0151610.00758
M80.1954629629629744.0256410.04860.961450.480725
M914.59180555555564.2055853.46960.0010210.00051
M1015.45453703703714.2045713.67570.000540.00027
M118.337268518518534.2039631.98320.0523480.026174
t-0.1027314814814810.041285-2.48840.0158910.007945


Multiple Linear Regression - Regression Statistics
Multiple R0.79604363761988
R-squared0.63368547299509
Adjusted R-squared0.553762303466746
F-TEST (value)7.92868296808923
F-TEST (DF numerator)12
F-TEST (DF denominator)55
p-value2.51533024409056e-08
Multiple Linear Regression - Residual Statistics
Residual Standard Deviation6.64672889852633
Sum Squared Residuals2429.84527777778

\begin{tabular}{lllllllll}
\hline
Multiple Linear Regression - Regression Statistics \tabularnewline
Multiple R & 0.79604363761988 \tabularnewline
R-squared & 0.63368547299509 \tabularnewline
Adjusted R-squared & 0.553762303466746 \tabularnewline
F-TEST (value) & 7.92868296808923 \tabularnewline
F-TEST (DF numerator) & 12 \tabularnewline
F-TEST (DF denominator) & 55 \tabularnewline
p-value & 2.51533024409056e-08 \tabularnewline
Multiple Linear Regression - Residual Statistics \tabularnewline
Residual Standard Deviation & 6.64672889852633 \tabularnewline
Sum Squared Residuals & 2429.84527777778 \tabularnewline
\hline
\end{tabular}
%Source: https://freestatistics.org/blog/index.php?pk=102432&T=3

[TABLE]
[ROW][C]Multiple Linear Regression - Regression Statistics[/C][/ROW]
[ROW][C]Multiple R[/C][C]0.79604363761988[/C][/ROW]
[ROW][C]R-squared[/C][C]0.63368547299509[/C][/ROW]
[ROW][C]Adjusted R-squared[/C][C]0.553762303466746[/C][/ROW]
[ROW][C]F-TEST (value)[/C][C]7.92868296808923[/C][/ROW]
[ROW][C]F-TEST (DF numerator)[/C][C]12[/C][/ROW]
[ROW][C]F-TEST (DF denominator)[/C][C]55[/C][/ROW]
[ROW][C]p-value[/C][C]2.51533024409056e-08[/C][/ROW]
[ROW][C]Multiple Linear Regression - Residual Statistics[/C][/ROW]
[ROW][C]Residual Standard Deviation[/C][C]6.64672889852633[/C][/ROW]
[ROW][C]Sum Squared Residuals[/C][C]2429.84527777778[/C][/ROW]
[/TABLE]
Source: https://freestatistics.org/blog/index.php?pk=102432&T=3

Globally Unique Identifier (entire table): ba.freestatistics.org/blog/index.php?pk=102432&T=3

As an alternative you can also use a QR Code:  

The GUIDs for individual cells are displayed in the table below:

Multiple Linear Regression - Regression Statistics
Multiple R0.79604363761988
R-squared0.63368547299509
Adjusted R-squared0.553762303466746
F-TEST (value)7.92868296808923
F-TEST (DF numerator)12
F-TEST (DF denominator)55
p-value2.51533024409056e-08
Multiple Linear Regression - Residual Statistics
Residual Standard Deviation6.64672889852633
Sum Squared Residuals2429.84527777778


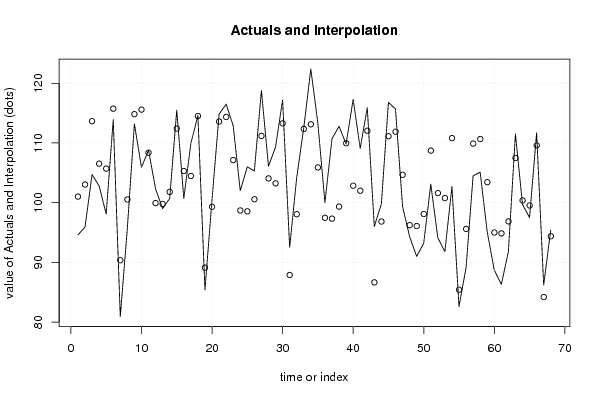
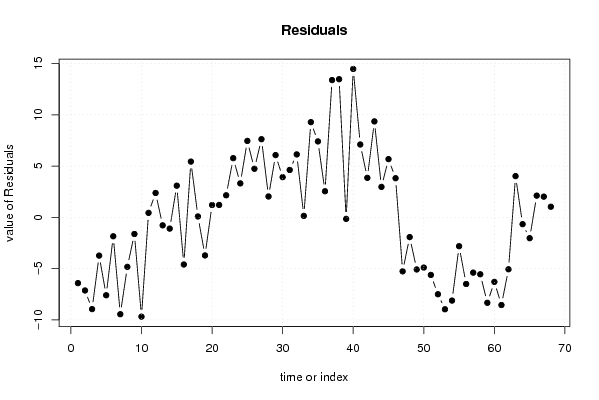
Multiple Linear Regression - Actuals, Interpolation, and Residuals
Time or IndexActualsInterpolationForecastResidualsPrediction Error
194.6101.015277777778-6.41527777777786
295.9103.031944444444-7.13194444444444
3104.7113.648611111111-8.9486111111111
4102.8106.531944444444-3.73194444444445
598.1105.698611111111-7.59861111111111
6113.9115.748611111111-1.84861111111112
780.990.348611111111-9.44861111111107
895.7100.531944444444-4.83194444444445
9113.2114.825555555556-1.62555555555555
10105.9115.585555555556-9.68555555555554
11108.8108.3655555555560.434444444444428
12102.399.92555555555552.37444444444445
139999.7825-0.782499999999983
14100.7101.799166666667-1.09916666666667
15115.5112.4158333333333.08416666666667
16100.7105.299166666667-4.59916666666666
17109.9104.4658333333335.43416666666668
18114.6114.5158333333330.084166666666662
1985.489.1158333333333-3.71583333333334
20100.599.29916666666671.20083333333333
21114.8113.5927777777781.20722222222222
22116.5114.3527777777782.14722222222222
23112.9107.1327777777785.76722222222223
2410298.69277777777783.30722222222223
2510698.54972222222227.4502777777778
26105.3100.5663888888894.7336111111111
27118.8111.1830555555567.61694444444444
28106.1104.0663888888892.03361111111111
29109.3103.2330555555566.06694444444444
30117.2113.2830555555563.91694444444445
3192.587.88305555555564.61694444444444
32104.298.06638888888896.13361111111111
33112.5112.360.14
34122.4113.129.28
35113.3105.97.4
3610097.462.54000000000001
37110.797.316944444444413.3830555555556
38112.899.333611111111113.4663888888889
39109.8109.950277777778-0.150277777777779
40117.3102.83361111111114.4663888888889
41109.1102.0002777777787.09972222222222
42115.9112.0502777777783.84972222222223
439686.65027777777789.34972222222221
4499.896.83361111111112.96638888888889
45116.8111.1272222222225.67277777777777
46115.7111.8872222222223.81277777777778
4799.4104.667222222222-5.26722222222222
4894.396.2272222222222-1.92722222222222
499196.0841666666666-5.08416666666665
5093.298.1008333333333-4.90083333333334
51103.1108.7175-5.61750000000001
5294.1101.600833333333-7.50083333333334
5391.8100.7675-8.9675
54102.7110.8175-8.1175
5582.685.4175-2.81750000000002
5689.195.6008333333333-6.50083333333334
57104.5109.894444444444-5.39444444444445
58105.1110.654444444444-5.55444444444445
5995.1103.434444444444-8.33444444444445
6088.794.9944444444444-6.29444444444443
6186.394.8513888888889-8.55138888888888
6291.896.8680555555556-5.06805555555557
63111.5107.4847222222224.01527777777777
6499.7100.368055555556-0.668055555555555
6597.599.5347222222222-2.03472222222222
66111.7109.5847222222222.11527777777778
6786.284.18472222222222.01527777777777
6895.494.36805555555561.03194444444445

\begin{tabular}{lllllllll}
\hline
Multiple Linear Regression - Actuals, Interpolation, and Residuals \tabularnewline
Time or Index & Actuals & InterpolationForecast & ResidualsPrediction Error \tabularnewline
1 & 94.6 & 101.015277777778 & -6.41527777777786 \tabularnewline
2 & 95.9 & 103.031944444444 & -7.13194444444444 \tabularnewline
3 & 104.7 & 113.648611111111 & -8.9486111111111 \tabularnewline
4 & 102.8 & 106.531944444444 & -3.73194444444445 \tabularnewline
5 & 98.1 & 105.698611111111 & -7.59861111111111 \tabularnewline
6 & 113.9 & 115.748611111111 & -1.84861111111112 \tabularnewline
7 & 80.9 & 90.348611111111 & -9.44861111111107 \tabularnewline
8 & 95.7 & 100.531944444444 & -4.83194444444445 \tabularnewline
9 & 113.2 & 114.825555555556 & -1.62555555555555 \tabularnewline
10 & 105.9 & 115.585555555556 & -9.68555555555554 \tabularnewline
11 & 108.8 & 108.365555555556 & 0.434444444444428 \tabularnewline
12 & 102.3 & 99.9255555555555 & 2.37444444444445 \tabularnewline
13 & 99 & 99.7825 & -0.782499999999983 \tabularnewline
14 & 100.7 & 101.799166666667 & -1.09916666666667 \tabularnewline
15 & 115.5 & 112.415833333333 & 3.08416666666667 \tabularnewline
16 & 100.7 & 105.299166666667 & -4.59916666666666 \tabularnewline
17 & 109.9 & 104.465833333333 & 5.43416666666668 \tabularnewline
18 & 114.6 & 114.515833333333 & 0.084166666666662 \tabularnewline
19 & 85.4 & 89.1158333333333 & -3.71583333333334 \tabularnewline
20 & 100.5 & 99.2991666666667 & 1.20083333333333 \tabularnewline
21 & 114.8 & 113.592777777778 & 1.20722222222222 \tabularnewline
22 & 116.5 & 114.352777777778 & 2.14722222222222 \tabularnewline
23 & 112.9 & 107.132777777778 & 5.76722222222223 \tabularnewline
24 & 102 & 98.6927777777778 & 3.30722222222223 \tabularnewline
25 & 106 & 98.5497222222222 & 7.4502777777778 \tabularnewline
26 & 105.3 & 100.566388888889 & 4.7336111111111 \tabularnewline
27 & 118.8 & 111.183055555556 & 7.61694444444444 \tabularnewline
28 & 106.1 & 104.066388888889 & 2.03361111111111 \tabularnewline
29 & 109.3 & 103.233055555556 & 6.06694444444444 \tabularnewline
30 & 117.2 & 113.283055555556 & 3.91694444444445 \tabularnewline
31 & 92.5 & 87.8830555555556 & 4.61694444444444 \tabularnewline
32 & 104.2 & 98.0663888888889 & 6.13361111111111 \tabularnewline
33 & 112.5 & 112.36 & 0.14 \tabularnewline
34 & 122.4 & 113.12 & 9.28 \tabularnewline
35 & 113.3 & 105.9 & 7.4 \tabularnewline
36 & 100 & 97.46 & 2.54000000000001 \tabularnewline
37 & 110.7 & 97.3169444444444 & 13.3830555555556 \tabularnewline
38 & 112.8 & 99.3336111111111 & 13.4663888888889 \tabularnewline
39 & 109.8 & 109.950277777778 & -0.150277777777779 \tabularnewline
40 & 117.3 & 102.833611111111 & 14.4663888888889 \tabularnewline
41 & 109.1 & 102.000277777778 & 7.09972222222222 \tabularnewline
42 & 115.9 & 112.050277777778 & 3.84972222222223 \tabularnewline
43 & 96 & 86.6502777777778 & 9.34972222222221 \tabularnewline
44 & 99.8 & 96.8336111111111 & 2.96638888888889 \tabularnewline
45 & 116.8 & 111.127222222222 & 5.67277777777777 \tabularnewline
46 & 115.7 & 111.887222222222 & 3.81277777777778 \tabularnewline
47 & 99.4 & 104.667222222222 & -5.26722222222222 \tabularnewline
48 & 94.3 & 96.2272222222222 & -1.92722222222222 \tabularnewline
49 & 91 & 96.0841666666666 & -5.08416666666665 \tabularnewline
50 & 93.2 & 98.1008333333333 & -4.90083333333334 \tabularnewline
51 & 103.1 & 108.7175 & -5.61750000000001 \tabularnewline
52 & 94.1 & 101.600833333333 & -7.50083333333334 \tabularnewline
53 & 91.8 & 100.7675 & -8.9675 \tabularnewline
54 & 102.7 & 110.8175 & -8.1175 \tabularnewline
55 & 82.6 & 85.4175 & -2.81750000000002 \tabularnewline
56 & 89.1 & 95.6008333333333 & -6.50083333333334 \tabularnewline
57 & 104.5 & 109.894444444444 & -5.39444444444445 \tabularnewline
58 & 105.1 & 110.654444444444 & -5.55444444444445 \tabularnewline
59 & 95.1 & 103.434444444444 & -8.33444444444445 \tabularnewline
60 & 88.7 & 94.9944444444444 & -6.29444444444443 \tabularnewline
61 & 86.3 & 94.8513888888889 & -8.55138888888888 \tabularnewline
62 & 91.8 & 96.8680555555556 & -5.06805555555557 \tabularnewline
63 & 111.5 & 107.484722222222 & 4.01527777777777 \tabularnewline
64 & 99.7 & 100.368055555556 & -0.668055555555555 \tabularnewline
65 & 97.5 & 99.5347222222222 & -2.03472222222222 \tabularnewline
66 & 111.7 & 109.584722222222 & 2.11527777777778 \tabularnewline
67 & 86.2 & 84.1847222222222 & 2.01527777777777 \tabularnewline
68 & 95.4 & 94.3680555555556 & 1.03194444444445 \tabularnewline
\hline
\end{tabular}
%Source: https://freestatistics.org/blog/index.php?pk=102432&T=4

[TABLE]
[ROW][C]Multiple Linear Regression - Actuals, Interpolation, and Residuals[/C][/ROW]
[ROW][C]Time or Index[/C][C]Actuals[/C][C]InterpolationForecast[/C][C]ResidualsPrediction Error[/C][/ROW]
[ROW][C]1[/C][C]94.6[/C][C]101.015277777778[/C][C]-6.41527777777786[/C][/ROW]
[ROW][C]2[/C][C]95.9[/C][C]103.031944444444[/C][C]-7.13194444444444[/C][/ROW]
[ROW][C]3[/C][C]104.7[/C][C]113.648611111111[/C][C]-8.9486111111111[/C][/ROW]
[ROW][C]4[/C][C]102.8[/C][C]106.531944444444[/C][C]-3.73194444444445[/C][/ROW]
[ROW][C]5[/C][C]98.1[/C][C]105.698611111111[/C][C]-7.59861111111111[/C][/ROW]
[ROW][C]6[/C][C]113.9[/C][C]115.748611111111[/C][C]-1.84861111111112[/C][/ROW]
[ROW][C]7[/C][C]80.9[/C][C]90.348611111111[/C][C]-9.44861111111107[/C][/ROW]
[ROW][C]8[/C][C]95.7[/C][C]100.531944444444[/C][C]-4.83194444444445[/C][/ROW]
[ROW][C]9[/C][C]113.2[/C][C]114.825555555556[/C][C]-1.62555555555555[/C][/ROW]
[ROW][C]10[/C][C]105.9[/C][C]115.585555555556[/C][C]-9.68555555555554[/C][/ROW]
[ROW][C]11[/C][C]108.8[/C][C]108.365555555556[/C][C]0.434444444444428[/C][/ROW]
[ROW][C]12[/C][C]102.3[/C][C]99.9255555555555[/C][C]2.37444444444445[/C][/ROW]
[ROW][C]13[/C][C]99[/C][C]99.7825[/C][C]-0.782499999999983[/C][/ROW]
[ROW][C]14[/C][C]100.7[/C][C]101.799166666667[/C][C]-1.09916666666667[/C][/ROW]
[ROW][C]15[/C][C]115.5[/C][C]112.415833333333[/C][C]3.08416666666667[/C][/ROW]
[ROW][C]16[/C][C]100.7[/C][C]105.299166666667[/C][C]-4.59916666666666[/C][/ROW]
[ROW][C]17[/C][C]109.9[/C][C]104.465833333333[/C][C]5.43416666666668[/C][/ROW]
[ROW][C]18[/C][C]114.6[/C][C]114.515833333333[/C][C]0.084166666666662[/C][/ROW]
[ROW][C]19[/C][C]85.4[/C][C]89.1158333333333[/C][C]-3.71583333333334[/C][/ROW]
[ROW][C]20[/C][C]100.5[/C][C]99.2991666666667[/C][C]1.20083333333333[/C][/ROW]
[ROW][C]21[/C][C]114.8[/C][C]113.592777777778[/C][C]1.20722222222222[/C][/ROW]
[ROW][C]22[/C][C]116.5[/C][C]114.352777777778[/C][C]2.14722222222222[/C][/ROW]
[ROW][C]23[/C][C]112.9[/C][C]107.132777777778[/C][C]5.76722222222223[/C][/ROW]
[ROW][C]24[/C][C]102[/C][C]98.6927777777778[/C][C]3.30722222222223[/C][/ROW]
[ROW][C]25[/C][C]106[/C][C]98.5497222222222[/C][C]7.4502777777778[/C][/ROW]
[ROW][C]26[/C][C]105.3[/C][C]100.566388888889[/C][C]4.7336111111111[/C][/ROW]
[ROW][C]27[/C][C]118.8[/C][C]111.183055555556[/C][C]7.61694444444444[/C][/ROW]
[ROW][C]28[/C][C]106.1[/C][C]104.066388888889[/C][C]2.03361111111111[/C][/ROW]
[ROW][C]29[/C][C]109.3[/C][C]103.233055555556[/C][C]6.06694444444444[/C][/ROW]
[ROW][C]30[/C][C]117.2[/C][C]113.283055555556[/C][C]3.91694444444445[/C][/ROW]
[ROW][C]31[/C][C]92.5[/C][C]87.8830555555556[/C][C]4.61694444444444[/C][/ROW]
[ROW][C]32[/C][C]104.2[/C][C]98.0663888888889[/C][C]6.13361111111111[/C][/ROW]
[ROW][C]33[/C][C]112.5[/C][C]112.36[/C][C]0.14[/C][/ROW]
[ROW][C]34[/C][C]122.4[/C][C]113.12[/C][C]9.28[/C][/ROW]
[ROW][C]35[/C][C]113.3[/C][C]105.9[/C][C]7.4[/C][/ROW]
[ROW][C]36[/C][C]100[/C][C]97.46[/C][C]2.54000000000001[/C][/ROW]
[ROW][C]37[/C][C]110.7[/C][C]97.3169444444444[/C][C]13.3830555555556[/C][/ROW]
[ROW][C]38[/C][C]112.8[/C][C]99.3336111111111[/C][C]13.4663888888889[/C][/ROW]
[ROW][C]39[/C][C]109.8[/C][C]109.950277777778[/C][C]-0.150277777777779[/C][/ROW]
[ROW][C]40[/C][C]117.3[/C][C]102.833611111111[/C][C]14.4663888888889[/C][/ROW]
[ROW][C]41[/C][C]109.1[/C][C]102.000277777778[/C][C]7.09972222222222[/C][/ROW]
[ROW][C]42[/C][C]115.9[/C][C]112.050277777778[/C][C]3.84972222222223[/C][/ROW]
[ROW][C]43[/C][C]96[/C][C]86.6502777777778[/C][C]9.34972222222221[/C][/ROW]
[ROW][C]44[/C][C]99.8[/C][C]96.8336111111111[/C][C]2.96638888888889[/C][/ROW]
[ROW][C]45[/C][C]116.8[/C][C]111.127222222222[/C][C]5.67277777777777[/C][/ROW]
[ROW][C]46[/C][C]115.7[/C][C]111.887222222222[/C][C]3.81277777777778[/C][/ROW]
[ROW][C]47[/C][C]99.4[/C][C]104.667222222222[/C][C]-5.26722222222222[/C][/ROW]
[ROW][C]48[/C][C]94.3[/C][C]96.2272222222222[/C][C]-1.92722222222222[/C][/ROW]
[ROW][C]49[/C][C]91[/C][C]96.0841666666666[/C][C]-5.08416666666665[/C][/ROW]
[ROW][C]50[/C][C]93.2[/C][C]98.1008333333333[/C][C]-4.90083333333334[/C][/ROW]
[ROW][C]51[/C][C]103.1[/C][C]108.7175[/C][C]-5.61750000000001[/C][/ROW]
[ROW][C]52[/C][C]94.1[/C][C]101.600833333333[/C][C]-7.50083333333334[/C][/ROW]
[ROW][C]53[/C][C]91.8[/C][C]100.7675[/C][C]-8.9675[/C][/ROW]
[ROW][C]54[/C][C]102.7[/C][C]110.8175[/C][C]-8.1175[/C][/ROW]
[ROW][C]55[/C][C]82.6[/C][C]85.4175[/C][C]-2.81750000000002[/C][/ROW]
[ROW][C]56[/C][C]89.1[/C][C]95.6008333333333[/C][C]-6.50083333333334[/C][/ROW]
[ROW][C]57[/C][C]104.5[/C][C]109.894444444444[/C][C]-5.39444444444445[/C][/ROW]
[ROW][C]58[/C][C]105.1[/C][C]110.654444444444[/C][C]-5.55444444444445[/C][/ROW]
[ROW][C]59[/C][C]95.1[/C][C]103.434444444444[/C][C]-8.33444444444445[/C][/ROW]
[ROW][C]60[/C][C]88.7[/C][C]94.9944444444444[/C][C]-6.29444444444443[/C][/ROW]
[ROW][C]61[/C][C]86.3[/C][C]94.8513888888889[/C][C]-8.55138888888888[/C][/ROW]
[ROW][C]62[/C][C]91.8[/C][C]96.8680555555556[/C][C]-5.06805555555557[/C][/ROW]
[ROW][C]63[/C][C]111.5[/C][C]107.484722222222[/C][C]4.01527777777777[/C][/ROW]
[ROW][C]64[/C][C]99.7[/C][C]100.368055555556[/C][C]-0.668055555555555[/C][/ROW]
[ROW][C]65[/C][C]97.5[/C][C]99.5347222222222[/C][C]-2.03472222222222[/C][/ROW]
[ROW][C]66[/C][C]111.7[/C][C]109.584722222222[/C][C]2.11527777777778[/C][/ROW]
[ROW][C]67[/C][C]86.2[/C][C]84.1847222222222[/C][C]2.01527777777777[/C][/ROW]
[ROW][C]68[/C][C]95.4[/C][C]94.3680555555556[/C][C]1.03194444444445[/C][/ROW]
[/TABLE]
Source: https://freestatistics.org/blog/index.php?pk=102432&T=4

Globally Unique Identifier (entire table): ba.freestatistics.org/blog/index.php?pk=102432&T=4

As an alternative you can also use a QR Code:  

The GUIDs for individual cells are displayed in the table below:

Multiple Linear Regression - Actuals, Interpolation, and Residuals
Time or IndexActualsInterpolationForecastResidualsPrediction Error
194.6101.015277777778-6.41527777777786
295.9103.031944444444-7.13194444444444
3104.7113.648611111111-8.9486111111111
4102.8106.531944444444-3.73194444444445
598.1105.698611111111-7.59861111111111
6113.9115.748611111111-1.84861111111112
780.990.348611111111-9.44861111111107
895.7100.531944444444-4.83194444444445
9113.2114.825555555556-1.62555555555555
10105.9115.585555555556-9.68555555555554
11108.8108.3655555555560.434444444444428
12102.399.92555555555552.37444444444445
139999.7825-0.782499999999983
14100.7101.799166666667-1.09916666666667
15115.5112.4158333333333.08416666666667
16100.7105.299166666667-4.59916666666666
17109.9104.4658333333335.43416666666668
18114.6114.5158333333330.084166666666662
1985.489.1158333333333-3.71583333333334
20100.599.29916666666671.20083333333333
21114.8113.5927777777781.20722222222222
22116.5114.3527777777782.14722222222222
23112.9107.1327777777785.76722222222223
2410298.69277777777783.30722222222223
2510698.54972222222227.4502777777778
26105.3100.5663888888894.7336111111111
27118.8111.1830555555567.61694444444444
28106.1104.0663888888892.03361111111111
29109.3103.2330555555566.06694444444444
30117.2113.2830555555563.91694444444445
3192.587.88305555555564.61694444444444
32104.298.06638888888896.13361111111111
33112.5112.360.14
34122.4113.129.28
35113.3105.97.4
3610097.462.54000000000001
37110.797.316944444444413.3830555555556
38112.899.333611111111113.4663888888889
39109.8109.950277777778-0.150277777777779
40117.3102.83361111111114.4663888888889
41109.1102.0002777777787.09972222222222
42115.9112.0502777777783.84972222222223
439686.65027777777789.34972222222221
4499.896.83361111111112.96638888888889
45116.8111.1272222222225.67277777777777
46115.7111.8872222222223.81277777777778
4799.4104.667222222222-5.26722222222222
4894.396.2272222222222-1.92722222222222
499196.0841666666666-5.08416666666665
5093.298.1008333333333-4.90083333333334
51103.1108.7175-5.61750000000001
5294.1101.600833333333-7.50083333333334
5391.8100.7675-8.9675
54102.7110.8175-8.1175
5582.685.4175-2.81750000000002
5689.195.6008333333333-6.50083333333334
57104.5109.894444444444-5.39444444444445
58105.1110.654444444444-5.55444444444445
5995.1103.434444444444-8.33444444444445
6088.794.9944444444444-6.29444444444443
6186.394.8513888888889-8.55138888888888
6291.896.8680555555556-5.06805555555557
63111.5107.4847222222224.01527777777777
6499.7100.368055555556-0.668055555555555
6597.599.5347222222222-2.03472222222222
66111.7109.5847222222222.11527777777778
6786.284.18472222222222.01527777777777
6895.494.36805555555561.03194444444445


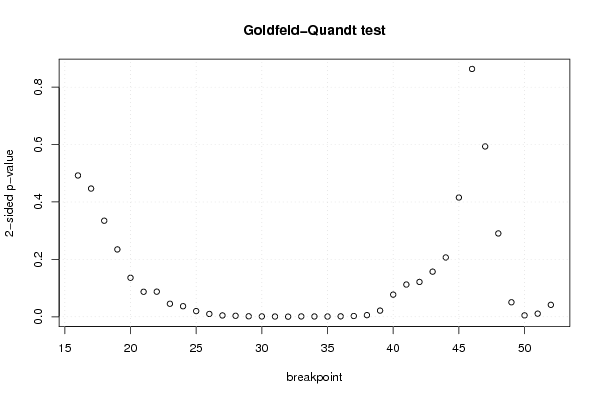
Goldfeld-Quandt test for Heteroskedasticity
p-valuesAlternative Hypothesis
breakpoint indexgreater2-sidedless
160.2461569749630740.4923139499261480.753843025036926
170.2233153450943320.4466306901886640.776684654905668
180.1673279973865930.3346559947731860.832672002613407
190.1172968949842650.2345937899685300.882703105015735
200.06790454312881180.1358090862576240.932095456871188
210.04352106254279600.08704212508559210.956478937457204
220.04370943321530110.08741886643060230.956290566784699
230.02263078698230820.04526157396461630.977369213017692
240.01836402791859510.03672805583719010.981635972081405
250.0098726139737090.0197452279474180.99012738602629
260.004861556888027090.009723113776054180.995138443111973
270.002274893765934950.00454978753186990.997725106234065
280.001675914988902710.003351829977805420.998324085011097
290.0007897614786474060.001579522957294810.999210238521353
300.000561249314937810.001122498629875620.999438750685062
310.0003834948032188730.0007669896064377450.999616505196781
320.0001630990663025210.0003261981326050410.999836900933697
330.0005892210289191010.001178442057838200.99941077897108
340.0004880569999000190.0009761139998000380.9995119430001
350.0003973808031262730.0007947616062525460.999602619196874
360.0007268071945964510.001453614389192900.999273192805403
370.001273847514586870.002547695029173750.998726152485413
380.00278965508421610.00557931016843220.997210344915784
390.01068302975444930.02136605950889870.98931697024555
400.03851836532903770.07703673065807550.961481634670962
410.05611332751225730.1122266550245150.943886672487743
420.06064499617001730.1212899923400350.939355003829983
430.07854893479418310.1570978695883660.921451065205817
440.1032929853202780.2065859706405560.896707014679722
450.2077316103811160.4154632207622310.792268389618884
460.4317383980456030.8634767960912060.568261601954397
470.7033157066247680.5933685867504630.296684293375232
480.854859684098870.2902806318022600.145140315901130
490.9747990087301630.0504019825396740.025200991269837
500.9976109794769010.004778041046197380.00238902052309869
510.9946582889686830.0106834220626330.0053417110313165
520.9792389398611710.04152212027765770.0207610601388288

\begin{tabular}{lllllllll}
\hline
Goldfeld-Quandt test for Heteroskedasticity \tabularnewline
p-values & Alternative Hypothesis \tabularnewline
breakpoint index & greater & 2-sided & less \tabularnewline
16 & 0.246156974963074 & 0.492313949926148 & 0.753843025036926 \tabularnewline
17 & 0.223315345094332 & 0.446630690188664 & 0.776684654905668 \tabularnewline
18 & 0.167327997386593 & 0.334655994773186 & 0.832672002613407 \tabularnewline
19 & 0.117296894984265 & 0.234593789968530 & 0.882703105015735 \tabularnewline
20 & 0.0679045431288118 & 0.135809086257624 & 0.932095456871188 \tabularnewline
21 & 0.0435210625427960 & 0.0870421250855921 & 0.956478937457204 \tabularnewline
22 & 0.0437094332153011 & 0.0874188664306023 & 0.956290566784699 \tabularnewline
23 & 0.0226307869823082 & 0.0452615739646163 & 0.977369213017692 \tabularnewline
24 & 0.0183640279185951 & 0.0367280558371901 & 0.981635972081405 \tabularnewline
25 & 0.009872613973709 & 0.019745227947418 & 0.99012738602629 \tabularnewline
26 & 0.00486155688802709 & 0.00972311377605418 & 0.995138443111973 \tabularnewline
27 & 0.00227489376593495 & 0.0045497875318699 & 0.997725106234065 \tabularnewline
28 & 0.00167591498890271 & 0.00335182997780542 & 0.998324085011097 \tabularnewline
29 & 0.000789761478647406 & 0.00157952295729481 & 0.999210238521353 \tabularnewline
30 & 0.00056124931493781 & 0.00112249862987562 & 0.999438750685062 \tabularnewline
31 & 0.000383494803218873 & 0.000766989606437745 & 0.999616505196781 \tabularnewline
32 & 0.000163099066302521 & 0.000326198132605041 & 0.999836900933697 \tabularnewline
33 & 0.000589221028919101 & 0.00117844205783820 & 0.99941077897108 \tabularnewline
34 & 0.000488056999900019 & 0.000976113999800038 & 0.9995119430001 \tabularnewline
35 & 0.000397380803126273 & 0.000794761606252546 & 0.999602619196874 \tabularnewline
36 & 0.000726807194596451 & 0.00145361438919290 & 0.999273192805403 \tabularnewline
37 & 0.00127384751458687 & 0.00254769502917375 & 0.998726152485413 \tabularnewline
38 & 0.0027896550842161 & 0.0055793101684322 & 0.997210344915784 \tabularnewline
39 & 0.0106830297544493 & 0.0213660595088987 & 0.98931697024555 \tabularnewline
40 & 0.0385183653290377 & 0.0770367306580755 & 0.961481634670962 \tabularnewline
41 & 0.0561133275122573 & 0.112226655024515 & 0.943886672487743 \tabularnewline
42 & 0.0606449961700173 & 0.121289992340035 & 0.939355003829983 \tabularnewline
43 & 0.0785489347941831 & 0.157097869588366 & 0.921451065205817 \tabularnewline
44 & 0.103292985320278 & 0.206585970640556 & 0.896707014679722 \tabularnewline
45 & 0.207731610381116 & 0.415463220762231 & 0.792268389618884 \tabularnewline
46 & 0.431738398045603 & 0.863476796091206 & 0.568261601954397 \tabularnewline
47 & 0.703315706624768 & 0.593368586750463 & 0.296684293375232 \tabularnewline
48 & 0.85485968409887 & 0.290280631802260 & 0.145140315901130 \tabularnewline
49 & 0.974799008730163 & 0.050401982539674 & 0.025200991269837 \tabularnewline
50 & 0.997610979476901 & 0.00477804104619738 & 0.00238902052309869 \tabularnewline
51 & 0.994658288968683 & 0.010683422062633 & 0.0053417110313165 \tabularnewline
52 & 0.979238939861171 & 0.0415221202776577 & 0.0207610601388288 \tabularnewline
\hline
\end{tabular}
%Source: https://freestatistics.org/blog/index.php?pk=102432&T=5

[TABLE]
[ROW][C]Goldfeld-Quandt test for Heteroskedasticity[/C][/ROW]
[ROW][C]p-values[/C][C]Alternative Hypothesis[/C][/ROW]
[ROW][C]breakpoint index[/C][C]greater[/C][C]2-sided[/C][C]less[/C][/ROW]
[ROW][C]16[/C][C]0.246156974963074[/C][C]0.492313949926148[/C][C]0.753843025036926[/C][/ROW]
[ROW][C]17[/C][C]0.223315345094332[/C][C]0.446630690188664[/C][C]0.776684654905668[/C][/ROW]
[ROW][C]18[/C][C]0.167327997386593[/C][C]0.334655994773186[/C][C]0.832672002613407[/C][/ROW]
[ROW][C]19[/C][C]0.117296894984265[/C][C]0.234593789968530[/C][C]0.882703105015735[/C][/ROW]
[ROW][C]20[/C][C]0.0679045431288118[/C][C]0.135809086257624[/C][C]0.932095456871188[/C][/ROW]
[ROW][C]21[/C][C]0.0435210625427960[/C][C]0.0870421250855921[/C][C]0.956478937457204[/C][/ROW]
[ROW][C]22[/C][C]0.0437094332153011[/C][C]0.0874188664306023[/C][C]0.956290566784699[/C][/ROW]
[ROW][C]23[/C][C]0.0226307869823082[/C][C]0.0452615739646163[/C][C]0.977369213017692[/C][/ROW]
[ROW][C]24[/C][C]0.0183640279185951[/C][C]0.0367280558371901[/C][C]0.981635972081405[/C][/ROW]
[ROW][C]25[/C][C]0.009872613973709[/C][C]0.019745227947418[/C][C]0.99012738602629[/C][/ROW]
[ROW][C]26[/C][C]0.00486155688802709[/C][C]0.00972311377605418[/C][C]0.995138443111973[/C][/ROW]
[ROW][C]27[/C][C]0.00227489376593495[/C][C]0.0045497875318699[/C][C]0.997725106234065[/C][/ROW]
[ROW][C]28[/C][C]0.00167591498890271[/C][C]0.00335182997780542[/C][C]0.998324085011097[/C][/ROW]
[ROW][C]29[/C][C]0.000789761478647406[/C][C]0.00157952295729481[/C][C]0.999210238521353[/C][/ROW]
[ROW][C]30[/C][C]0.00056124931493781[/C][C]0.00112249862987562[/C][C]0.999438750685062[/C][/ROW]
[ROW][C]31[/C][C]0.000383494803218873[/C][C]0.000766989606437745[/C][C]0.999616505196781[/C][/ROW]
[ROW][C]32[/C][C]0.000163099066302521[/C][C]0.000326198132605041[/C][C]0.999836900933697[/C][/ROW]
[ROW][C]33[/C][C]0.000589221028919101[/C][C]0.00117844205783820[/C][C]0.99941077897108[/C][/ROW]
[ROW][C]34[/C][C]0.000488056999900019[/C][C]0.000976113999800038[/C][C]0.9995119430001[/C][/ROW]
[ROW][C]35[/C][C]0.000397380803126273[/C][C]0.000794761606252546[/C][C]0.999602619196874[/C][/ROW]
[ROW][C]36[/C][C]0.000726807194596451[/C][C]0.00145361438919290[/C][C]0.999273192805403[/C][/ROW]
[ROW][C]37[/C][C]0.00127384751458687[/C][C]0.00254769502917375[/C][C]0.998726152485413[/C][/ROW]
[ROW][C]38[/C][C]0.0027896550842161[/C][C]0.0055793101684322[/C][C]0.997210344915784[/C][/ROW]
[ROW][C]39[/C][C]0.0106830297544493[/C][C]0.0213660595088987[/C][C]0.98931697024555[/C][/ROW]
[ROW][C]40[/C][C]0.0385183653290377[/C][C]0.0770367306580755[/C][C]0.961481634670962[/C][/ROW]
[ROW][C]41[/C][C]0.0561133275122573[/C][C]0.112226655024515[/C][C]0.943886672487743[/C][/ROW]
[ROW][C]42[/C][C]0.0606449961700173[/C][C]0.121289992340035[/C][C]0.939355003829983[/C][/ROW]
[ROW][C]43[/C][C]0.0785489347941831[/C][C]0.157097869588366[/C][C]0.921451065205817[/C][/ROW]
[ROW][C]44[/C][C]0.103292985320278[/C][C]0.206585970640556[/C][C]0.896707014679722[/C][/ROW]
[ROW][C]45[/C][C]0.207731610381116[/C][C]0.415463220762231[/C][C]0.792268389618884[/C][/ROW]
[ROW][C]46[/C][C]0.431738398045603[/C][C]0.863476796091206[/C][C]0.568261601954397[/C][/ROW]
[ROW][C]47[/C][C]0.703315706624768[/C][C]0.593368586750463[/C][C]0.296684293375232[/C][/ROW]
[ROW][C]48[/C][C]0.85485968409887[/C][C]0.290280631802260[/C][C]0.145140315901130[/C][/ROW]
[ROW][C]49[/C][C]0.974799008730163[/C][C]0.050401982539674[/C][C]0.025200991269837[/C][/ROW]
[ROW][C]50[/C][C]0.997610979476901[/C][C]0.00477804104619738[/C][C]0.00238902052309869[/C][/ROW]
[ROW][C]51[/C][C]0.994658288968683[/C][C]0.010683422062633[/C][C]0.0053417110313165[/C][/ROW]
[ROW][C]52[/C][C]0.979238939861171[/C][C]0.0415221202776577[/C][C]0.0207610601388288[/C][/ROW]
[/TABLE]
Source: https://freestatistics.org/blog/index.php?pk=102432&T=5

Globally Unique Identifier (entire table): ba.freestatistics.org/blog/index.php?pk=102432&T=5

As an alternative you can also use a QR Code:  

The GUIDs for individual cells are displayed in the table below:

Goldfeld-Quandt test for Heteroskedasticity
p-valuesAlternative Hypothesis
breakpoint indexgreater2-sidedless
160.2461569749630740.4923139499261480.753843025036926
170.2233153450943320.4466306901886640.776684654905668
180.1673279973865930.3346559947731860.832672002613407
190.1172968949842650.2345937899685300.882703105015735
200.06790454312881180.1358090862576240.932095456871188
210.04352106254279600.08704212508559210.956478937457204
220.04370943321530110.08741886643060230.956290566784699
230.02263078698230820.04526157396461630.977369213017692
240.01836402791859510.03672805583719010.981635972081405
250.0098726139737090.0197452279474180.99012738602629
260.004861556888027090.009723113776054180.995138443111973
270.002274893765934950.00454978753186990.997725106234065
280.001675914988902710.003351829977805420.998324085011097
290.0007897614786474060.001579522957294810.999210238521353
300.000561249314937810.001122498629875620.999438750685062
310.0003834948032188730.0007669896064377450.999616505196781
320.0001630990663025210.0003261981326050410.999836900933697
330.0005892210289191010.001178442057838200.99941077897108
340.0004880569999000190.0009761139998000380.9995119430001
350.0003973808031262730.0007947616062525460.999602619196874
360.0007268071945964510.001453614389192900.999273192805403
370.001273847514586870.002547695029173750.998726152485413
380.00278965508421610.00557931016843220.997210344915784
390.01068302975444930.02136605950889870.98931697024555
400.03851836532903770.07703673065807550.961481634670962
410.05611332751225730.1122266550245150.943886672487743
420.06064499617001730.1212899923400350.939355003829983
430.07854893479418310.1570978695883660.921451065205817
440.1032929853202780.2065859706405560.896707014679722
450.2077316103811160.4154632207622310.792268389618884
460.4317383980456030.8634767960912060.568261601954397
470.7033157066247680.5933685867504630.296684293375232
480.854859684098870.2902806318022600.145140315901130
490.9747990087301630.0504019825396740.025200991269837
500.9976109794769010.004778041046197380.00238902052309869
510.9946582889686830.0106834220626330.0053417110313165
520.9792389398611710.04152212027765770.0207610601388288


Meta Analysis of Goldfeld-Quandt test for Heteroskedasticity
Description# significant tests% significant testsOK/NOK
1% type I error level140.378378378378378NOK
5% type I error level200.540540540540541NOK
10% type I error level240.648648648648649NOK

\begin{tabular}{lllllllll}
\hline
Meta Analysis of Goldfeld-Quandt test for Heteroskedasticity \tabularnewline
Description & # significant tests & % significant tests & OK/NOK \tabularnewline
1% type I error level & 14 & 0.378378378378378 & NOK \tabularnewline
5% type I error level & 20 & 0.540540540540541 & NOK \tabularnewline
10% type I error level & 24 & 0.648648648648649 & NOK \tabularnewline
\hline
\end{tabular}
%Source: https://freestatistics.org/blog/index.php?pk=102432&T=6

[TABLE]
[ROW][C]Meta Analysis of Goldfeld-Quandt test for Heteroskedasticity[/C][/ROW]
[ROW][C]Description[/C][C]# significant tests[/C][C]% significant tests[/C][C]OK/NOK[/C][/ROW]
[ROW][C]1% type I error level[/C][C]14[/C][C]0.378378378378378[/C][C]NOK[/C][/ROW]
[ROW][C]5% type I error level[/C][C]20[/C][C]0.540540540540541[/C][C]NOK[/C][/ROW]
[ROW][C]10% type I error level[/C][C]24[/C][C]0.648648648648649[/C][C]NOK[/C][/ROW]
[/TABLE]
Source: https://freestatistics.org/blog/index.php?pk=102432&T=6

Globally Unique Identifier (entire table): ba.freestatistics.org/blog/index.php?pk=102432&T=6

As an alternative you can also use a QR Code:  

The GUIDs for individual cells are displayed in the table below:

Meta Analysis of Goldfeld-Quandt test for Heteroskedasticity
Description# significant tests% significant testsOK/NOK
1% type I error level140.378378378378378NOK
5% type I error level200.540540540540541NOK
10% type I error level240.648648648648649NOK


Parameters (Session):
par1 = 1 ; par2 = Include Monthly Dummies ; par3 = Linear Trend ;
Parameters (R input):
par1 = 1 ; par2 = Include Monthly Dummies ; par3 = Linear Trend ;
R code (references can be found in the software module):
library(lattice)
library(lmtest)
n25 <- 25 #minimum number of obs. for Goldfeld-Quandt test
par1 <- as.numeric(par1)
x <- t(y)
k <- length(x[1,])
n <- length(x[,1])
x1 <- cbind(x[,par1], x[,1:k!=par1])
mycolnames <- c(colnames(x)[par1], colnames(x)[1:k!=par1])
colnames(x1) <- mycolnames #colnames(x)[par1]
x <- x1
if (par3 == 'First Differences'){
x2 <- array(0, dim=c(n-1,k), dimnames=list(1:(n-1), paste('(1-B)',colnames(x),sep='')))
for (i in 1:n-1) {
for (j in 1:k) {
x2[i,j] <- x[i+1,j] - x[i,j]
}
}
x <- x2
}
if (par2 == 'Include Monthly Dummies'){
x2 <- array(0, dim=c(n,11), dimnames=list(1:n, paste('M', seq(1:11), sep ='')))
for (i in 1:11){
x2[seq(i,n,12),i] <- 1
}
x <- cbind(x, x2)
}
if (par2 == 'Include Quarterly Dummies'){
x2 <- array(0, dim=c(n,3), dimnames=list(1:n, paste('Q', seq(1:3), sep ='')))
for (i in 1:3){
x2[seq(i,n,4),i] <- 1
}
x <- cbind(x, x2)
}
k <- length(x[1,])
if (par3 == 'Linear Trend'){
x <- cbind(x, c(1:n))
colnames(x)[k+1] <- 't'
}
x
k <- length(x[1,])
df <- as.data.frame(x)
(mylm <- lm(df))
(mysum <- summary(mylm))
if (n > n25) {
kp3 <- k + 3
nmkm3 <- n - k - 3
gqarr <- array(NA, dim=c(nmkm3-kp3+1,3))
numgqtests <- 0
numsignificant1 <- 0
numsignificant5 <- 0
numsignificant10 <- 0
for (mypoint in kp3:nmkm3) {
j <- 0
numgqtests <- numgqtests + 1
for (myalt in c('greater', 'two.sided', 'less')) {
j <- j + 1
gqarr[mypoint-kp3+1,j] <- gqtest(mylm, point=mypoint, alternative=myalt)$p.value
}
if (gqarr[mypoint-kp3+1,2] < 0.01) numsignificant1 <- numsignificant1 + 1
if (gqarr[mypoint-kp3+1,2] < 0.05) numsignificant5 <- numsignificant5 + 1
if (gqarr[mypoint-kp3+1,2] < 0.10) numsignificant10 <- numsignificant10 + 1
}
gqarr
}
bitmap(file='test0.png')
plot(x[,1], type='l', main='Actuals and Interpolation', ylab='value of Actuals and Interpolation (dots)', xlab='time or index')
points(x[,1]-mysum$resid)
grid()
dev.off()
bitmap(file='test1.png')
plot(mysum$resid, type='b', pch=19, main='Residuals', ylab='value of Residuals', xlab='time or index')
grid()
dev.off()
bitmap(file='test2.png')
hist(mysum$resid, main='Residual Histogram', xlab='values of Residuals')
grid()
dev.off()
bitmap(file='test3.png')
densityplot(~mysum$resid,col='black',main='Residual Density Plot', xlab='values of Residuals')
dev.off()
bitmap(file='test4.png')
qqnorm(mysum$resid, main='Residual Normal Q-Q Plot')
qqline(mysum$resid)
grid()
dev.off()
(myerror <- as.ts(mysum$resid))
bitmap(file='test5.png')
dum <- cbind(lag(myerror,k=1),myerror)
dum
dum1 <- dum[2:length(myerror),]
dum1
z <- as.data.frame(dum1)
z
plot(z,main=paste('Residual Lag plot, lowess, and regression line'), ylab='values of Residuals', xlab='lagged values of Residuals')
lines(lowess(z))
abline(lm(z))
grid()
dev.off()
bitmap(file='test6.png')
acf(mysum$resid, lag.max=length(mysum$resid)/2, main='Residual Autocorrelation Function')
grid()
dev.off()
bitmap(file='test7.png')
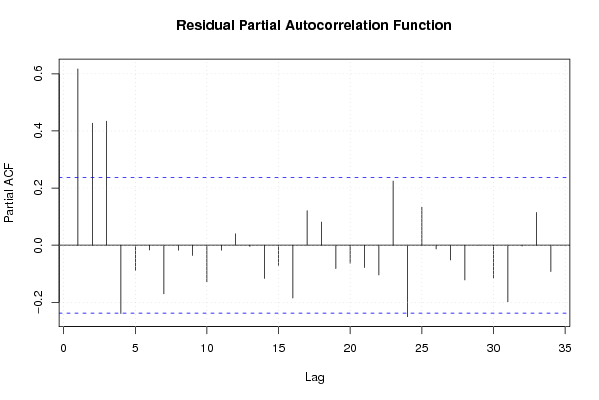
pacf(mysum$resid, lag.max=length(mysum$resid)/2, main='Residual Partial Autocorrelation Function')
grid()
dev.off()
bitmap(file='test8.png')
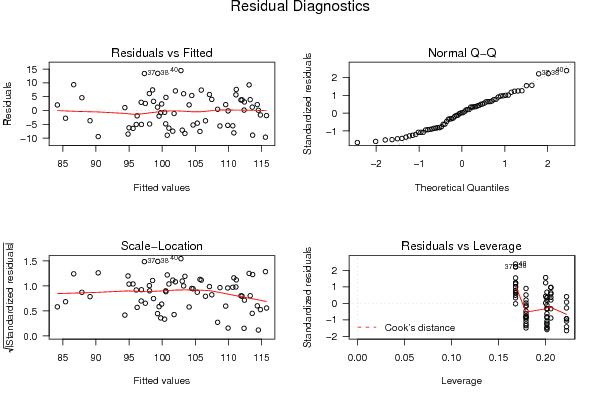
opar <- par(mfrow = c(2,2), oma = c(0, 0, 1.1, 0))
plot(mylm, las = 1, sub='Residual Diagnostics')
par(opar)
dev.off()
if (n > n25) {
bitmap(file='test9.png')
plot(kp3:nmkm3,gqarr[,2], main='Goldfeld-Quandt test',ylab='2-sided p-value',xlab='breakpoint')
grid()
dev.off()
}
load(file='createtable')
a<-table.start()
a<-table.row.start(a)
a<-table.element(a, 'Multiple Linear Regression - Estimated Regression Equation', 1, TRUE)
a<-table.row.end(a)
myeq <- colnames(x)[1]
myeq <- paste(myeq, '[t] = ', sep='')
for (i in 1:k){
if (mysum$coefficients[i,1] > 0) myeq <- paste(myeq, '+', '')
myeq <- paste(myeq, mysum$coefficients[i,1], sep=' ')
if (rownames(mysum$coefficients)[i] != '(Intercept)') {
myeq <- paste(myeq, rownames(mysum$coefficients)[i], sep='')
if (rownames(mysum$coefficients)[i] != 't') myeq <- paste(myeq, '[t]', sep='')
}
}
myeq <- paste(myeq, ' + e[t]')
a<-table.row.start(a)
a<-table.element(a, myeq)
a<-table.row.end(a)
a<-table.end(a)
table.save(a,file='mytable1.tab')
a<-table.start()
a<-table.row.start(a)
a<-table.element(a,hyperlink('ols1.htm','Multiple Linear Regression - Ordinary Least Squares',''), 6, TRUE)
a<-table.row.end(a)
a<-table.row.start(a)
a<-table.element(a,'Variable',header=TRUE)
a<-table.element(a,'Parameter',header=TRUE)
a<-table.element(a,'S.D.',header=TRUE)
a<-table.element(a,'T-STAT
H0: parameter = 0',header=TRUE)
a<-table.element(a,'2-tail p-value',header=TRUE)
a<-table.element(a,'1-tail p-value',header=TRUE)
a<-table.row.end(a)
for (i in 1:k){
a<-table.row.start(a)
a<-table.element(a,rownames(mysum$coefficients)[i],header=TRUE)
a<-table.element(a,mysum$coefficients[i,1])
a<-table.element(a, round(mysum$coefficients[i,2],6))
a<-table.element(a, round(mysum$coefficients[i,3],4))
a<-table.element(a, round(mysum$coefficients[i,4],6))
a<-table.element(a, round(mysum$coefficients[i,4]/2,6))
a<-table.row.end(a)
}
a<-table.end(a)
table.save(a,file='mytable2.tab')
a<-table.start()
a<-table.row.start(a)
a<-table.element(a, 'Multiple Linear Regression - Regression Statistics', 2, TRUE)
a<-table.row.end(a)
a<-table.row.start(a)
a<-table.element(a, 'Multiple R',1,TRUE)
a<-table.element(a, sqrt(mysum$r.squared))
a<-table.row.end(a)
a<-table.row.start(a)
a<-table.element(a, 'R-squared',1,TRUE)
a<-table.element(a, mysum$r.squared)
a<-table.row.end(a)
a<-table.row.start(a)
a<-table.element(a, 'Adjusted R-squared',1,TRUE)
a<-table.element(a, mysum$adj.r.squared)
a<-table.row.end(a)
a<-table.row.start(a)
a<-table.element(a, 'F-TEST (value)',1,TRUE)
a<-table.element(a, mysum$fstatistic[1])
a<-table.row.end(a)
a<-table.row.start(a)
a<-table.element(a, 'F-TEST (DF numerator)',1,TRUE)
a<-table.element(a, mysum$fstatistic[2])
a<-table.row.end(a)
a<-table.row.start(a)
a<-table.element(a, 'F-TEST (DF denominator)',1,TRUE)
a<-table.element(a, mysum$fstatistic[3])
a<-table.row.end(a)
a<-table.row.start(a)
a<-table.element(a, 'p-value',1,TRUE)
a<-table.element(a, 1-pf(mysum$fstatistic[1],mysum$fstatistic[2],mysum$fstatistic[3]))
a<-table.row.end(a)
a<-table.row.start(a)
a<-table.element(a, 'Multiple Linear Regression - Residual Statistics', 2, TRUE)
a<-table.row.end(a)
a<-table.row.start(a)
a<-table.element(a, 'Residual Standard Deviation',1,TRUE)
a<-table.element(a, mysum$sigma)
a<-table.row.end(a)
a<-table.row.start(a)
a<-table.element(a, 'Sum Squared Residuals',1,TRUE)
a<-table.element(a, sum(myerror*myerror))
a<-table.row.end(a)
a<-table.end(a)
table.save(a,file='mytable3.tab')
a<-table.start()
a<-table.row.start(a)
a<-table.element(a, 'Multiple Linear Regression - Actuals, Interpolation, and Residuals', 4, TRUE)
a<-table.row.end(a)
a<-table.row.start(a)
a<-table.element(a, 'Time or Index', 1, TRUE)
a<-table.element(a, 'Actuals', 1, TRUE)
a<-table.element(a, 'Interpolation
Forecast', 1, TRUE)
a<-table.element(a, 'Residuals
Prediction Error', 1, TRUE)
a<-table.row.end(a)
for (i in 1:n) {
a<-table.row.start(a)
a<-table.element(a,i, 1, TRUE)
a<-table.element(a,x[i])
a<-table.element(a,x[i]-mysum$resid[i])
a<-table.element(a,mysum$resid[i])
a<-table.row.end(a)
}
a<-table.end(a)
table.save(a,file='mytable4.tab')
if (n > n25) {
a<-table.start()
a<-table.row.start(a)
a<-table.element(a,'Goldfeld-Quandt test for Heteroskedasticity',4,TRUE)
a<-table.row.end(a)
a<-table.row.start(a)
a<-table.element(a,'p-values',header=TRUE)
a<-table.element(a,'Alternative Hypothesis',3,header=TRUE)
a<-table.row.end(a)
a<-table.row.start(a)
a<-table.element(a,'breakpoint index',header=TRUE)
a<-table.element(a,'greater',header=TRUE)
a<-table.element(a,'2-sided',header=TRUE)
a<-table.element(a,'less',header=TRUE)
a<-table.row.end(a)
for (mypoint in kp3:nmkm3) {
a<-table.row.start(a)
a<-table.element(a,mypoint,header=TRUE)
a<-table.element(a,gqarr[mypoint-kp3+1,1])
a<-table.element(a,gqarr[mypoint-kp3+1,2])
a<-table.element(a,gqarr[mypoint-kp3+1,3])
a<-table.row.end(a)
}
a<-table.end(a)
table.save(a,file='mytable5.tab')
a<-table.start()
a<-table.row.start(a)
a<-table.element(a,'Meta Analysis of Goldfeld-Quandt test for Heteroskedasticity',4,TRUE)
a<-table.row.end(a)
a<-table.row.start(a)
a<-table.element(a,'Description',header=TRUE)
a<-table.element(a,'# significant tests',header=TRUE)
a<-table.element(a,'% significant tests',header=TRUE)
a<-table.element(a,'OK/NOK',header=TRUE)
a<-table.row.end(a)
a<-table.row.start(a)
a<-table.element(a,'1% type I error level',header=TRUE)
a<-table.element(a,numsignificant1)
a<-table.element(a,numsignificant1/numgqtests)
if (numsignificant1/numgqtests < 0.01) dum <- 'OK' else dum <- 'NOK'
a<-table.element(a,dum)
a<-table.row.end(a)
a<-table.row.start(a)
a<-table.element(a,'5% type I error level',header=TRUE)
a<-table.element(a,numsignificant5)
a<-table.element(a,numsignificant5/numgqtests)
if (numsignificant5/numgqtests < 0.05) dum <- 'OK' else dum <- 'NOK'
a<-table.element(a,dum)
a<-table.row.end(a)
a<-table.row.start(a)
a<-table.element(a,'10% type I error level',header=TRUE)
a<-table.element(a,numsignificant10)
a<-table.element(a,numsignificant10/numgqtests)
if (numsignificant10/numgqtests < 0.1) dum <- 'OK' else dum <- 'NOK'
a<-table.element(a,dum)
a<-table.row.end(a)
a<-table.end(a)
table.save(a,file='mytable6.tab')
}