| Multiple Linear Regression - Estimated Regression Equation |
| productie[t] = + 97.46 + 0.473333333333328M1[t] + 2.49M2[t] + 13.1066666666667M3[t] + 5.99M4[t] + 5.15666666666667M5[t] + 15.2066666666667M6[t] -10.1933333333333M7[t] -0.00999999999999586M8[t] + 14.9M9[t] + 15.66M10[t] + 8.44M11[t] + e[t] |
| Multiple Linear Regression - Ordinary Least Squares | |||||
| Variable | Parameter | S.D. | T-STAT H0: parameter = 0 | 2-tail p-value | 1-tail p-value |
| (Intercept) | 97.46 | 3.107249 | 31.3654 | 0 | 0 |
| M1 | 0.473333333333328 | 4.207235 | 0.1125 | 0.910826 | 0.455413 |
| M2 | 2.49 | 4.207235 | 0.5918 | 0.556341 | 0.278171 |
| M3 | 13.1066666666667 | 4.207235 | 3.1153 | 0.002897 | 0.001448 |
| M4 | 5.99 | 4.207235 | 1.4237 | 0.160071 | 0.080035 |
| M5 | 5.15666666666667 | 4.207235 | 1.2257 | 0.225454 | 0.112727 |
| M6 | 15.2066666666667 | 4.207235 | 3.6144 | 0.000646 | 0.000323 |
| M7 | -10.1933333333333 | 4.207235 | -2.4228 | 0.01866 | 0.00933 |
| M8 | -0.00999999999999586 | 4.207235 | -0.0024 | 0.998112 | 0.499056 |
| M9 | 14.9 | 4.394313 | 3.3907 | 0.001284 | 0.000642 |
| M10 | 15.66 | 4.394313 | 3.5637 | 0.000756 | 0.000378 |
| M11 | 8.44 | 4.394313 | 1.9207 | 0.059871 | 0.029936 |
| Multiple Linear Regression - Regression Statistics | |
| Multiple R | 0.76970485989946 |
| R-squared | 0.592445571352847 |
| Adjusted R-squared | 0.512390237154299 |
| F-TEST (value) | 7.40045091665601 |
| F-TEST (DF numerator) | 11 |
| F-TEST (DF denominator) | 56 |
| p-value | 1.21475681513772e-07 |
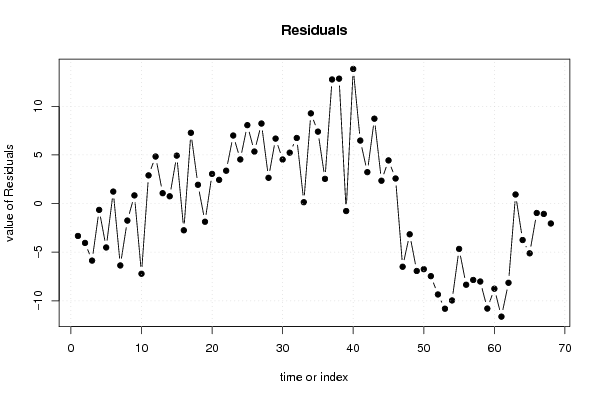
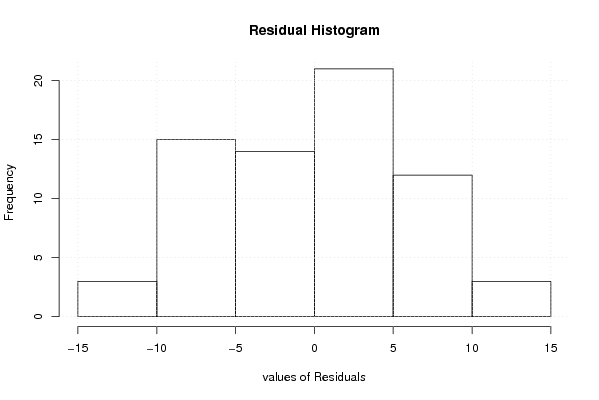
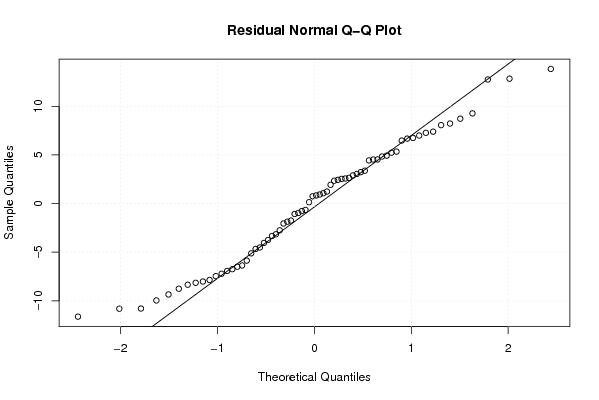
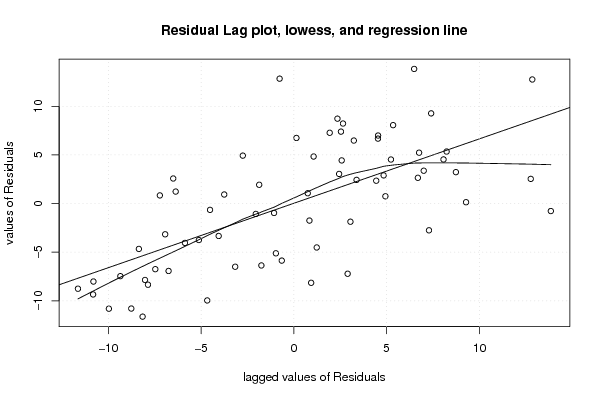
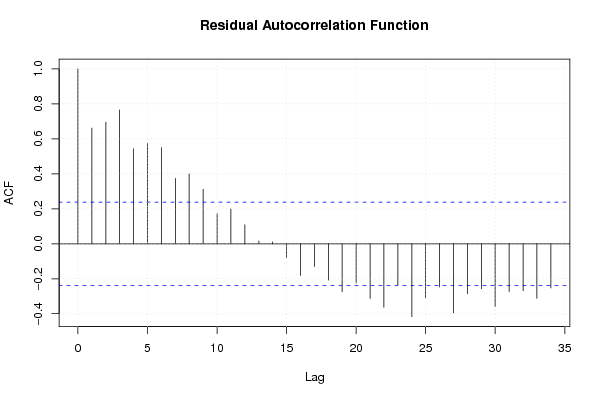
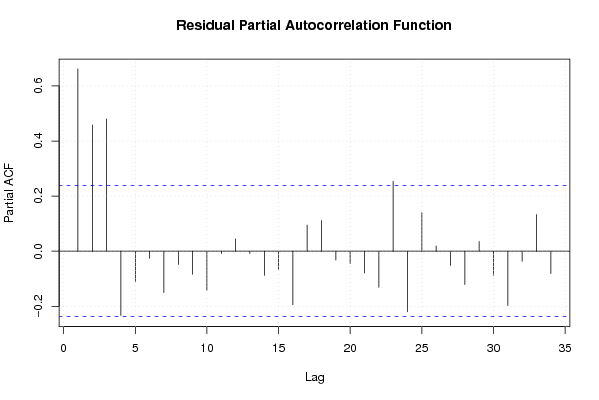
| Multiple Linear Regression - Residual Statistics | |
| Residual Standard Deviation | 6.94801958765778 |
| Sum Squared Residuals | 2703.39866666667 |
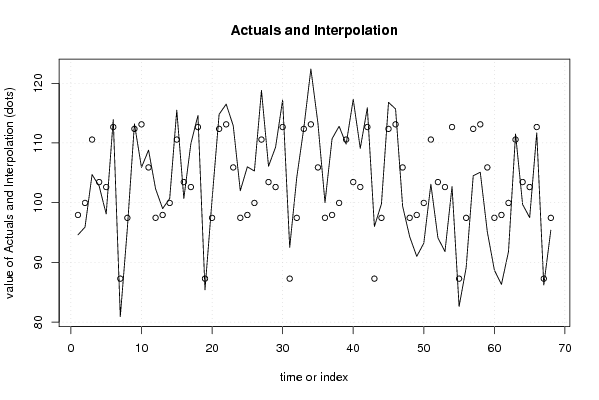
| Multiple Linear Regression - Actuals, Interpolation, and Residuals | |||
| Time or Index | Actuals | Interpolation Forecast | Residuals Prediction Error |
| 1 | 94.6 | 97.9333333333334 | -3.33333333333337 |
| 2 | 95.9 | 99.95 | -4.04999999999999 |
| 3 | 104.7 | 110.566666666667 | -5.86666666666666 |
| 4 | 102.8 | 103.45 | -0.650000000000001 |
| 5 | 98.1 | 102.616666666667 | -4.51666666666667 |
| 6 | 113.9 | 112.666666666667 | 1.23333333333334 |
| 7 | 80.9 | 87.2666666666667 | -6.36666666666665 |
| 8 | 95.7 | 97.45 | -1.74999999999999 |
| 9 | 113.2 | 112.36 | 0.84 |
| 10 | 105.9 | 113.12 | -7.22 |
| 11 | 108.8 | 105.9 | 2.9 |
| 12 | 102.3 | 97.46 | 4.84 |
| 13 | 99 | 97.9333333333333 | 1.06666666666667 |
| 14 | 100.7 | 99.95 | 0.750000000000001 |
| 15 | 115.5 | 110.566666666667 | 4.93333333333333 |
| 16 | 100.7 | 103.45 | -2.75 |
| 17 | 109.9 | 102.616666666667 | 7.28333333333334 |
| 18 | 114.6 | 112.666666666667 | 1.93333333333332 |
| 19 | 85.4 | 87.2666666666667 | -1.86666666666667 |
| 20 | 100.5 | 97.45 | 3.05 |
| 21 | 114.8 | 112.36 | 2.44 |
| 22 | 116.5 | 113.12 | 3.38 |
| 23 | 112.9 | 105.9 | 7 |
| 24 | 102 | 97.46 | 4.54 |
| 25 | 106 | 97.9333333333333 | 8.06666666666667 |
| 26 | 105.3 | 99.95 | 5.35 |
| 27 | 118.8 | 110.566666666667 | 8.23333333333333 |
| 28 | 106.1 | 103.45 | 2.65 |
| 29 | 109.3 | 102.616666666667 | 6.68333333333333 |
| 30 | 117.2 | 112.666666666667 | 4.53333333333333 |
| 31 | 92.5 | 87.2666666666667 | 5.23333333333333 |
| 32 | 104.2 | 97.45 | 6.75 |
| 33 | 112.5 | 112.36 | 0.14 |
| 34 | 122.4 | 113.12 | 9.28 |
| 35 | 113.3 | 105.9 | 7.4 |
| 36 | 100 | 97.46 | 2.54 |
| 37 | 110.7 | 97.9333333333333 | 12.7666666666667 |
| 38 | 112.8 | 99.95 | 12.85 |
| 39 | 109.8 | 110.566666666667 | -0.766666666666669 |
| 40 | 117.3 | 103.45 | 13.85 |
| 41 | 109.1 | 102.616666666667 | 6.48333333333333 |
| 42 | 115.9 | 112.666666666667 | 3.23333333333333 |
| 43 | 96 | 87.2666666666667 | 8.73333333333333 |
| 44 | 99.8 | 97.45 | 2.34999999999999 |
| 45 | 116.8 | 112.36 | 4.44 |
| 46 | 115.7 | 113.12 | 2.58 |
| 47 | 99.4 | 105.9 | -6.5 |
| 48 | 94.3 | 97.46 | -3.16 |
| 49 | 91 | 97.9333333333333 | -6.93333333333333 |
| 50 | 93.2 | 99.95 | -6.75 |
| 51 | 103.1 | 110.566666666667 | -7.46666666666667 |
| 52 | 94.1 | 103.45 | -9.35 |
| 53 | 91.8 | 102.616666666667 | -10.8166666666667 |
| 54 | 102.7 | 112.666666666667 | -9.96666666666667 |
| 55 | 82.6 | 87.2666666666667 | -4.66666666666668 |
| 56 | 89.1 | 97.45 | -8.35000000000001 |
| 57 | 104.5 | 112.36 | -7.86 |
| 58 | 105.1 | 113.12 | -8.02 |
| 59 | 95.1 | 105.9 | -10.8 |
| 60 | 88.7 | 97.46 | -8.76 |
| 61 | 86.3 | 97.9333333333333 | -11.6333333333333 |
| 62 | 91.8 | 99.95 | -8.15 |
| 63 | 111.5 | 110.566666666667 | 0.933333333333333 |
| 64 | 99.7 | 103.45 | -3.75 |
| 65 | 97.5 | 102.616666666667 | -5.11666666666667 |
| 66 | 111.7 | 112.666666666667 | -0.966666666666668 |
| 67 | 86.2 | 87.2666666666667 | -1.06666666666667 |
| 68 | 95.4 | 97.45 | -2.04999999999999 |
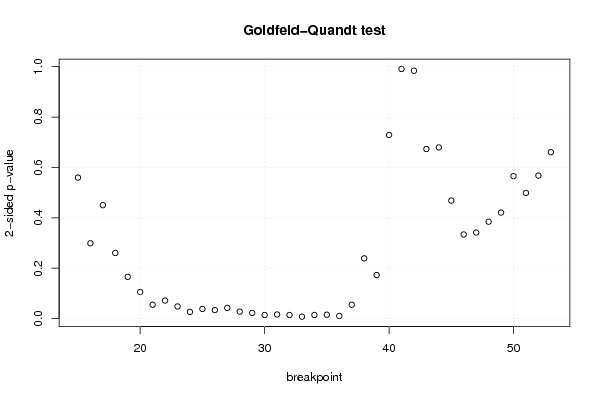
| Goldfeld-Quandt test for Heteroskedasticity | |||
| p-values | Alternative Hypothesis | ||
| breakpoint index | greater | 2-sided | less |
| 15 | 0.279903945828856 | 0.559807891657713 | 0.720096054171144 |
| 16 | 0.149490446041479 | 0.298980892082957 | 0.850509553958521 |
| 17 | 0.225069076485577 | 0.450138152971154 | 0.774930923514423 |
| 18 | 0.130239130852882 | 0.260478261705765 | 0.869760869147118 |
| 19 | 0.0828617936707712 | 0.165723587341542 | 0.917138206329229 |
| 20 | 0.0527294448431985 | 0.105458889686397 | 0.947270555156801 |
| 21 | 0.0274548426769131 | 0.0549096853538262 | 0.972545157323087 |
| 22 | 0.0357619702752245 | 0.0715239405504491 | 0.964238029724775 |
| 23 | 0.0240213879853113 | 0.0480427759706225 | 0.975978612014689 |
| 24 | 0.0131441852574014 | 0.0262883705148029 | 0.986855814742599 |
| 25 | 0.0191180789004362 | 0.0382361578008724 | 0.980881921099564 |
| 26 | 0.0169712804313833 | 0.0339425608627665 | 0.983028719568617 |
| 27 | 0.0212144982024582 | 0.0424289964049163 | 0.978785501797542 |
| 28 | 0.0136701112946298 | 0.0273402225892595 | 0.98632988870537 |
| 29 | 0.0111916156927583 | 0.0223832313855166 | 0.988808384307242 |
| 30 | 0.00709002570717608 | 0.0141800514143522 | 0.992909974292824 |
| 31 | 0.00808429519131566 | 0.0161685903826313 | 0.991915704808684 |
| 32 | 0.00707581526946462 | 0.0141516305389292 | 0.992924184730535 |
| 33 | 0.00378434604527411 | 0.00756869209054821 | 0.996215653954726 |
| 34 | 0.00717099732908169 | 0.0143419946581634 | 0.992829002670918 |
| 35 | 0.00764912622196707 | 0.0152982524439341 | 0.992350873778033 |
| 36 | 0.00517164828103617 | 0.0103432965620723 | 0.994828351718964 |
| 37 | 0.0273586236409393 | 0.0547172472818786 | 0.97264137635906 |
| 38 | 0.119511095467622 | 0.239022190935243 | 0.880488904532378 |
| 39 | 0.0863183948972432 | 0.172636789794486 | 0.913681605102757 |
| 40 | 0.364523704669585 | 0.72904740933917 | 0.635476295330415 |
| 41 | 0.504444226455508 | 0.991111547088984 | 0.495555773544492 |
| 42 | 0.508005534775095 | 0.98398893044981 | 0.491994465224905 |
| 43 | 0.663396262257293 | 0.673207475485413 | 0.336603737742707 |
| 44 | 0.660297260785231 | 0.679405478429538 | 0.339702739214769 |
| 45 | 0.765777349466891 | 0.468445301066218 | 0.234222650533109 |
| 46 | 0.833076188296082 | 0.333847623407837 | 0.166923811703918 |
| 47 | 0.829276754594327 | 0.341446490811346 | 0.170723245405673 |
| 48 | 0.807723102940108 | 0.384553794119783 | 0.192276897059892 |
| 49 | 0.789564116601246 | 0.420871766797508 | 0.210435883398754 |
| 50 | 0.71724540631697 | 0.565509187366059 | 0.282754593683029 |
| 51 | 0.750608491150512 | 0.498783017698976 | 0.249391508849488 |
| 52 | 0.716205540279308 | 0.567588919441383 | 0.283794459720692 |
| 53 | 0.669717308363064 | 0.660565383273872 | 0.330282691636936 |
| Meta Analysis of Goldfeld-Quandt test for Heteroskedasticity | |||
| Description | # significant tests | % significant tests | OK/NOK |
| 1% type I error level | 1 | 0.0256410256410256 | NOK |
| 5% type I error level | 14 | 0.358974358974359 | NOK |
| 10% type I error level | 17 | 0.435897435897436 | NOK |