Free Statistics

of Irreproducible Research!

Author's title

Author*The author of this computation has been verified*
R Software Modulerwasp_multipleregression.wasp
Title produced by softwareMultiple Regression
Date of computationSat, 27 Nov 2010 18:47:05 +0000
Cite this page as followsStatistical Computations at FreeStatistics.org, Office for Research Development and Education, URL https://freestatistics.org/blog/index.php?v=date/2010/Nov/27/t1290883541drcms0jvjnvpih7.htm/, Retrieved Mon, 29 Apr 2024 11:17:05 +0000
Statistical Computations at FreeStatistics.org, Office for Research Development and Education, URL https://freestatistics.org/blog/index.php?pk=102429, Retrieved Mon, 29 Apr 2024 11:17:05 +0000
QR Codes:

Original text written by user:
IsPrivate?No (this computation is public)
User-defined keywords
Estimated Impact136
Family? (F = Feedback message, R = changed R code, M = changed R Module, P = changed Parameters, D = changed Data)
-     [Multiple Regression] [Q1 The Seatbeltlaw] [2007-11-14 19:27:43] [8cd6641b921d30ebe00b648d1481bba0]
- RMPD  [Multiple Regression] [Seatbelt] [2009-11-12 13:54:52] [b98453cac15ba1066b407e146608df68]
-   PD      [Multiple Regression] [ws 8: seizoenaliteit] [2010-11-27 18:47:05] [09489ba95453d3f5c9e6f2eaeda915af] [Current]
-    D        [Multiple Regression] [seizoenaliteit] [2010-12-18 11:46:43] [bd591a1ebb67d263a02e7adae3fa1a4d]
-   PD          [Multiple Regression] [multiple regressi...] [2010-12-18 15:38:04] [bd591a1ebb67d263a02e7adae3fa1a4d]
Feedback Forum

Post a new message
Dataseries X:
94,6
95,9
104,7
102,8
98,1
113,9
80,9
95,7
113,2
105,9
108,8
102,3
99
100,7
115,5
100,7
109,9
114,6
85,4
100,5
114,8
116,5
112,9
102
106
105,3
118,8
106,1
109,3
117,2
92,5
104,2
112,5
122,4
113,3
100
110,7
112,8
109,8
117,3
109,1
115,9
96
99,8
116,8
115,7
99,4
94,3
91
93,2
103,1
94,1
91,8
102,7
82,6
89,1
104,5
105,1
95,1
88,7
86,3
91,8
111,5
99,7
97,5
111,7
86,2
95,4


Summary of computational transaction
Raw Inputview raw input (R code)
Raw Outputview raw output of R engine
Computing time5 seconds
R Server'RServer@AstonUniversity' @ vre.aston.ac.uk

\begin{tabular}{lllllllll}
\hline
Summary of computational transaction \tabularnewline
Raw Input & view raw input (R code)  \tabularnewline
Raw Output & view raw output of R engine  \tabularnewline
Computing time & 5 seconds \tabularnewline
R Server & 'RServer@AstonUniversity' @ vre.aston.ac.uk \tabularnewline
\hline
\end{tabular}
%Source: https://freestatistics.org/blog/index.php?pk=102429&T=0

[TABLE]
[ROW][C]Summary of computational transaction[/C][/ROW]
[ROW][C]Raw Input[/C][C]view raw input (R code) [/C][/ROW]
[ROW][C]Raw Output[/C][C]view raw output of R engine [/C][/ROW]
[ROW][C]Computing time[/C][C]5 seconds[/C][/ROW]
[ROW][C]R Server[/C][C]'RServer@AstonUniversity' @ vre.aston.ac.uk[/C][/ROW]
[/TABLE]
Source: https://freestatistics.org/blog/index.php?pk=102429&T=0

Globally Unique Identifier (entire table): ba.freestatistics.org/blog/index.php?pk=102429&T=0

As an alternative you can also use a QR Code:  

The GUIDs for individual cells are displayed in the table below:

Summary of computational transaction
Raw Inputview raw input (R code)
Raw Outputview raw output of R engine
Computing time5 seconds
R Server'RServer@AstonUniversity' @ vre.aston.ac.uk


Multiple Linear Regression - Estimated Regression Equation
productie[t] = + 97.46 + 0.473333333333328M1[t] + 2.49M2[t] + 13.1066666666667M3[t] + 5.99M4[t] + 5.15666666666667M5[t] + 15.2066666666667M6[t] -10.1933333333333M7[t] -0.00999999999999586M8[t] + 14.9M9[t] + 15.66M10[t] + 8.44M11[t] + e[t]

\begin{tabular}{lllllllll}
\hline
Multiple Linear Regression - Estimated Regression Equation \tabularnewline
productie[t] =  +  97.46 +  0.473333333333328M1[t] +  2.49M2[t] +  13.1066666666667M3[t] +  5.99M4[t] +  5.15666666666667M5[t] +  15.2066666666667M6[t] -10.1933333333333M7[t] -0.00999999999999586M8[t] +  14.9M9[t] +  15.66M10[t] +  8.44M11[t]  + e[t] \tabularnewline
\hline
\end{tabular}
%Source: https://freestatistics.org/blog/index.php?pk=102429&T=1

[TABLE]
[ROW][C]Multiple Linear Regression - Estimated Regression Equation[/C][/ROW]
[ROW][C]productie[t] =  +  97.46 +  0.473333333333328M1[t] +  2.49M2[t] +  13.1066666666667M3[t] +  5.99M4[t] +  5.15666666666667M5[t] +  15.2066666666667M6[t] -10.1933333333333M7[t] -0.00999999999999586M8[t] +  14.9M9[t] +  15.66M10[t] +  8.44M11[t]  + e[t][/C][/ROW]
[/TABLE]
Source: https://freestatistics.org/blog/index.php?pk=102429&T=1

Globally Unique Identifier (entire table): ba.freestatistics.org/blog/index.php?pk=102429&T=1

As an alternative you can also use a QR Code:  

The GUIDs for individual cells are displayed in the table below:

Multiple Linear Regression - Estimated Regression Equation
productie[t] = + 97.46 + 0.473333333333328M1[t] + 2.49M2[t] + 13.1066666666667M3[t] + 5.99M4[t] + 5.15666666666667M5[t] + 15.2066666666667M6[t] -10.1933333333333M7[t] -0.00999999999999586M8[t] + 14.9M9[t] + 15.66M10[t] + 8.44M11[t] + e[t]


Multiple Linear Regression - Ordinary Least Squares
VariableParameterS.D.T-STATH0: parameter = 02-tail p-value1-tail p-value
(Intercept)97.463.10724931.365400
M10.4733333333333284.2072350.11250.9108260.455413
M22.494.2072350.59180.5563410.278171
M313.10666666666674.2072353.11530.0028970.001448
M45.994.2072351.42370.1600710.080035
M55.156666666666674.2072351.22570.2254540.112727
M615.20666666666674.2072353.61440.0006460.000323
M7-10.19333333333334.207235-2.42280.018660.00933
M8-0.009999999999995864.207235-0.00240.9981120.499056
M914.94.3943133.39070.0012840.000642
M1015.664.3943133.56370.0007560.000378
M118.444.3943131.92070.0598710.029936

\begin{tabular}{lllllllll}
\hline
Multiple Linear Regression - Ordinary Least Squares \tabularnewline
Variable & Parameter & S.D. & T-STATH0: parameter = 0 & 2-tail p-value & 1-tail p-value \tabularnewline
(Intercept) & 97.46 & 3.107249 & 31.3654 & 0 & 0 \tabularnewline
M1 & 0.473333333333328 & 4.207235 & 0.1125 & 0.910826 & 0.455413 \tabularnewline
M2 & 2.49 & 4.207235 & 0.5918 & 0.556341 & 0.278171 \tabularnewline
M3 & 13.1066666666667 & 4.207235 & 3.1153 & 0.002897 & 0.001448 \tabularnewline
M4 & 5.99 & 4.207235 & 1.4237 & 0.160071 & 0.080035 \tabularnewline
M5 & 5.15666666666667 & 4.207235 & 1.2257 & 0.225454 & 0.112727 \tabularnewline
M6 & 15.2066666666667 & 4.207235 & 3.6144 & 0.000646 & 0.000323 \tabularnewline
M7 & -10.1933333333333 & 4.207235 & -2.4228 & 0.01866 & 0.00933 \tabularnewline
M8 & -0.00999999999999586 & 4.207235 & -0.0024 & 0.998112 & 0.499056 \tabularnewline
M9 & 14.9 & 4.394313 & 3.3907 & 0.001284 & 0.000642 \tabularnewline
M10 & 15.66 & 4.394313 & 3.5637 & 0.000756 & 0.000378 \tabularnewline
M11 & 8.44 & 4.394313 & 1.9207 & 0.059871 & 0.029936 \tabularnewline
\hline
\end{tabular}
%Source: https://freestatistics.org/blog/index.php?pk=102429&T=2

[TABLE]
[ROW][C]Multiple Linear Regression - Ordinary Least Squares[/C][/ROW]
[ROW][C]Variable[/C][C]Parameter[/C][C]S.D.[/C][C]T-STATH0: parameter = 0[/C][C]2-tail p-value[/C][C]1-tail p-value[/C][/ROW]
[ROW][C](Intercept)[/C][C]97.46[/C][C]3.107249[/C][C]31.3654[/C][C]0[/C][C]0[/C][/ROW]
[ROW][C]M1[/C][C]0.473333333333328[/C][C]4.207235[/C][C]0.1125[/C][C]0.910826[/C][C]0.455413[/C][/ROW]
[ROW][C]M2[/C][C]2.49[/C][C]4.207235[/C][C]0.5918[/C][C]0.556341[/C][C]0.278171[/C][/ROW]
[ROW][C]M3[/C][C]13.1066666666667[/C][C]4.207235[/C][C]3.1153[/C][C]0.002897[/C][C]0.001448[/C][/ROW]
[ROW][C]M4[/C][C]5.99[/C][C]4.207235[/C][C]1.4237[/C][C]0.160071[/C][C]0.080035[/C][/ROW]
[ROW][C]M5[/C][C]5.15666666666667[/C][C]4.207235[/C][C]1.2257[/C][C]0.225454[/C][C]0.112727[/C][/ROW]
[ROW][C]M6[/C][C]15.2066666666667[/C][C]4.207235[/C][C]3.6144[/C][C]0.000646[/C][C]0.000323[/C][/ROW]
[ROW][C]M7[/C][C]-10.1933333333333[/C][C]4.207235[/C][C]-2.4228[/C][C]0.01866[/C][C]0.00933[/C][/ROW]
[ROW][C]M8[/C][C]-0.00999999999999586[/C][C]4.207235[/C][C]-0.0024[/C][C]0.998112[/C][C]0.499056[/C][/ROW]
[ROW][C]M9[/C][C]14.9[/C][C]4.394313[/C][C]3.3907[/C][C]0.001284[/C][C]0.000642[/C][/ROW]
[ROW][C]M10[/C][C]15.66[/C][C]4.394313[/C][C]3.5637[/C][C]0.000756[/C][C]0.000378[/C][/ROW]
[ROW][C]M11[/C][C]8.44[/C][C]4.394313[/C][C]1.9207[/C][C]0.059871[/C][C]0.029936[/C][/ROW]
[/TABLE]
Source: https://freestatistics.org/blog/index.php?pk=102429&T=2

Globally Unique Identifier (entire table): ba.freestatistics.org/blog/index.php?pk=102429&T=2

As an alternative you can also use a QR Code:  

The GUIDs for individual cells are displayed in the table below:

Multiple Linear Regression - Ordinary Least Squares
VariableParameterS.D.T-STATH0: parameter = 02-tail p-value1-tail p-value
(Intercept)97.463.10724931.365400
M10.4733333333333284.2072350.11250.9108260.455413
M22.494.2072350.59180.5563410.278171
M313.10666666666674.2072353.11530.0028970.001448
M45.994.2072351.42370.1600710.080035
M55.156666666666674.2072351.22570.2254540.112727
M615.20666666666674.2072353.61440.0006460.000323
M7-10.19333333333334.207235-2.42280.018660.00933
M8-0.009999999999995864.207235-0.00240.9981120.499056
M914.94.3943133.39070.0012840.000642
M1015.664.3943133.56370.0007560.000378
M118.444.3943131.92070.0598710.029936


Multiple Linear Regression - Regression Statistics
Multiple R0.76970485989946
R-squared0.592445571352847
Adjusted R-squared0.512390237154299
F-TEST (value)7.40045091665601
F-TEST (DF numerator)11
F-TEST (DF denominator)56
p-value1.21475681513772e-07
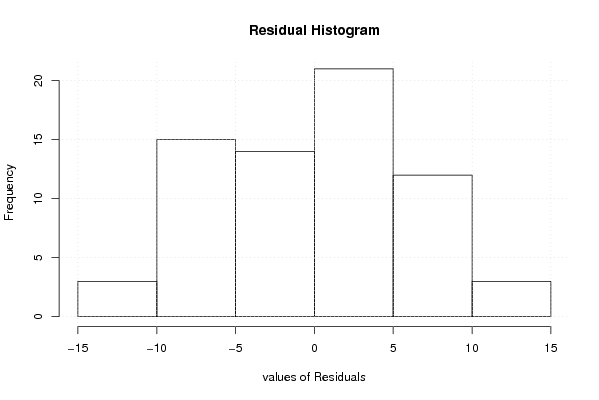
Multiple Linear Regression - Residual Statistics
Residual Standard Deviation6.94801958765778
Sum Squared Residuals2703.39866666667

\begin{tabular}{lllllllll}
\hline
Multiple Linear Regression - Regression Statistics \tabularnewline
Multiple R & 0.76970485989946 \tabularnewline
R-squared & 0.592445571352847 \tabularnewline
Adjusted R-squared & 0.512390237154299 \tabularnewline
F-TEST (value) & 7.40045091665601 \tabularnewline
F-TEST (DF numerator) & 11 \tabularnewline
F-TEST (DF denominator) & 56 \tabularnewline
p-value & 1.21475681513772e-07 \tabularnewline
Multiple Linear Regression - Residual Statistics \tabularnewline
Residual Standard Deviation & 6.94801958765778 \tabularnewline
Sum Squared Residuals & 2703.39866666667 \tabularnewline
\hline
\end{tabular}
%Source: https://freestatistics.org/blog/index.php?pk=102429&T=3

[TABLE]
[ROW][C]Multiple Linear Regression - Regression Statistics[/C][/ROW]
[ROW][C]Multiple R[/C][C]0.76970485989946[/C][/ROW]
[ROW][C]R-squared[/C][C]0.592445571352847[/C][/ROW]
[ROW][C]Adjusted R-squared[/C][C]0.512390237154299[/C][/ROW]
[ROW][C]F-TEST (value)[/C][C]7.40045091665601[/C][/ROW]
[ROW][C]F-TEST (DF numerator)[/C][C]11[/C][/ROW]
[ROW][C]F-TEST (DF denominator)[/C][C]56[/C][/ROW]
[ROW][C]p-value[/C][C]1.21475681513772e-07[/C][/ROW]
[ROW][C]Multiple Linear Regression - Residual Statistics[/C][/ROW]
[ROW][C]Residual Standard Deviation[/C][C]6.94801958765778[/C][/ROW]
[ROW][C]Sum Squared Residuals[/C][C]2703.39866666667[/C][/ROW]
[/TABLE]
Source: https://freestatistics.org/blog/index.php?pk=102429&T=3

Globally Unique Identifier (entire table): ba.freestatistics.org/blog/index.php?pk=102429&T=3

As an alternative you can also use a QR Code:  

The GUIDs for individual cells are displayed in the table below:

Multiple Linear Regression - Regression Statistics
Multiple R0.76970485989946
R-squared0.592445571352847
Adjusted R-squared0.512390237154299
F-TEST (value)7.40045091665601
F-TEST (DF numerator)11
F-TEST (DF denominator)56
p-value1.21475681513772e-07
Multiple Linear Regression - Residual Statistics
Residual Standard Deviation6.94801958765778
Sum Squared Residuals2703.39866666667


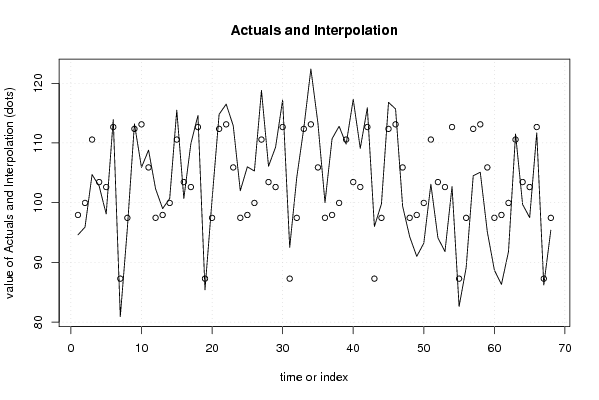
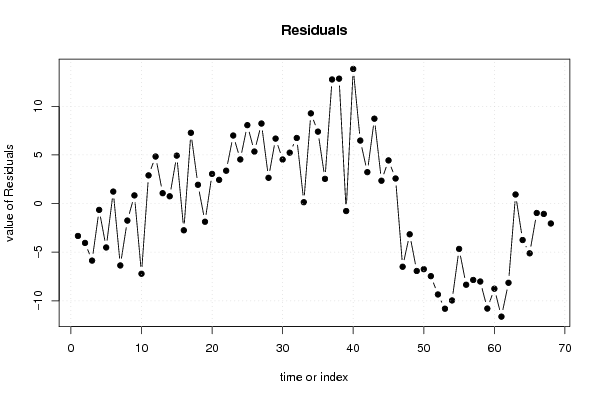
Multiple Linear Regression - Actuals, Interpolation, and Residuals
Time or IndexActualsInterpolationForecastResidualsPrediction Error
194.697.9333333333334-3.33333333333337
295.999.95-4.04999999999999
3104.7110.566666666667-5.86666666666666
4102.8103.45-0.650000000000001
598.1102.616666666667-4.51666666666667
6113.9112.6666666666671.23333333333334
780.987.2666666666667-6.36666666666665
895.797.45-1.74999999999999
9113.2112.360.84
10105.9113.12-7.22
11108.8105.92.9
12102.397.464.84
139997.93333333333331.06666666666667
14100.799.950.750000000000001
15115.5110.5666666666674.93333333333333
16100.7103.45-2.75
17109.9102.6166666666677.28333333333334
18114.6112.6666666666671.93333333333332
1985.487.2666666666667-1.86666666666667
20100.597.453.05
21114.8112.362.44
22116.5113.123.38
23112.9105.97
2410297.464.54
2510697.93333333333338.06666666666667
26105.399.955.35
27118.8110.5666666666678.23333333333333
28106.1103.452.65
29109.3102.6166666666676.68333333333333
30117.2112.6666666666674.53333333333333
3192.587.26666666666675.23333333333333
32104.297.456.75
33112.5112.360.14
34122.4113.129.28
35113.3105.97.4
3610097.462.54
37110.797.933333333333312.7666666666667
38112.899.9512.85
39109.8110.566666666667-0.766666666666669
40117.3103.4513.85
41109.1102.6166666666676.48333333333333
42115.9112.6666666666673.23333333333333
439687.26666666666678.73333333333333
4499.897.452.34999999999999
45116.8112.364.44
46115.7113.122.58
4799.4105.9-6.5
4894.397.46-3.16
499197.9333333333333-6.93333333333333
5093.299.95-6.75
51103.1110.566666666667-7.46666666666667
5294.1103.45-9.35
5391.8102.616666666667-10.8166666666667
54102.7112.666666666667-9.96666666666667
5582.687.2666666666667-4.66666666666668
5689.197.45-8.35000000000001
57104.5112.36-7.86
58105.1113.12-8.02
5995.1105.9-10.8
6088.797.46-8.76
6186.397.9333333333333-11.6333333333333
6291.899.95-8.15
63111.5110.5666666666670.933333333333333
6499.7103.45-3.75
6597.5102.616666666667-5.11666666666667
66111.7112.666666666667-0.966666666666668
6786.287.2666666666667-1.06666666666667
6895.497.45-2.04999999999999

\begin{tabular}{lllllllll}
\hline
Multiple Linear Regression - Actuals, Interpolation, and Residuals \tabularnewline
Time or Index & Actuals & InterpolationForecast & ResidualsPrediction Error \tabularnewline
1 & 94.6 & 97.9333333333334 & -3.33333333333337 \tabularnewline
2 & 95.9 & 99.95 & -4.04999999999999 \tabularnewline
3 & 104.7 & 110.566666666667 & -5.86666666666666 \tabularnewline
4 & 102.8 & 103.45 & -0.650000000000001 \tabularnewline
5 & 98.1 & 102.616666666667 & -4.51666666666667 \tabularnewline
6 & 113.9 & 112.666666666667 & 1.23333333333334 \tabularnewline
7 & 80.9 & 87.2666666666667 & -6.36666666666665 \tabularnewline
8 & 95.7 & 97.45 & -1.74999999999999 \tabularnewline
9 & 113.2 & 112.36 & 0.84 \tabularnewline
10 & 105.9 & 113.12 & -7.22 \tabularnewline
11 & 108.8 & 105.9 & 2.9 \tabularnewline
12 & 102.3 & 97.46 & 4.84 \tabularnewline
13 & 99 & 97.9333333333333 & 1.06666666666667 \tabularnewline
14 & 100.7 & 99.95 & 0.750000000000001 \tabularnewline
15 & 115.5 & 110.566666666667 & 4.93333333333333 \tabularnewline
16 & 100.7 & 103.45 & -2.75 \tabularnewline
17 & 109.9 & 102.616666666667 & 7.28333333333334 \tabularnewline
18 & 114.6 & 112.666666666667 & 1.93333333333332 \tabularnewline
19 & 85.4 & 87.2666666666667 & -1.86666666666667 \tabularnewline
20 & 100.5 & 97.45 & 3.05 \tabularnewline
21 & 114.8 & 112.36 & 2.44 \tabularnewline
22 & 116.5 & 113.12 & 3.38 \tabularnewline
23 & 112.9 & 105.9 & 7 \tabularnewline
24 & 102 & 97.46 & 4.54 \tabularnewline
25 & 106 & 97.9333333333333 & 8.06666666666667 \tabularnewline
26 & 105.3 & 99.95 & 5.35 \tabularnewline
27 & 118.8 & 110.566666666667 & 8.23333333333333 \tabularnewline
28 & 106.1 & 103.45 & 2.65 \tabularnewline
29 & 109.3 & 102.616666666667 & 6.68333333333333 \tabularnewline
30 & 117.2 & 112.666666666667 & 4.53333333333333 \tabularnewline
31 & 92.5 & 87.2666666666667 & 5.23333333333333 \tabularnewline
32 & 104.2 & 97.45 & 6.75 \tabularnewline
33 & 112.5 & 112.36 & 0.14 \tabularnewline
34 & 122.4 & 113.12 & 9.28 \tabularnewline
35 & 113.3 & 105.9 & 7.4 \tabularnewline
36 & 100 & 97.46 & 2.54 \tabularnewline
37 & 110.7 & 97.9333333333333 & 12.7666666666667 \tabularnewline
38 & 112.8 & 99.95 & 12.85 \tabularnewline
39 & 109.8 & 110.566666666667 & -0.766666666666669 \tabularnewline
40 & 117.3 & 103.45 & 13.85 \tabularnewline
41 & 109.1 & 102.616666666667 & 6.48333333333333 \tabularnewline
42 & 115.9 & 112.666666666667 & 3.23333333333333 \tabularnewline
43 & 96 & 87.2666666666667 & 8.73333333333333 \tabularnewline
44 & 99.8 & 97.45 & 2.34999999999999 \tabularnewline
45 & 116.8 & 112.36 & 4.44 \tabularnewline
46 & 115.7 & 113.12 & 2.58 \tabularnewline
47 & 99.4 & 105.9 & -6.5 \tabularnewline
48 & 94.3 & 97.46 & -3.16 \tabularnewline
49 & 91 & 97.9333333333333 & -6.93333333333333 \tabularnewline
50 & 93.2 & 99.95 & -6.75 \tabularnewline
51 & 103.1 & 110.566666666667 & -7.46666666666667 \tabularnewline
52 & 94.1 & 103.45 & -9.35 \tabularnewline
53 & 91.8 & 102.616666666667 & -10.8166666666667 \tabularnewline
54 & 102.7 & 112.666666666667 & -9.96666666666667 \tabularnewline
55 & 82.6 & 87.2666666666667 & -4.66666666666668 \tabularnewline
56 & 89.1 & 97.45 & -8.35000000000001 \tabularnewline
57 & 104.5 & 112.36 & -7.86 \tabularnewline
58 & 105.1 & 113.12 & -8.02 \tabularnewline
59 & 95.1 & 105.9 & -10.8 \tabularnewline
60 & 88.7 & 97.46 & -8.76 \tabularnewline
61 & 86.3 & 97.9333333333333 & -11.6333333333333 \tabularnewline
62 & 91.8 & 99.95 & -8.15 \tabularnewline
63 & 111.5 & 110.566666666667 & 0.933333333333333 \tabularnewline
64 & 99.7 & 103.45 & -3.75 \tabularnewline
65 & 97.5 & 102.616666666667 & -5.11666666666667 \tabularnewline
66 & 111.7 & 112.666666666667 & -0.966666666666668 \tabularnewline
67 & 86.2 & 87.2666666666667 & -1.06666666666667 \tabularnewline
68 & 95.4 & 97.45 & -2.04999999999999 \tabularnewline
\hline
\end{tabular}
%Source: https://freestatistics.org/blog/index.php?pk=102429&T=4

[TABLE]
[ROW][C]Multiple Linear Regression - Actuals, Interpolation, and Residuals[/C][/ROW]
[ROW][C]Time or Index[/C][C]Actuals[/C][C]InterpolationForecast[/C][C]ResidualsPrediction Error[/C][/ROW]
[ROW][C]1[/C][C]94.6[/C][C]97.9333333333334[/C][C]-3.33333333333337[/C][/ROW]
[ROW][C]2[/C][C]95.9[/C][C]99.95[/C][C]-4.04999999999999[/C][/ROW]
[ROW][C]3[/C][C]104.7[/C][C]110.566666666667[/C][C]-5.86666666666666[/C][/ROW]
[ROW][C]4[/C][C]102.8[/C][C]103.45[/C][C]-0.650000000000001[/C][/ROW]
[ROW][C]5[/C][C]98.1[/C][C]102.616666666667[/C][C]-4.51666666666667[/C][/ROW]
[ROW][C]6[/C][C]113.9[/C][C]112.666666666667[/C][C]1.23333333333334[/C][/ROW]
[ROW][C]7[/C][C]80.9[/C][C]87.2666666666667[/C][C]-6.36666666666665[/C][/ROW]
[ROW][C]8[/C][C]95.7[/C][C]97.45[/C][C]-1.74999999999999[/C][/ROW]
[ROW][C]9[/C][C]113.2[/C][C]112.36[/C][C]0.84[/C][/ROW]
[ROW][C]10[/C][C]105.9[/C][C]113.12[/C][C]-7.22[/C][/ROW]
[ROW][C]11[/C][C]108.8[/C][C]105.9[/C][C]2.9[/C][/ROW]
[ROW][C]12[/C][C]102.3[/C][C]97.46[/C][C]4.84[/C][/ROW]
[ROW][C]13[/C][C]99[/C][C]97.9333333333333[/C][C]1.06666666666667[/C][/ROW]
[ROW][C]14[/C][C]100.7[/C][C]99.95[/C][C]0.750000000000001[/C][/ROW]
[ROW][C]15[/C][C]115.5[/C][C]110.566666666667[/C][C]4.93333333333333[/C][/ROW]
[ROW][C]16[/C][C]100.7[/C][C]103.45[/C][C]-2.75[/C][/ROW]
[ROW][C]17[/C][C]109.9[/C][C]102.616666666667[/C][C]7.28333333333334[/C][/ROW]
[ROW][C]18[/C][C]114.6[/C][C]112.666666666667[/C][C]1.93333333333332[/C][/ROW]
[ROW][C]19[/C][C]85.4[/C][C]87.2666666666667[/C][C]-1.86666666666667[/C][/ROW]
[ROW][C]20[/C][C]100.5[/C][C]97.45[/C][C]3.05[/C][/ROW]
[ROW][C]21[/C][C]114.8[/C][C]112.36[/C][C]2.44[/C][/ROW]
[ROW][C]22[/C][C]116.5[/C][C]113.12[/C][C]3.38[/C][/ROW]
[ROW][C]23[/C][C]112.9[/C][C]105.9[/C][C]7[/C][/ROW]
[ROW][C]24[/C][C]102[/C][C]97.46[/C][C]4.54[/C][/ROW]
[ROW][C]25[/C][C]106[/C][C]97.9333333333333[/C][C]8.06666666666667[/C][/ROW]
[ROW][C]26[/C][C]105.3[/C][C]99.95[/C][C]5.35[/C][/ROW]
[ROW][C]27[/C][C]118.8[/C][C]110.566666666667[/C][C]8.23333333333333[/C][/ROW]
[ROW][C]28[/C][C]106.1[/C][C]103.45[/C][C]2.65[/C][/ROW]
[ROW][C]29[/C][C]109.3[/C][C]102.616666666667[/C][C]6.68333333333333[/C][/ROW]
[ROW][C]30[/C][C]117.2[/C][C]112.666666666667[/C][C]4.53333333333333[/C][/ROW]
[ROW][C]31[/C][C]92.5[/C][C]87.2666666666667[/C][C]5.23333333333333[/C][/ROW]
[ROW][C]32[/C][C]104.2[/C][C]97.45[/C][C]6.75[/C][/ROW]
[ROW][C]33[/C][C]112.5[/C][C]112.36[/C][C]0.14[/C][/ROW]
[ROW][C]34[/C][C]122.4[/C][C]113.12[/C][C]9.28[/C][/ROW]
[ROW][C]35[/C][C]113.3[/C][C]105.9[/C][C]7.4[/C][/ROW]
[ROW][C]36[/C][C]100[/C][C]97.46[/C][C]2.54[/C][/ROW]
[ROW][C]37[/C][C]110.7[/C][C]97.9333333333333[/C][C]12.7666666666667[/C][/ROW]
[ROW][C]38[/C][C]112.8[/C][C]99.95[/C][C]12.85[/C][/ROW]
[ROW][C]39[/C][C]109.8[/C][C]110.566666666667[/C][C]-0.766666666666669[/C][/ROW]
[ROW][C]40[/C][C]117.3[/C][C]103.45[/C][C]13.85[/C][/ROW]
[ROW][C]41[/C][C]109.1[/C][C]102.616666666667[/C][C]6.48333333333333[/C][/ROW]
[ROW][C]42[/C][C]115.9[/C][C]112.666666666667[/C][C]3.23333333333333[/C][/ROW]
[ROW][C]43[/C][C]96[/C][C]87.2666666666667[/C][C]8.73333333333333[/C][/ROW]
[ROW][C]44[/C][C]99.8[/C][C]97.45[/C][C]2.34999999999999[/C][/ROW]
[ROW][C]45[/C][C]116.8[/C][C]112.36[/C][C]4.44[/C][/ROW]
[ROW][C]46[/C][C]115.7[/C][C]113.12[/C][C]2.58[/C][/ROW]
[ROW][C]47[/C][C]99.4[/C][C]105.9[/C][C]-6.5[/C][/ROW]
[ROW][C]48[/C][C]94.3[/C][C]97.46[/C][C]-3.16[/C][/ROW]
[ROW][C]49[/C][C]91[/C][C]97.9333333333333[/C][C]-6.93333333333333[/C][/ROW]
[ROW][C]50[/C][C]93.2[/C][C]99.95[/C][C]-6.75[/C][/ROW]
[ROW][C]51[/C][C]103.1[/C][C]110.566666666667[/C][C]-7.46666666666667[/C][/ROW]
[ROW][C]52[/C][C]94.1[/C][C]103.45[/C][C]-9.35[/C][/ROW]
[ROW][C]53[/C][C]91.8[/C][C]102.616666666667[/C][C]-10.8166666666667[/C][/ROW]
[ROW][C]54[/C][C]102.7[/C][C]112.666666666667[/C][C]-9.96666666666667[/C][/ROW]
[ROW][C]55[/C][C]82.6[/C][C]87.2666666666667[/C][C]-4.66666666666668[/C][/ROW]
[ROW][C]56[/C][C]89.1[/C][C]97.45[/C][C]-8.35000000000001[/C][/ROW]
[ROW][C]57[/C][C]104.5[/C][C]112.36[/C][C]-7.86[/C][/ROW]
[ROW][C]58[/C][C]105.1[/C][C]113.12[/C][C]-8.02[/C][/ROW]
[ROW][C]59[/C][C]95.1[/C][C]105.9[/C][C]-10.8[/C][/ROW]
[ROW][C]60[/C][C]88.7[/C][C]97.46[/C][C]-8.76[/C][/ROW]
[ROW][C]61[/C][C]86.3[/C][C]97.9333333333333[/C][C]-11.6333333333333[/C][/ROW]
[ROW][C]62[/C][C]91.8[/C][C]99.95[/C][C]-8.15[/C][/ROW]
[ROW][C]63[/C][C]111.5[/C][C]110.566666666667[/C][C]0.933333333333333[/C][/ROW]
[ROW][C]64[/C][C]99.7[/C][C]103.45[/C][C]-3.75[/C][/ROW]
[ROW][C]65[/C][C]97.5[/C][C]102.616666666667[/C][C]-5.11666666666667[/C][/ROW]
[ROW][C]66[/C][C]111.7[/C][C]112.666666666667[/C][C]-0.966666666666668[/C][/ROW]
[ROW][C]67[/C][C]86.2[/C][C]87.2666666666667[/C][C]-1.06666666666667[/C][/ROW]
[ROW][C]68[/C][C]95.4[/C][C]97.45[/C][C]-2.04999999999999[/C][/ROW]
[/TABLE]
Source: https://freestatistics.org/blog/index.php?pk=102429&T=4

Globally Unique Identifier (entire table): ba.freestatistics.org/blog/index.php?pk=102429&T=4

As an alternative you can also use a QR Code:  

The GUIDs for individual cells are displayed in the table below:

Multiple Linear Regression - Actuals, Interpolation, and Residuals
Time or IndexActualsInterpolationForecastResidualsPrediction Error
194.697.9333333333334-3.33333333333337
295.999.95-4.04999999999999
3104.7110.566666666667-5.86666666666666
4102.8103.45-0.650000000000001
598.1102.616666666667-4.51666666666667
6113.9112.6666666666671.23333333333334
780.987.2666666666667-6.36666666666665
895.797.45-1.74999999999999
9113.2112.360.84
10105.9113.12-7.22
11108.8105.92.9
12102.397.464.84
139997.93333333333331.06666666666667
14100.799.950.750000000000001
15115.5110.5666666666674.93333333333333
16100.7103.45-2.75
17109.9102.6166666666677.28333333333334
18114.6112.6666666666671.93333333333332
1985.487.2666666666667-1.86666666666667
20100.597.453.05
21114.8112.362.44
22116.5113.123.38
23112.9105.97
2410297.464.54
2510697.93333333333338.06666666666667
26105.399.955.35
27118.8110.5666666666678.23333333333333
28106.1103.452.65
29109.3102.6166666666676.68333333333333
30117.2112.6666666666674.53333333333333
3192.587.26666666666675.23333333333333
32104.297.456.75
33112.5112.360.14
34122.4113.129.28
35113.3105.97.4
3610097.462.54
37110.797.933333333333312.7666666666667
38112.899.9512.85
39109.8110.566666666667-0.766666666666669
40117.3103.4513.85
41109.1102.6166666666676.48333333333333
42115.9112.6666666666673.23333333333333
439687.26666666666678.73333333333333
4499.897.452.34999999999999
45116.8112.364.44
46115.7113.122.58
4799.4105.9-6.5
4894.397.46-3.16
499197.9333333333333-6.93333333333333
5093.299.95-6.75
51103.1110.566666666667-7.46666666666667
5294.1103.45-9.35
5391.8102.616666666667-10.8166666666667
54102.7112.666666666667-9.96666666666667
5582.687.2666666666667-4.66666666666668
5689.197.45-8.35000000000001
57104.5112.36-7.86
58105.1113.12-8.02
5995.1105.9-10.8
6088.797.46-8.76
6186.397.9333333333333-11.6333333333333
6291.899.95-8.15
63111.5110.5666666666670.933333333333333
6499.7103.45-3.75
6597.5102.616666666667-5.11666666666667
66111.7112.666666666667-0.966666666666668
6786.287.2666666666667-1.06666666666667
6895.497.45-2.04999999999999


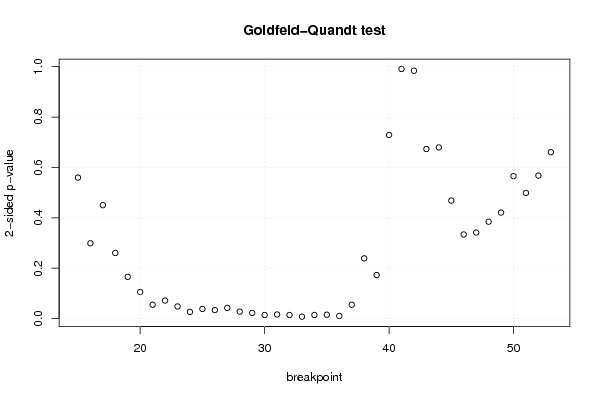
Goldfeld-Quandt test for Heteroskedasticity
p-valuesAlternative Hypothesis
breakpoint indexgreater2-sidedless
150.2799039458288560.5598078916577130.720096054171144
160.1494904460414790.2989808920829570.850509553958521
170.2250690764855770.4501381529711540.774930923514423
180.1302391308528820.2604782617057650.869760869147118
190.08286179367077120.1657235873415420.917138206329229
200.05272944484319850.1054588896863970.947270555156801
210.02745484267691310.05490968535382620.972545157323087
220.03576197027522450.07152394055044910.964238029724775
230.02402138798531130.04804277597062250.975978612014689
240.01314418525740140.02628837051480290.986855814742599
250.01911807890043620.03823615780087240.980881921099564
260.01697128043138330.03394256086276650.983028719568617
270.02121449820245820.04242899640491630.978785501797542
280.01367011129462980.02734022258925950.98632988870537
290.01119161569275830.02238323138551660.988808384307242
300.007090025707176080.01418005141435220.992909974292824
310.008084295191315660.01616859038263130.991915704808684
320.007075815269464620.01415163053892920.992924184730535
330.003784346045274110.007568692090548210.996215653954726
340.007170997329081690.01434199465816340.992829002670918
350.007649126221967070.01529825244393410.992350873778033
360.005171648281036170.01034329656207230.994828351718964
370.02735862364093930.05471724728187860.97264137635906
380.1195110954676220.2390221909352430.880488904532378
390.08631839489724320.1726367897944860.913681605102757
400.3645237046695850.729047409339170.635476295330415
410.5044442264555080.9911115470889840.495555773544492
420.5080055347750950.983988930449810.491994465224905
430.6633962622572930.6732074754854130.336603737742707
440.6602972607852310.6794054784295380.339702739214769
450.7657773494668910.4684453010662180.234222650533109
460.8330761882960820.3338476234078370.166923811703918
470.8292767545943270.3414464908113460.170723245405673
480.8077231029401080.3845537941197830.192276897059892
490.7895641166012460.4208717667975080.210435883398754
500.717245406316970.5655091873660590.282754593683029
510.7506084911505120.4987830176989760.249391508849488
520.7162055402793080.5675889194413830.283794459720692
530.6697173083630640.6605653832738720.330282691636936

\begin{tabular}{lllllllll}
\hline
Goldfeld-Quandt test for Heteroskedasticity \tabularnewline
p-values & Alternative Hypothesis \tabularnewline
breakpoint index & greater & 2-sided & less \tabularnewline
15 & 0.279903945828856 & 0.559807891657713 & 0.720096054171144 \tabularnewline
16 & 0.149490446041479 & 0.298980892082957 & 0.850509553958521 \tabularnewline
17 & 0.225069076485577 & 0.450138152971154 & 0.774930923514423 \tabularnewline
18 & 0.130239130852882 & 0.260478261705765 & 0.869760869147118 \tabularnewline
19 & 0.0828617936707712 & 0.165723587341542 & 0.917138206329229 \tabularnewline
20 & 0.0527294448431985 & 0.105458889686397 & 0.947270555156801 \tabularnewline
21 & 0.0274548426769131 & 0.0549096853538262 & 0.972545157323087 \tabularnewline
22 & 0.0357619702752245 & 0.0715239405504491 & 0.964238029724775 \tabularnewline
23 & 0.0240213879853113 & 0.0480427759706225 & 0.975978612014689 \tabularnewline
24 & 0.0131441852574014 & 0.0262883705148029 & 0.986855814742599 \tabularnewline
25 & 0.0191180789004362 & 0.0382361578008724 & 0.980881921099564 \tabularnewline
26 & 0.0169712804313833 & 0.0339425608627665 & 0.983028719568617 \tabularnewline
27 & 0.0212144982024582 & 0.0424289964049163 & 0.978785501797542 \tabularnewline
28 & 0.0136701112946298 & 0.0273402225892595 & 0.98632988870537 \tabularnewline
29 & 0.0111916156927583 & 0.0223832313855166 & 0.988808384307242 \tabularnewline
30 & 0.00709002570717608 & 0.0141800514143522 & 0.992909974292824 \tabularnewline
31 & 0.00808429519131566 & 0.0161685903826313 & 0.991915704808684 \tabularnewline
32 & 0.00707581526946462 & 0.0141516305389292 & 0.992924184730535 \tabularnewline
33 & 0.00378434604527411 & 0.00756869209054821 & 0.996215653954726 \tabularnewline
34 & 0.00717099732908169 & 0.0143419946581634 & 0.992829002670918 \tabularnewline
35 & 0.00764912622196707 & 0.0152982524439341 & 0.992350873778033 \tabularnewline
36 & 0.00517164828103617 & 0.0103432965620723 & 0.994828351718964 \tabularnewline
37 & 0.0273586236409393 & 0.0547172472818786 & 0.97264137635906 \tabularnewline
38 & 0.119511095467622 & 0.239022190935243 & 0.880488904532378 \tabularnewline
39 & 0.0863183948972432 & 0.172636789794486 & 0.913681605102757 \tabularnewline
40 & 0.364523704669585 & 0.72904740933917 & 0.635476295330415 \tabularnewline
41 & 0.504444226455508 & 0.991111547088984 & 0.495555773544492 \tabularnewline
42 & 0.508005534775095 & 0.98398893044981 & 0.491994465224905 \tabularnewline
43 & 0.663396262257293 & 0.673207475485413 & 0.336603737742707 \tabularnewline
44 & 0.660297260785231 & 0.679405478429538 & 0.339702739214769 \tabularnewline
45 & 0.765777349466891 & 0.468445301066218 & 0.234222650533109 \tabularnewline
46 & 0.833076188296082 & 0.333847623407837 & 0.166923811703918 \tabularnewline
47 & 0.829276754594327 & 0.341446490811346 & 0.170723245405673 \tabularnewline
48 & 0.807723102940108 & 0.384553794119783 & 0.192276897059892 \tabularnewline
49 & 0.789564116601246 & 0.420871766797508 & 0.210435883398754 \tabularnewline
50 & 0.71724540631697 & 0.565509187366059 & 0.282754593683029 \tabularnewline
51 & 0.750608491150512 & 0.498783017698976 & 0.249391508849488 \tabularnewline
52 & 0.716205540279308 & 0.567588919441383 & 0.283794459720692 \tabularnewline
53 & 0.669717308363064 & 0.660565383273872 & 0.330282691636936 \tabularnewline
\hline
\end{tabular}
%Source: https://freestatistics.org/blog/index.php?pk=102429&T=5

[TABLE]
[ROW][C]Goldfeld-Quandt test for Heteroskedasticity[/C][/ROW]
[ROW][C]p-values[/C][C]Alternative Hypothesis[/C][/ROW]
[ROW][C]breakpoint index[/C][C]greater[/C][C]2-sided[/C][C]less[/C][/ROW]
[ROW][C]15[/C][C]0.279903945828856[/C][C]0.559807891657713[/C][C]0.720096054171144[/C][/ROW]
[ROW][C]16[/C][C]0.149490446041479[/C][C]0.298980892082957[/C][C]0.850509553958521[/C][/ROW]
[ROW][C]17[/C][C]0.225069076485577[/C][C]0.450138152971154[/C][C]0.774930923514423[/C][/ROW]
[ROW][C]18[/C][C]0.130239130852882[/C][C]0.260478261705765[/C][C]0.869760869147118[/C][/ROW]
[ROW][C]19[/C][C]0.0828617936707712[/C][C]0.165723587341542[/C][C]0.917138206329229[/C][/ROW]
[ROW][C]20[/C][C]0.0527294448431985[/C][C]0.105458889686397[/C][C]0.947270555156801[/C][/ROW]
[ROW][C]21[/C][C]0.0274548426769131[/C][C]0.0549096853538262[/C][C]0.972545157323087[/C][/ROW]
[ROW][C]22[/C][C]0.0357619702752245[/C][C]0.0715239405504491[/C][C]0.964238029724775[/C][/ROW]
[ROW][C]23[/C][C]0.0240213879853113[/C][C]0.0480427759706225[/C][C]0.975978612014689[/C][/ROW]
[ROW][C]24[/C][C]0.0131441852574014[/C][C]0.0262883705148029[/C][C]0.986855814742599[/C][/ROW]
[ROW][C]25[/C][C]0.0191180789004362[/C][C]0.0382361578008724[/C][C]0.980881921099564[/C][/ROW]
[ROW][C]26[/C][C]0.0169712804313833[/C][C]0.0339425608627665[/C][C]0.983028719568617[/C][/ROW]
[ROW][C]27[/C][C]0.0212144982024582[/C][C]0.0424289964049163[/C][C]0.978785501797542[/C][/ROW]
[ROW][C]28[/C][C]0.0136701112946298[/C][C]0.0273402225892595[/C][C]0.98632988870537[/C][/ROW]
[ROW][C]29[/C][C]0.0111916156927583[/C][C]0.0223832313855166[/C][C]0.988808384307242[/C][/ROW]
[ROW][C]30[/C][C]0.00709002570717608[/C][C]0.0141800514143522[/C][C]0.992909974292824[/C][/ROW]
[ROW][C]31[/C][C]0.00808429519131566[/C][C]0.0161685903826313[/C][C]0.991915704808684[/C][/ROW]
[ROW][C]32[/C][C]0.00707581526946462[/C][C]0.0141516305389292[/C][C]0.992924184730535[/C][/ROW]
[ROW][C]33[/C][C]0.00378434604527411[/C][C]0.00756869209054821[/C][C]0.996215653954726[/C][/ROW]
[ROW][C]34[/C][C]0.00717099732908169[/C][C]0.0143419946581634[/C][C]0.992829002670918[/C][/ROW]
[ROW][C]35[/C][C]0.00764912622196707[/C][C]0.0152982524439341[/C][C]0.992350873778033[/C][/ROW]
[ROW][C]36[/C][C]0.00517164828103617[/C][C]0.0103432965620723[/C][C]0.994828351718964[/C][/ROW]
[ROW][C]37[/C][C]0.0273586236409393[/C][C]0.0547172472818786[/C][C]0.97264137635906[/C][/ROW]
[ROW][C]38[/C][C]0.119511095467622[/C][C]0.239022190935243[/C][C]0.880488904532378[/C][/ROW]
[ROW][C]39[/C][C]0.0863183948972432[/C][C]0.172636789794486[/C][C]0.913681605102757[/C][/ROW]
[ROW][C]40[/C][C]0.364523704669585[/C][C]0.72904740933917[/C][C]0.635476295330415[/C][/ROW]
[ROW][C]41[/C][C]0.504444226455508[/C][C]0.991111547088984[/C][C]0.495555773544492[/C][/ROW]
[ROW][C]42[/C][C]0.508005534775095[/C][C]0.98398893044981[/C][C]0.491994465224905[/C][/ROW]
[ROW][C]43[/C][C]0.663396262257293[/C][C]0.673207475485413[/C][C]0.336603737742707[/C][/ROW]
[ROW][C]44[/C][C]0.660297260785231[/C][C]0.679405478429538[/C][C]0.339702739214769[/C][/ROW]
[ROW][C]45[/C][C]0.765777349466891[/C][C]0.468445301066218[/C][C]0.234222650533109[/C][/ROW]
[ROW][C]46[/C][C]0.833076188296082[/C][C]0.333847623407837[/C][C]0.166923811703918[/C][/ROW]
[ROW][C]47[/C][C]0.829276754594327[/C][C]0.341446490811346[/C][C]0.170723245405673[/C][/ROW]
[ROW][C]48[/C][C]0.807723102940108[/C][C]0.384553794119783[/C][C]0.192276897059892[/C][/ROW]
[ROW][C]49[/C][C]0.789564116601246[/C][C]0.420871766797508[/C][C]0.210435883398754[/C][/ROW]
[ROW][C]50[/C][C]0.71724540631697[/C][C]0.565509187366059[/C][C]0.282754593683029[/C][/ROW]
[ROW][C]51[/C][C]0.750608491150512[/C][C]0.498783017698976[/C][C]0.249391508849488[/C][/ROW]
[ROW][C]52[/C][C]0.716205540279308[/C][C]0.567588919441383[/C][C]0.283794459720692[/C][/ROW]
[ROW][C]53[/C][C]0.669717308363064[/C][C]0.660565383273872[/C][C]0.330282691636936[/C][/ROW]
[/TABLE]
Source: https://freestatistics.org/blog/index.php?pk=102429&T=5

Globally Unique Identifier (entire table): ba.freestatistics.org/blog/index.php?pk=102429&T=5

As an alternative you can also use a QR Code:  

The GUIDs for individual cells are displayed in the table below:

Goldfeld-Quandt test for Heteroskedasticity
p-valuesAlternative Hypothesis
breakpoint indexgreater2-sidedless
150.2799039458288560.5598078916577130.720096054171144
160.1494904460414790.2989808920829570.850509553958521
170.2250690764855770.4501381529711540.774930923514423
180.1302391308528820.2604782617057650.869760869147118
190.08286179367077120.1657235873415420.917138206329229
200.05272944484319850.1054588896863970.947270555156801
210.02745484267691310.05490968535382620.972545157323087
220.03576197027522450.07152394055044910.964238029724775
230.02402138798531130.04804277597062250.975978612014689
240.01314418525740140.02628837051480290.986855814742599
250.01911807890043620.03823615780087240.980881921099564
260.01697128043138330.03394256086276650.983028719568617
270.02121449820245820.04242899640491630.978785501797542
280.01367011129462980.02734022258925950.98632988870537
290.01119161569275830.02238323138551660.988808384307242
300.007090025707176080.01418005141435220.992909974292824
310.008084295191315660.01616859038263130.991915704808684
320.007075815269464620.01415163053892920.992924184730535
330.003784346045274110.007568692090548210.996215653954726
340.007170997329081690.01434199465816340.992829002670918
350.007649126221967070.01529825244393410.992350873778033
360.005171648281036170.01034329656207230.994828351718964
370.02735862364093930.05471724728187860.97264137635906
380.1195110954676220.2390221909352430.880488904532378
390.08631839489724320.1726367897944860.913681605102757
400.3645237046695850.729047409339170.635476295330415
410.5044442264555080.9911115470889840.495555773544492
420.5080055347750950.983988930449810.491994465224905
430.6633962622572930.6732074754854130.336603737742707
440.6602972607852310.6794054784295380.339702739214769
450.7657773494668910.4684453010662180.234222650533109
460.8330761882960820.3338476234078370.166923811703918
470.8292767545943270.3414464908113460.170723245405673
480.8077231029401080.3845537941197830.192276897059892
490.7895641166012460.4208717667975080.210435883398754
500.717245406316970.5655091873660590.282754593683029
510.7506084911505120.4987830176989760.249391508849488
520.7162055402793080.5675889194413830.283794459720692
530.6697173083630640.6605653832738720.330282691636936


Meta Analysis of Goldfeld-Quandt test for Heteroskedasticity
Description# significant tests% significant testsOK/NOK
1% type I error level10.0256410256410256NOK
5% type I error level140.358974358974359NOK
10% type I error level170.435897435897436NOK

\begin{tabular}{lllllllll}
\hline
Meta Analysis of Goldfeld-Quandt test for Heteroskedasticity \tabularnewline
Description & # significant tests & % significant tests & OK/NOK \tabularnewline
1% type I error level & 1 & 0.0256410256410256 & NOK \tabularnewline
5% type I error level & 14 & 0.358974358974359 & NOK \tabularnewline
10% type I error level & 17 & 0.435897435897436 & NOK \tabularnewline
\hline
\end{tabular}
%Source: https://freestatistics.org/blog/index.php?pk=102429&T=6

[TABLE]
[ROW][C]Meta Analysis of Goldfeld-Quandt test for Heteroskedasticity[/C][/ROW]
[ROW][C]Description[/C][C]# significant tests[/C][C]% significant tests[/C][C]OK/NOK[/C][/ROW]
[ROW][C]1% type I error level[/C][C]1[/C][C]0.0256410256410256[/C][C]NOK[/C][/ROW]
[ROW][C]5% type I error level[/C][C]14[/C][C]0.358974358974359[/C][C]NOK[/C][/ROW]
[ROW][C]10% type I error level[/C][C]17[/C][C]0.435897435897436[/C][C]NOK[/C][/ROW]
[/TABLE]
Source: https://freestatistics.org/blog/index.php?pk=102429&T=6

Globally Unique Identifier (entire table): ba.freestatistics.org/blog/index.php?pk=102429&T=6

As an alternative you can also use a QR Code:  

The GUIDs for individual cells are displayed in the table below:

Meta Analysis of Goldfeld-Quandt test for Heteroskedasticity
Description# significant tests% significant testsOK/NOK
1% type I error level10.0256410256410256NOK
5% type I error level140.358974358974359NOK
10% type I error level170.435897435897436NOK


Parameters (Session):
par1 = 1 ; par2 = Include Monthly Dummies ; par3 = No Linear Trend ;
Parameters (R input):
par1 = 1 ; par2 = Include Monthly Dummies ; par3 = No Linear Trend ;
R code (references can be found in the software module):
library(lattice)
library(lmtest)
n25 <- 25 #minimum number of obs. for Goldfeld-Quandt test
par1 <- as.numeric(par1)
x <- t(y)
k <- length(x[1,])
n <- length(x[,1])
x1 <- cbind(x[,par1], x[,1:k!=par1])
mycolnames <- c(colnames(x)[par1], colnames(x)[1:k!=par1])
colnames(x1) <- mycolnames #colnames(x)[par1]
x <- x1
if (par3 == 'First Differences'){
x2 <- array(0, dim=c(n-1,k), dimnames=list(1:(n-1), paste('(1-B)',colnames(x),sep='')))
for (i in 1:n-1) {
for (j in 1:k) {
x2[i,j] <- x[i+1,j] - x[i,j]
}
}
x <- x2
}
if (par2 == 'Include Monthly Dummies'){
x2 <- array(0, dim=c(n,11), dimnames=list(1:n, paste('M', seq(1:11), sep ='')))
for (i in 1:11){
x2[seq(i,n,12),i] <- 1
}
x <- cbind(x, x2)
}
if (par2 == 'Include Quarterly Dummies'){
x2 <- array(0, dim=c(n,3), dimnames=list(1:n, paste('Q', seq(1:3), sep ='')))
for (i in 1:3){
x2[seq(i,n,4),i] <- 1
}
x <- cbind(x, x2)
}
k <- length(x[1,])
if (par3 == 'Linear Trend'){
x <- cbind(x, c(1:n))
colnames(x)[k+1] <- 't'
}
x
k <- length(x[1,])
df <- as.data.frame(x)
(mylm <- lm(df))
(mysum <- summary(mylm))
if (n > n25) {
kp3 <- k + 3
nmkm3 <- n - k - 3
gqarr <- array(NA, dim=c(nmkm3-kp3+1,3))
numgqtests <- 0
numsignificant1 <- 0
numsignificant5 <- 0
numsignificant10 <- 0
for (mypoint in kp3:nmkm3) {
j <- 0
numgqtests <- numgqtests + 1
for (myalt in c('greater', 'two.sided', 'less')) {
j <- j + 1
gqarr[mypoint-kp3+1,j] <- gqtest(mylm, point=mypoint, alternative=myalt)$p.value
}
if (gqarr[mypoint-kp3+1,2] < 0.01) numsignificant1 <- numsignificant1 + 1
if (gqarr[mypoint-kp3+1,2] < 0.05) numsignificant5 <- numsignificant5 + 1
if (gqarr[mypoint-kp3+1,2] < 0.10) numsignificant10 <- numsignificant10 + 1
}
gqarr
}
bitmap(file='test0.png')
plot(x[,1], type='l', main='Actuals and Interpolation', ylab='value of Actuals and Interpolation (dots)', xlab='time or index')
points(x[,1]-mysum$resid)
grid()
dev.off()
bitmap(file='test1.png')
plot(mysum$resid, type='b', pch=19, main='Residuals', ylab='value of Residuals', xlab='time or index')
grid()
dev.off()
bitmap(file='test2.png')
hist(mysum$resid, main='Residual Histogram', xlab='values of Residuals')
grid()
dev.off()
bitmap(file='test3.png')
densityplot(~mysum$resid,col='black',main='Residual Density Plot', xlab='values of Residuals')
dev.off()
bitmap(file='test4.png')
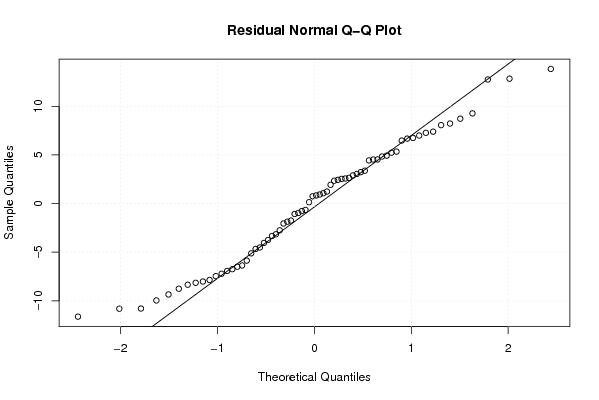
qqnorm(mysum$resid, main='Residual Normal Q-Q Plot')
qqline(mysum$resid)
grid()
dev.off()
(myerror <- as.ts(mysum$resid))
bitmap(file='test5.png')
dum <- cbind(lag(myerror,k=1),myerror)
dum
dum1 <- dum[2:length(myerror),]
dum1
z <- as.data.frame(dum1)
z
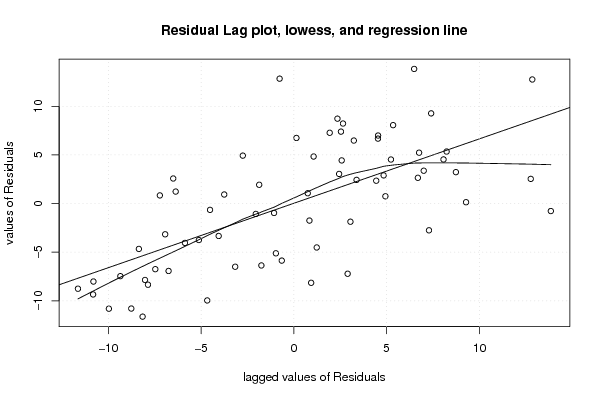
plot(z,main=paste('Residual Lag plot, lowess, and regression line'), ylab='values of Residuals', xlab='lagged values of Residuals')
lines(lowess(z))
abline(lm(z))
grid()
dev.off()
bitmap(file='test6.png')
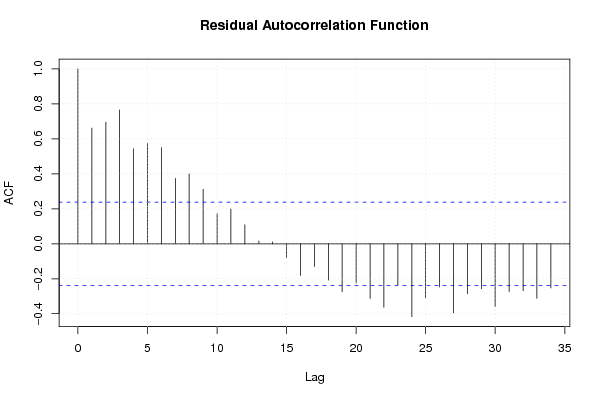
acf(mysum$resid, lag.max=length(mysum$resid)/2, main='Residual Autocorrelation Function')
grid()
dev.off()
bitmap(file='test7.png')
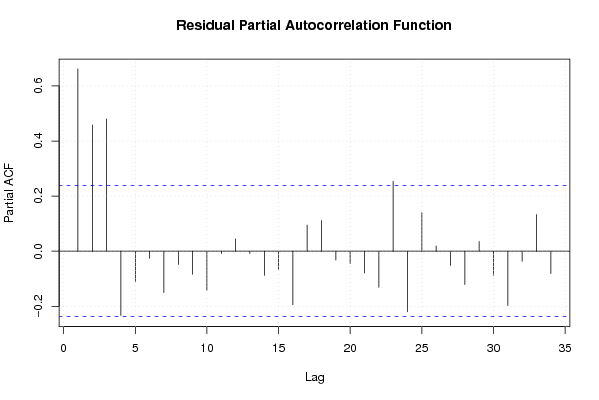
pacf(mysum$resid, lag.max=length(mysum$resid)/2, main='Residual Partial Autocorrelation Function')
grid()
dev.off()
bitmap(file='test8.png')
opar <- par(mfrow = c(2,2), oma = c(0, 0, 1.1, 0))
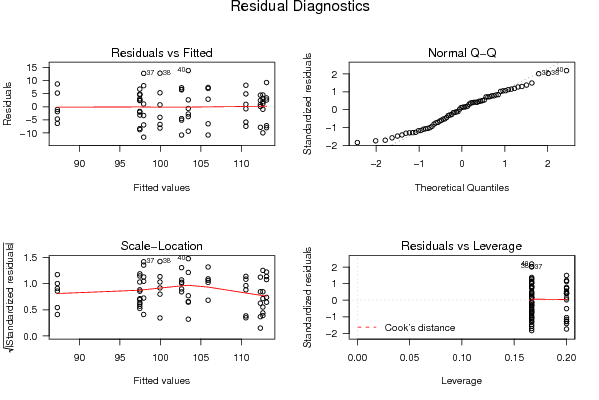
plot(mylm, las = 1, sub='Residual Diagnostics')
par(opar)
dev.off()
if (n > n25) {
bitmap(file='test9.png')
plot(kp3:nmkm3,gqarr[,2], main='Goldfeld-Quandt test',ylab='2-sided p-value',xlab='breakpoint')
grid()
dev.off()
}
load(file='createtable')
a<-table.start()
a<-table.row.start(a)
a<-table.element(a, 'Multiple Linear Regression - Estimated Regression Equation', 1, TRUE)
a<-table.row.end(a)
myeq <- colnames(x)[1]
myeq <- paste(myeq, '[t] = ', sep='')
for (i in 1:k){
if (mysum$coefficients[i,1] > 0) myeq <- paste(myeq, '+', '')
myeq <- paste(myeq, mysum$coefficients[i,1], sep=' ')
if (rownames(mysum$coefficients)[i] != '(Intercept)') {
myeq <- paste(myeq, rownames(mysum$coefficients)[i], sep='')
if (rownames(mysum$coefficients)[i] != 't') myeq <- paste(myeq, '[t]', sep='')
}
}
myeq <- paste(myeq, ' + e[t]')
a<-table.row.start(a)
a<-table.element(a, myeq)
a<-table.row.end(a)
a<-table.end(a)
table.save(a,file='mytable1.tab')
a<-table.start()
a<-table.row.start(a)
a<-table.element(a,hyperlink('ols1.htm','Multiple Linear Regression - Ordinary Least Squares',''), 6, TRUE)
a<-table.row.end(a)
a<-table.row.start(a)
a<-table.element(a,'Variable',header=TRUE)
a<-table.element(a,'Parameter',header=TRUE)
a<-table.element(a,'S.D.',header=TRUE)
a<-table.element(a,'T-STAT
H0: parameter = 0',header=TRUE)
a<-table.element(a,'2-tail p-value',header=TRUE)
a<-table.element(a,'1-tail p-value',header=TRUE)
a<-table.row.end(a)
for (i in 1:k){
a<-table.row.start(a)
a<-table.element(a,rownames(mysum$coefficients)[i],header=TRUE)
a<-table.element(a,mysum$coefficients[i,1])
a<-table.element(a, round(mysum$coefficients[i,2],6))
a<-table.element(a, round(mysum$coefficients[i,3],4))
a<-table.element(a, round(mysum$coefficients[i,4],6))
a<-table.element(a, round(mysum$coefficients[i,4]/2,6))
a<-table.row.end(a)
}
a<-table.end(a)
table.save(a,file='mytable2.tab')
a<-table.start()
a<-table.row.start(a)
a<-table.element(a, 'Multiple Linear Regression - Regression Statistics', 2, TRUE)
a<-table.row.end(a)
a<-table.row.start(a)
a<-table.element(a, 'Multiple R',1,TRUE)
a<-table.element(a, sqrt(mysum$r.squared))
a<-table.row.end(a)
a<-table.row.start(a)
a<-table.element(a, 'R-squared',1,TRUE)
a<-table.element(a, mysum$r.squared)
a<-table.row.end(a)
a<-table.row.start(a)
a<-table.element(a, 'Adjusted R-squared',1,TRUE)
a<-table.element(a, mysum$adj.r.squared)
a<-table.row.end(a)
a<-table.row.start(a)
a<-table.element(a, 'F-TEST (value)',1,TRUE)
a<-table.element(a, mysum$fstatistic[1])
a<-table.row.end(a)
a<-table.row.start(a)
a<-table.element(a, 'F-TEST (DF numerator)',1,TRUE)
a<-table.element(a, mysum$fstatistic[2])
a<-table.row.end(a)
a<-table.row.start(a)
a<-table.element(a, 'F-TEST (DF denominator)',1,TRUE)
a<-table.element(a, mysum$fstatistic[3])
a<-table.row.end(a)
a<-table.row.start(a)
a<-table.element(a, 'p-value',1,TRUE)
a<-table.element(a, 1-pf(mysum$fstatistic[1],mysum$fstatistic[2],mysum$fstatistic[3]))
a<-table.row.end(a)
a<-table.row.start(a)
a<-table.element(a, 'Multiple Linear Regression - Residual Statistics', 2, TRUE)
a<-table.row.end(a)
a<-table.row.start(a)
a<-table.element(a, 'Residual Standard Deviation',1,TRUE)
a<-table.element(a, mysum$sigma)
a<-table.row.end(a)
a<-table.row.start(a)
a<-table.element(a, 'Sum Squared Residuals',1,TRUE)
a<-table.element(a, sum(myerror*myerror))
a<-table.row.end(a)
a<-table.end(a)
table.save(a,file='mytable3.tab')
a<-table.start()
a<-table.row.start(a)
a<-table.element(a, 'Multiple Linear Regression - Actuals, Interpolation, and Residuals', 4, TRUE)
a<-table.row.end(a)
a<-table.row.start(a)
a<-table.element(a, 'Time or Index', 1, TRUE)
a<-table.element(a, 'Actuals', 1, TRUE)
a<-table.element(a, 'Interpolation
Forecast', 1, TRUE)
a<-table.element(a, 'Residuals
Prediction Error', 1, TRUE)
a<-table.row.end(a)
for (i in 1:n) {
a<-table.row.start(a)
a<-table.element(a,i, 1, TRUE)
a<-table.element(a,x[i])
a<-table.element(a,x[i]-mysum$resid[i])
a<-table.element(a,mysum$resid[i])
a<-table.row.end(a)
}
a<-table.end(a)
table.save(a,file='mytable4.tab')
if (n > n25) {
a<-table.start()
a<-table.row.start(a)
a<-table.element(a,'Goldfeld-Quandt test for Heteroskedasticity',4,TRUE)
a<-table.row.end(a)
a<-table.row.start(a)
a<-table.element(a,'p-values',header=TRUE)
a<-table.element(a,'Alternative Hypothesis',3,header=TRUE)
a<-table.row.end(a)
a<-table.row.start(a)
a<-table.element(a,'breakpoint index',header=TRUE)
a<-table.element(a,'greater',header=TRUE)
a<-table.element(a,'2-sided',header=TRUE)
a<-table.element(a,'less',header=TRUE)
a<-table.row.end(a)
for (mypoint in kp3:nmkm3) {
a<-table.row.start(a)
a<-table.element(a,mypoint,header=TRUE)
a<-table.element(a,gqarr[mypoint-kp3+1,1])
a<-table.element(a,gqarr[mypoint-kp3+1,2])
a<-table.element(a,gqarr[mypoint-kp3+1,3])
a<-table.row.end(a)
}
a<-table.end(a)
table.save(a,file='mytable5.tab')
a<-table.start()
a<-table.row.start(a)
a<-table.element(a,'Meta Analysis of Goldfeld-Quandt test for Heteroskedasticity',4,TRUE)
a<-table.row.end(a)
a<-table.row.start(a)
a<-table.element(a,'Description',header=TRUE)
a<-table.element(a,'# significant tests',header=TRUE)
a<-table.element(a,'% significant tests',header=TRUE)
a<-table.element(a,'OK/NOK',header=TRUE)
a<-table.row.end(a)
a<-table.row.start(a)
a<-table.element(a,'1% type I error level',header=TRUE)
a<-table.element(a,numsignificant1)
a<-table.element(a,numsignificant1/numgqtests)
if (numsignificant1/numgqtests < 0.01) dum <- 'OK' else dum <- 'NOK'
a<-table.element(a,dum)
a<-table.row.end(a)
a<-table.row.start(a)
a<-table.element(a,'5% type I error level',header=TRUE)
a<-table.element(a,numsignificant5)
a<-table.element(a,numsignificant5/numgqtests)
if (numsignificant5/numgqtests < 0.05) dum <- 'OK' else dum <- 'NOK'
a<-table.element(a,dum)
a<-table.row.end(a)
a<-table.row.start(a)
a<-table.element(a,'10% type I error level',header=TRUE)
a<-table.element(a,numsignificant10)
a<-table.element(a,numsignificant10/numgqtests)
if (numsignificant10/numgqtests < 0.1) dum <- 'OK' else dum <- 'NOK'
a<-table.element(a,dum)
a<-table.row.end(a)
a<-table.end(a)
table.save(a,file='mytable6.tab')
}