| Multiple Linear Regression - Estimated Regression Equation |
| Yt[t] = + 2260.17634798631 + 0.0339916897977088`Yt-1`[t] + 0.0350118995045014`Yt-2`[t] + 0.112475389948693`Yt-3`[t] -0.0118409575464825`Yt-4`[t] + 0.316083003027646`Yt-5`[t] + 0.280257052615371`Yt-6`[t] -179.026837499072M1[t] + 129.398081382821M2[t] -238.937569078418M3[t] + 585.739880957251M4[t] + 356.88103897405M5[t] -33.0550838310867M6[t] + 33.6060774247566M7[t] -732.859928093813M8[t] -442.640351857356M9[t] -299.092191974960M10[t] -930.99474257794M11[t] + 5.03344278382246t + e[t] |
| Multiple Linear Regression - Ordinary Least Squares | |||||
| Variable | Parameter | S.D. | T-STAT H0: parameter = 0 | 2-tail p-value | 1-tail p-value |
| (Intercept) | 2260.17634798631 | 1654.976206 | 1.3657 | 0.17815 | 0.089075 |
| `Yt-1` | 0.0339916897977088 | 0.142601 | 0.2384 | 0.812569 | 0.406285 |
| `Yt-2` | 0.0350118995045014 | 0.138265 | 0.2532 | 0.801134 | 0.400567 |
| `Yt-3` | 0.112475389948693 | 0.141274 | 0.7961 | 0.429709 | 0.214854 |
| `Yt-4` | -0.0118409575464825 | 0.141917 | -0.0834 | 0.933838 | 0.466919 |
| `Yt-5` | 0.316083003027646 | 0.138898 | 2.2757 | 0.027186 | 0.013593 |
| `Yt-6` | 0.280257052615371 | 0.146375 | 1.9147 | 0.061267 | 0.030633 |
| M1 | -179.026837499072 | 259.767839 | -0.6892 | 0.493896 | 0.246948 |
| M2 | 129.398081382821 | 243.254589 | 0.5319 | 0.59712 | 0.29856 |
| M3 | -238.937569078418 | 204.957972 | -1.1658 | 0.249231 | 0.124616 |
| M4 | 585.739880957251 | 240.233465 | 2.4382 | 0.018356 | 0.009178 |
| M5 | 356.88103897405 | 288.871255 | 1.2354 | 0.222443 | 0.111221 |
| M6 | -33.0550838310867 | 227.53212 | -0.1453 | 0.885077 | 0.442538 |
| M7 | 33.6060774247566 | 226.529303 | 0.1484 | 0.882662 | 0.441331 |
| M8 | -732.859928093813 | 247.114973 | -2.9657 | 0.00462 | 0.00231 |
| M9 | -442.640351857356 | 212.508568 | -2.0829 | 0.042392 | 0.021196 |
| M10 | -299.092191974960 | 234.463331 | -1.2756 | 0.207976 | 0.103988 |
| M11 | -930.99474257794 | 233.06605 | -3.9946 | 0.000213 | 0.000106 |
| t | 5.03344278382246 | 2.594575 | 1.94 | 0.058032 | 0.029016 |
| Multiple Linear Regression - Regression Statistics | |
| Multiple R | 0.89795489295522 |
| R-squared | 0.80632298978222 |
| Adjusted R-squared | 0.73659926610382 |
| F-TEST (value) | 11.5645428448625 |
| F-TEST (DF numerator) | 18 |
| F-TEST (DF denominator) | 50 |
| p-value | 4.02222699591448e-12 |
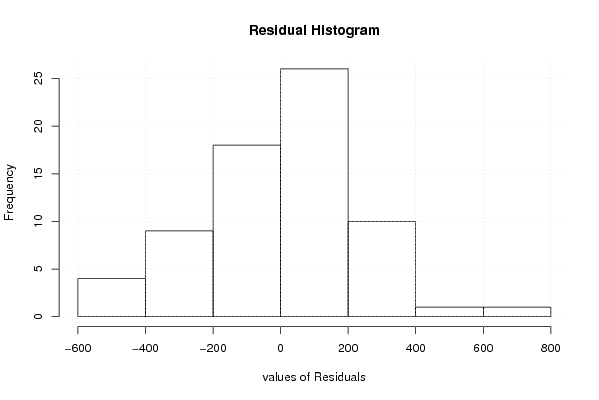
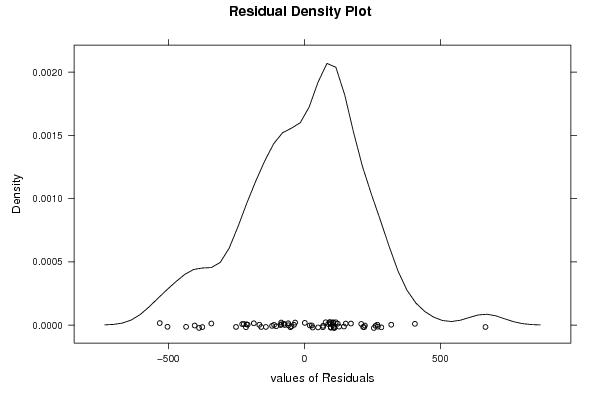
| Multiple Linear Regression - Residual Statistics | |
| Residual Standard Deviation | 257.046161709543 |
| Sum Squared Residuals | 3303636.46248043 |
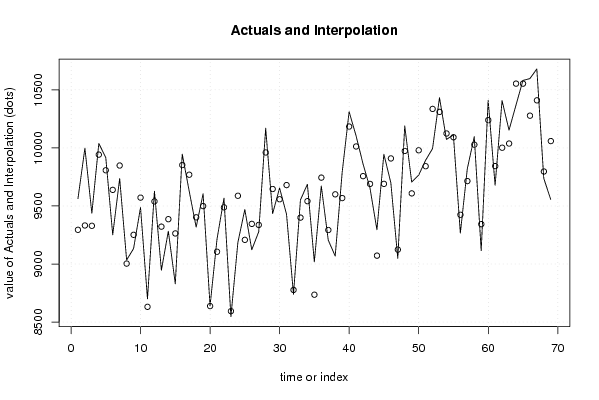
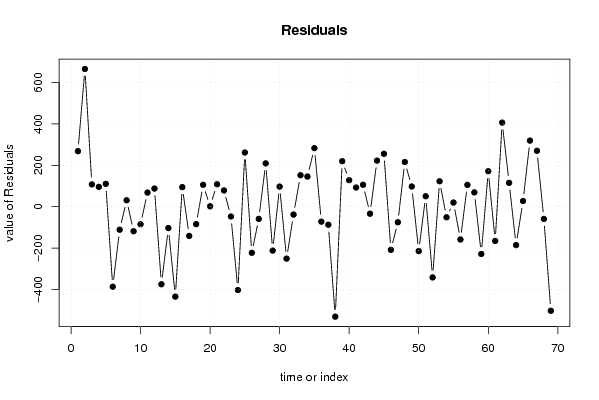
| Multiple Linear Regression - Actuals, Interpolation, and Residuals | |||
| Time or Index | Actuals | Interpolation Forecast | Residuals Prediction Error |
| 1 | 9563 | 9294.73089451871 | 268.269105481290 |
| 2 | 9998 | 9332.17665696794 | 665.82334303206 |
| 3 | 9437 | 9329.27829841387 | 107.721701586127 |
| 4 | 10038 | 9942.00555477032 | 95.9944452296773 |
| 5 | 9918 | 9807.5053636531 | 110.494636346909 |
| 6 | 9252 | 9638.82844584766 | -386.82844584766 |
| 7 | 9737 | 9848.3365645619 | -111.336564561896 |
| 8 | 9035 | 9004.04783721894 | 30.9521627810618 |
| 9 | 9133 | 9251.67344476305 | -118.673444763051 |
| 10 | 9487 | 9571.94904968688 | -84.9490496868766 |
| 11 | 8700 | 8631.70145172327 | 68.2985482767323 |
| 12 | 9627 | 9539.356389478 | 87.6436105220005 |
| 13 | 8947 | 9322.00920289051 | -375.009202890513 |
| 14 | 9283 | 9386.3350988341 | -103.335098834102 |
| 15 | 8829 | 9263.58810156527 | -434.588101565267 |
| 16 | 9947 | 9852.6246058825 | 94.3753941175044 |
| 17 | 9628 | 9769.1967390546 | -141.196739054611 |
| 18 | 9318 | 9402.41347057719 | -84.413470577186 |
| 19 | 9605 | 9499.1542287652 | 105.845771234796 |
| 20 | 8640 | 8638.17043852962 | 1.82956147038294 |
| 21 | 9214 | 9105.72388212366 | 108.276117876338 |
| 22 | 9567 | 9488.47827232477 | 78.5217276752287 |
| 23 | 8547 | 8594.38022448059 | -47.3802244805868 |
| 24 | 9185 | 9587.91962019485 | -402.919620194849 |
| 25 | 9470 | 9208.22156527509 | 261.778434724912 |
| 26 | 9123 | 9345.78398261948 | -222.783982619483 |
| 27 | 9278 | 9336.9469736957 | -58.946973695704 |
| 28 | 10170 | 9960.80448101153 | 209.195518988473 |
| 29 | 9434 | 9646.12164258592 | -212.121642585919 |
| 30 | 9655 | 9557.86184637367 | 97.1381536263316 |
| 31 | 9429 | 9679.98501318263 | -250.985013182631 |
| 32 | 8739 | 8777.00760542215 | -38.0076054221482 |
| 33 | 9552 | 9399.8515569829 | 152.148443017093 |
| 34 | 9687 | 9541.22610375494 | 145.773896245058 |
| 35 | 9019 | 8736.06373864074 | 282.936261359261 |
| 36 | 9672 | 9744.22688432985 | -72.2268843298488 |
| 37 | 9206 | 9293.16422736113 | -87.16422736113 |
| 38 | 9069 | 9600.51125735992 | -531.51125735992 |
| 39 | 9788 | 9568.1130214737 | 219.886978526304 |
| 40 | 10312 | 10184.0128881123 | 127.987111887713 |
| 41 | 10105 | 10012.4719377343 | 92.5280622656803 |
| 42 | 9863 | 9757.08440576917 | 105.915594230830 |
| 43 | 9656 | 9689.825855604 | -33.8258556040025 |
| 44 | 9295 | 9072.26552889588 | 222.734471104124 |
| 45 | 9946 | 9690.36443296323 | 255.635567036772 |
| 46 | 9701 | 9909.44394991723 | -208.44394991723 |
| 47 | 9049 | 9124.38179049164 | -75.381790491636 |
| 48 | 10190 | 9973.91415489793 | 216.085845102074 |
| 49 | 9706 | 9608.49341188038 | 97.5065881196241 |
| 50 | 9765 | 9979.61269234782 | -214.612692347825 |
| 51 | 9893 | 9842.4319647709 | 50.568035229107 |
| 52 | 9994 | 10335.8617787948 | -341.861778794762 |
| 53 | 10433 | 10310.2412430103 | 122.758756989679 |
| 54 | 10073 | 10124.2844736471 | -51.2844736471035 |
| 55 | 10112 | 10091.9611487737 | 20.0388512262703 |
| 56 | 9266 | 9424.4245280866 | -158.424528086600 |
| 57 | 9820 | 9714.39400691482 | 105.605993085182 |
| 58 | 10097 | 10027.9026243162 | 69.0973756838201 |
| 59 | 9115 | 9343.47279466377 | -228.472794663771 |
| 60 | 10411 | 10239.5829510994 | 171.417048900625 |
| 61 | 9678 | 9843.38069807418 | -165.380698074183 |
| 62 | 10408 | 10001.5803118707 | 406.419688129269 |
| 63 | 10153 | 10037.6416400806 | 115.358359919432 |
| 64 | 10368 | 10553.6906914286 | -185.690691428606 |
| 65 | 10581 | 10553.4630739617 | 27.5369260382612 |
| 66 | 10597 | 10277.5273577852 | 319.472642214788 |
| 67 | 10680 | 10409.7371891125 | 270.262810887464 |
| 68 | 9738 | 9797.08406184682 | -59.084061846821 |
| 69 | 9556 | 10058.9926762523 | -502.992676252335 |
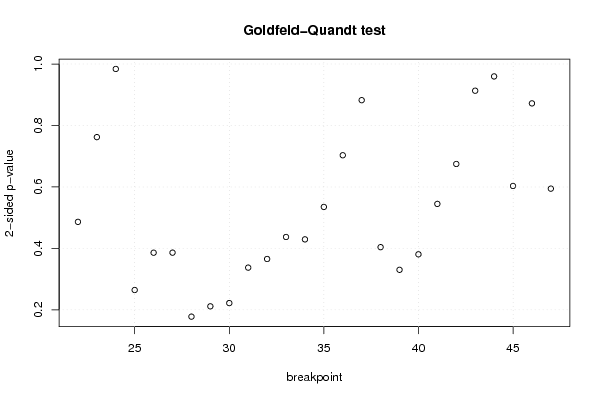
| Goldfeld-Quandt test for Heteroskedasticity | |||
| p-values | Alternative Hypothesis | ||
| breakpoint index | greater | 2-sided | less |
| 22 | 0.756857971051039 | 0.486284057897922 | 0.243142028948961 |
| 23 | 0.618942493574353 | 0.762115012851294 | 0.381057506425647 |
| 24 | 0.508026964785724 | 0.983946070428552 | 0.491973035214276 |
| 25 | 0.867705574184534 | 0.264588851630933 | 0.132294425815466 |
| 26 | 0.807016959499261 | 0.385966081001478 | 0.192983040500739 |
| 27 | 0.806941582230313 | 0.386116835539374 | 0.193058417769687 |
| 28 | 0.911055653506033 | 0.177888692987935 | 0.0889443464939675 |
| 29 | 0.89425453619561 | 0.211490927608782 | 0.105745463804391 |
| 30 | 0.888994745453795 | 0.222010509092409 | 0.111005254546205 |
| 31 | 0.831288966286403 | 0.337422067427193 | 0.168711033713597 |
| 32 | 0.817237631024834 | 0.365524737950332 | 0.182762368975166 |
| 33 | 0.781444975632371 | 0.437110048735258 | 0.218555024367629 |
| 34 | 0.785304710259178 | 0.429390579481644 | 0.214695289740822 |
| 35 | 0.732540612827975 | 0.534918774344049 | 0.267459387172025 |
| 36 | 0.64844062497472 | 0.703118750050559 | 0.351559375025280 |
| 37 | 0.558827483234755 | 0.88234503353049 | 0.441172516765245 |
| 38 | 0.79800451141597 | 0.403990977168060 | 0.201995488584030 |
| 39 | 0.834835101358848 | 0.330329797282304 | 0.165164898641152 |
| 40 | 0.809625956220405 | 0.380748087559189 | 0.190374043779595 |
| 41 | 0.727589447761097 | 0.544821104477806 | 0.272410552238903 |
| 42 | 0.66263860925443 | 0.674722781491139 | 0.337361390745569 |
| 43 | 0.543458829954104 | 0.913082340091792 | 0.456541170045896 |
| 44 | 0.479817645922724 | 0.959635291845449 | 0.520182354077276 |
| 45 | 0.698446612386114 | 0.603106775227771 | 0.301553387613886 |
| 46 | 0.564038921651274 | 0.871922156697453 | 0.435961078348726 |
| 47 | 0.702770487101843 | 0.594459025796314 | 0.297229512898157 |
| Meta Analysis of Goldfeld-Quandt test for Heteroskedasticity | |||
| Description | # significant tests | % significant tests | OK/NOK |
| 1% type I error level | 0 | 0 | OK |
| 5% type I error level | 0 | 0 | OK |
| 10% type I error level | 0 | 0 | OK |