| Multiple Linear Regression - Estimated Regression Equation |
| Y[t] = + 52.343 -1.67591666666668M1[t] -4.60283333333333M2[t] -5.28975M3[t] -4.92666666666667M4[t] -2.73958333333334M5[t] + 0.1875M6[t] + 1.90458333333333M7[t] + 3.65366666666667M8[t] + 3.35675M9[t] + 2.38183333333333M10[t] + 1.03891666666667M11[t] -0.0090833333333332t + e[t] |
| Multiple Linear Regression - Ordinary Least Squares | |||||
| Variable | Parameter | S.D. | T-STAT H0: parameter = 0 | 2-tail p-value | 1-tail p-value |
| (Intercept) | 52.343 | 5.196676 | 10.0724 | 0 | 0 |
| M1 | -1.67591666666668 | 6.322048 | -0.2651 | 0.792099 | 0.396049 |
| M2 | -4.60283333333333 | 6.312602 | -0.7291 | 0.469528 | 0.234764 |
| M3 | -5.28975 | 6.304044 | -0.8391 | 0.405659 | 0.202829 |
| M4 | -4.92666666666667 | 6.296376 | -0.7825 | 0.437869 | 0.218934 |
| M5 | -2.73958333333334 | 6.289604 | -0.4356 | 0.66514 | 0.33257 |
| M6 | 0.1875 | 6.283728 | 0.0298 | 0.976322 | 0.488161 |
| M7 | 1.90458333333333 | 6.278752 | 0.3033 | 0.762971 | 0.381486 |
| M8 | 3.65366666666667 | 6.274677 | 0.5823 | 0.563156 | 0.281578 |
| M9 | 3.35675 | 6.271507 | 0.5352 | 0.595009 | 0.297504 |
| M10 | 2.38183333333333 | 6.269241 | 0.3799 | 0.705713 | 0.352857 |
| M11 | 1.03891666666667 | 6.267881 | 0.1658 | 0.869063 | 0.434531 |
| t | -0.0090833333333332 | 0.075385 | -0.1205 | 0.904607 | 0.452304 |
| Multiple Linear Regression - Regression Statistics | |
| Multiple R | 0.33108746990791 |
| R-squared | 0.109618912730021 |
| Adjusted R-squared | -0.117712428700611 |
| F-TEST (value) | 0.482198855820635 |
| F-TEST (DF numerator) | 12 |
| F-TEST (DF denominator) | 47 |
| p-value | 0.915130339062477 |
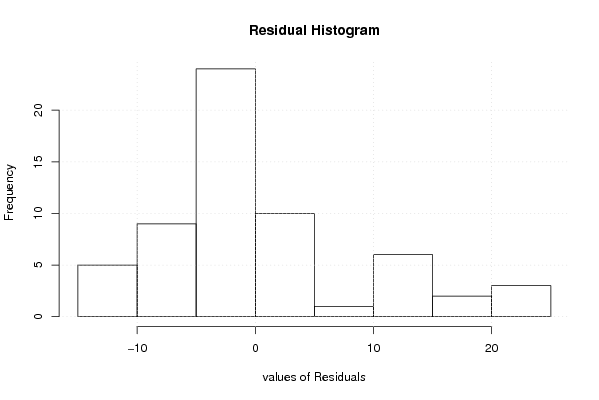
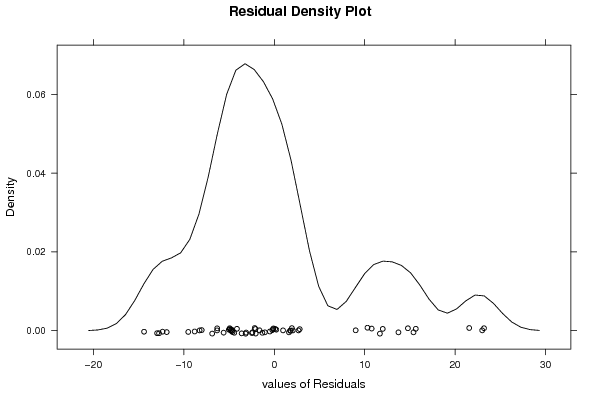
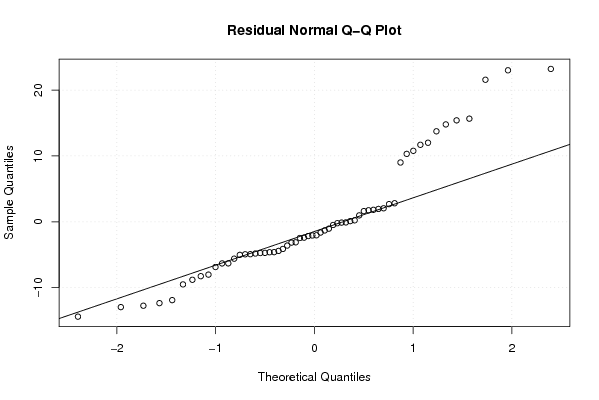
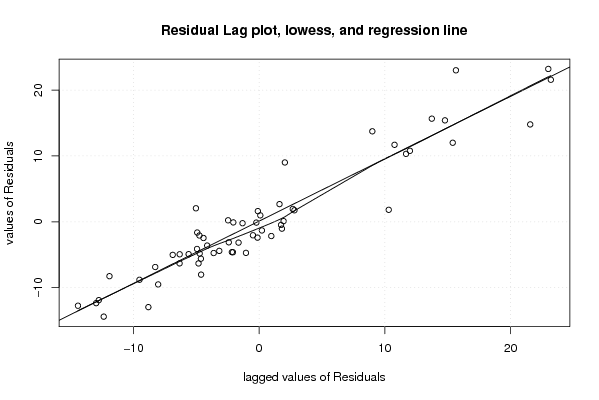
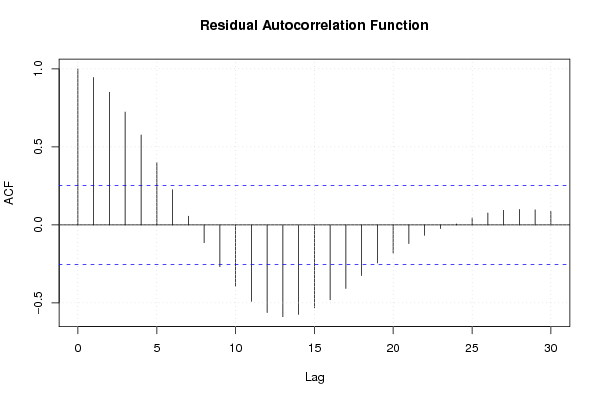
| Multiple Linear Regression - Residual Statistics | |
| Residual Standard Deviation | 9.90967294477171 |
| Sum Squared Residuals | 4615.47604 |
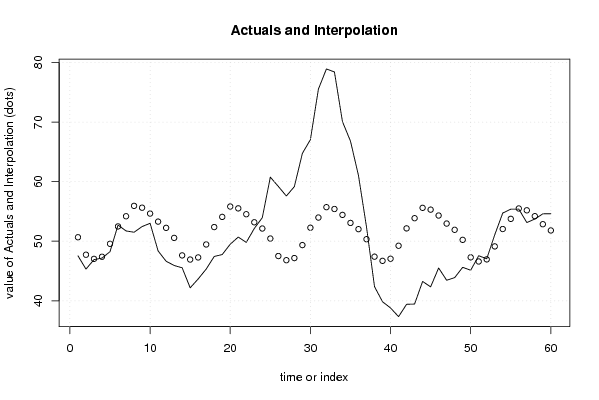
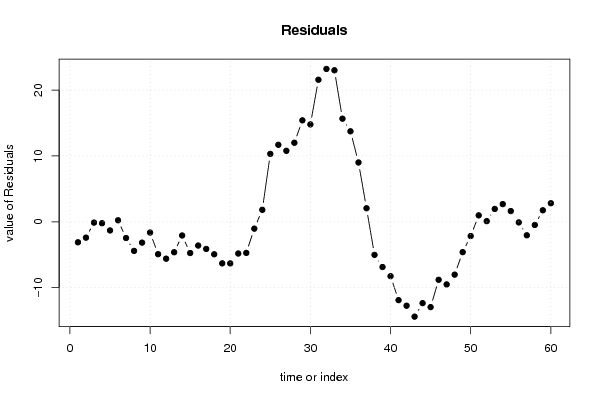
| Multiple Linear Regression - Actuals, Interpolation, and Residuals | |||
| Time or Index | Actuals | Interpolation Forecast | Residuals Prediction Error |
| 1 | 47.54 | 50.6580000000001 | -3.11800000000007 |
| 2 | 45.31 | 47.722 | -2.41199999999999 |
| 3 | 46.9 | 47.026 | -0.126 |
| 4 | 47.16 | 47.38 | -0.22 |
| 5 | 48.24 | 49.558 | -1.31799999999999 |
| 6 | 52.7 | 52.476 | 0.224000000000006 |
| 7 | 51.72 | 54.184 | -2.464 |
| 8 | 51.5 | 55.924 | -4.424 |
| 9 | 52.45 | 55.618 | -3.16799999999999 |
| 10 | 53 | 54.634 | -1.63399999999999 |
| 11 | 48.36 | 53.282 | -4.922 |
| 12 | 46.63 | 52.234 | -5.604 |
| 13 | 45.92 | 50.549 | -4.62899999999998 |
| 14 | 45.53 | 47.613 | -2.08299999999999 |
| 15 | 42.17 | 46.917 | -4.747 |
| 16 | 43.66 | 47.271 | -3.611 |
| 17 | 45.32 | 49.449 | -4.129 |
| 18 | 47.43 | 52.367 | -4.937 |
| 19 | 47.76 | 54.075 | -6.315 |
| 20 | 49.49 | 55.815 | -6.325 |
| 21 | 50.69 | 55.509 | -4.819 |
| 22 | 49.8 | 54.525 | -4.725 |
| 23 | 52.13 | 53.173 | -1.043 |
| 24 | 53.94 | 52.125 | 1.815 |
| 25 | 60.75 | 50.44 | 10.31 |
| 26 | 59.19 | 47.504 | 11.686 |
| 27 | 57.58 | 46.808 | 10.772 |
| 28 | 59.16 | 47.162 | 11.998 |
| 29 | 64.74 | 49.34 | 15.4 |
| 30 | 67.04 | 52.258 | 14.782 |
| 31 | 75.53 | 53.966 | 21.564 |
| 32 | 78.91 | 55.706 | 23.204 |
| 33 | 78.4 | 55.4 | 23 |
| 34 | 70.07 | 54.416 | 15.654 |
| 35 | 66.8 | 53.064 | 13.736 |
| 36 | 61.02 | 52.016 | 9.004 |
| 37 | 52.38 | 50.331 | 2.04900000000002 |
| 38 | 42.37 | 47.395 | -5.025 |
| 39 | 39.83 | 46.699 | -6.869 |
| 40 | 38.79 | 47.053 | -8.263 |
| 41 | 37.33 | 49.231 | -11.901 |
| 42 | 39.4 | 52.149 | -12.749 |
| 43 | 39.45 | 53.857 | -14.407 |
| 44 | 43.24 | 55.597 | -12.357 |
| 45 | 42.33 | 55.291 | -12.961 |
| 46 | 45.5 | 54.307 | -8.807 |
| 47 | 43.44 | 52.955 | -9.515 |
| 48 | 43.88 | 51.907 | -8.027 |
| 49 | 45.61 | 50.222 | -4.61199999999999 |
| 50 | 45.12 | 47.286 | -2.166 |
| 51 | 47.56 | 46.59 | 0.97 |
| 52 | 47.04 | 46.944 | 0.096 |
| 53 | 51.07 | 49.122 | 1.948 |
| 54 | 54.72 | 52.04 | 2.67999999999999 |
| 55 | 55.37 | 53.748 | 1.62199999999999 |
| 56 | 55.39 | 55.488 | -0.0980000000000038 |
| 57 | 53.13 | 55.182 | -2.052 |
| 58 | 53.71 | 54.198 | -0.488000000000001 |
| 59 | 54.59 | 52.846 | 1.744 |
| 60 | 54.61 | 51.798 | 2.812 |
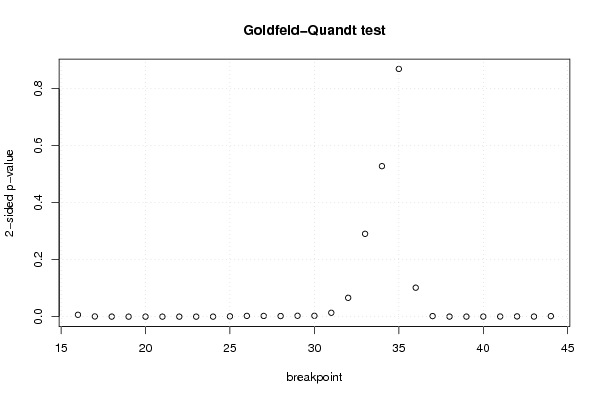
| Goldfeld-Quandt test for Heteroskedasticity | |||
| p-values | Alternative Hypothesis | ||
| breakpoint index | greater | 2-sided | less |
| 16 | 0.00324452342321297 | 0.00648904684642594 | 0.996755476576787 |
| 17 | 0.000366084423135861 | 0.000732168846271721 | 0.999633915576864 |
| 18 | 9.24489227592348e-05 | 0.00018489784551847 | 0.99990755107724 |
| 19 | 1.25919998219168e-05 | 2.51839996438336e-05 | 0.999987408000178 |
| 20 | 1.86404837771764e-06 | 3.72809675543528e-06 | 0.999998135951622 |
| 21 | 2.90114981394929e-07 | 5.80229962789857e-07 | 0.999999709885019 |
| 22 | 3.94367717428555e-08 | 7.8873543485711e-08 | 0.999999960563228 |
| 23 | 6.11942359944378e-07 | 1.22388471988876e-06 | 0.99999938805764 |
| 24 | 9.41230539502044e-06 | 1.88246107900409e-05 | 0.999990587694605 |
| 25 | 0.000589289885324769 | 0.00117857977064954 | 0.999410710114675 |
| 26 | 0.00129231285823392 | 0.00258462571646785 | 0.998707687141766 |
| 27 | 0.00123522542212894 | 0.00247045084425788 | 0.998764774577871 |
| 28 | 0.00103740806870018 | 0.00207481613740037 | 0.9989625919313 |
| 29 | 0.001513520857597 | 0.00302704171519401 | 0.998486479142403 |
| 30 | 0.0014677773801284 | 0.00293555476025679 | 0.998532222619872 |
| 31 | 0.00681973853657771 | 0.0136394770731554 | 0.993180261463422 |
| 32 | 0.0330408840625003 | 0.0660817681250006 | 0.9669591159375 |
| 33 | 0.145224012310814 | 0.290448024621627 | 0.854775987689186 |
| 34 | 0.263897683277766 | 0.527795366555532 | 0.736102316722234 |
| 35 | 0.565668009021137 | 0.868663981957726 | 0.434331990978863 |
| 36 | 0.949241384708272 | 0.101517230583456 | 0.0507586152917282 |
| 37 | 0.999009396686732 | 0.0019812066265349 | 0.000990603313267448 |
| 38 | 0.99991576754796 | 0.000168464904080499 | 8.42324520402495e-05 |
| 39 | 0.99992183626436 | 0.000156327471279261 | 7.81637356396307e-05 |
| 40 | 0.999909592917656 | 0.000180814164688904 | 9.0407082344452e-05 |
| 41 | 0.999742808199005 | 0.000514383601990492 | 0.000257191800995246 |
| 42 | 0.99954061260218 | 0.000918774795639888 | 0.000459387397819944 |
| 43 | 0.999836490975601 | 0.000327018048797228 | 0.000163509024398614 |
| 44 | 0.999128935202185 | 0.00174212959562952 | 0.00087106479781476 |
| Meta Analysis of Goldfeld-Quandt test for Heteroskedasticity | |||
| Description | # significant tests | % significant tests | OK/NOK |
| 1% type I error level | 23 | 0.793103448275862 | NOK |
| 5% type I error level | 24 | 0.827586206896552 | NOK |
| 10% type I error level | 25 | 0.862068965517241 | NOK |