| Multiple Linear Regression - Estimated Regression Equation |
| Y[t] = + 5201.6 -157.600000000001M1[t] -451.2M2[t] -520.8M3[t] -485.4M4[t] -267.6M5[t] + 24.1999999999999M6[t] + 195M7[t] + 369M8[t] + 338.4M9[t] + 240M10[t] + 104.8M11[t] + e[t] |
| Multiple Linear Regression - Ordinary Least Squares | |||||
| Variable | Parameter | S.D. | T-STAT H0: parameter = 0 | 2-tail p-value | 1-tail p-value |
| (Intercept) | 5201.6 | 438.601079 | 11.8595 | 0 | 0 |
| M1 | -157.600000000001 | 620.275595 | -0.2541 | 0.800519 | 0.400259 |
| M2 | -451.2 | 620.275595 | -0.7274 | 0.470503 | 0.235251 |
| M3 | -520.8 | 620.275595 | -0.8396 | 0.40528 | 0.20264 |
| M4 | -485.4 | 620.275595 | -0.7826 | 0.437732 | 0.218866 |
| M5 | -267.6 | 620.275595 | -0.4314 | 0.668094 | 0.334047 |
| M6 | 24.1999999999999 | 620.275595 | 0.039 | 0.96904 | 0.48452 |
| M7 | 195 | 620.275595 | 0.3144 | 0.754598 | 0.377299 |
| M8 | 369 | 620.275595 | 0.5949 | 0.554707 | 0.277353 |
| M9 | 338.4 | 620.275595 | 0.5456 | 0.587892 | 0.293946 |
| M10 | 240 | 620.275595 | 0.3869 | 0.700522 | 0.350261 |
| M11 | 104.8 | 620.275595 | 0.169 | 0.86654 | 0.43327 |
| Multiple Linear Regression - Regression Statistics | |
| Multiple R | 0.330671852624358 |
| R-squared | 0.109343874118025 |
| Adjusted R-squared | -0.094764821396594 |
| F-TEST (value) | 0.535713943212153 |
| F-TEST (DF numerator) | 11 |
| F-TEST (DF denominator) | 48 |
| p-value | 0.869091752881583 |
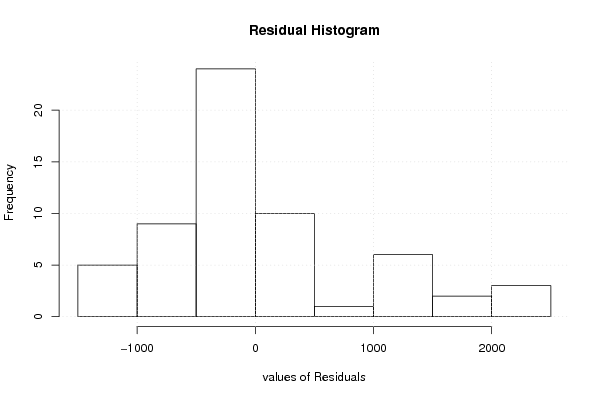
| Multiple Linear Regression - Residual Statistics | |
| Residual Standard Deviation | 980.741828073695 |
| Sum Squared Residuals | 46169017.6 |
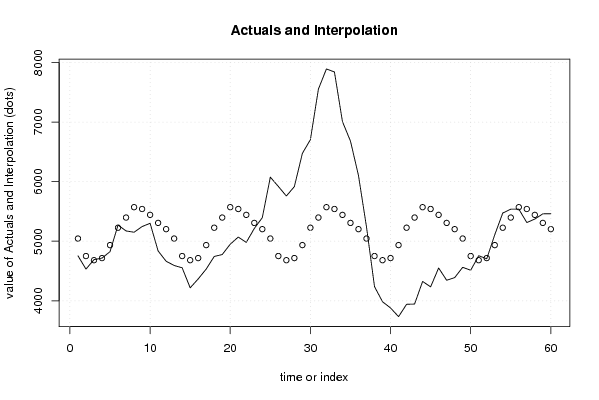
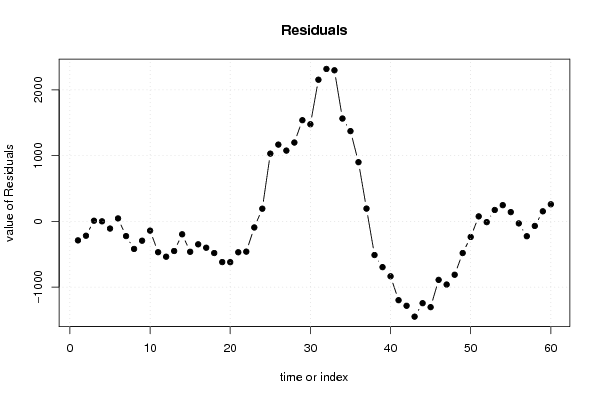
| Multiple Linear Regression - Actuals, Interpolation, and Residuals | |||
| Time or Index | Actuals | Interpolation Forecast | Residuals Prediction Error |
| 1 | 4754 | 5044 | -290.000000000002 |
| 2 | 4531 | 4750.4 | -219.4 |
| 3 | 4690 | 4680.8 | 9.19999999999978 |
| 4 | 4716 | 4716.2 | -0.199999999999998 |
| 5 | 4824 | 4934 | -110 |
| 6 | 5270 | 5225.8 | 44.2000000000003 |
| 7 | 5172 | 5396.6 | -224.6 |
| 8 | 5150 | 5570.6 | -420.6 |
| 9 | 5245 | 5540 | -295 |
| 10 | 5300 | 5441.6 | -141.6 |
| 11 | 4836 | 5306.4 | -470.4 |
| 12 | 4663 | 5201.6 | -538.6 |
| 13 | 4592 | 5044 | -451.999999999999 |
| 14 | 4553 | 4750.4 | -197.4 |
| 15 | 4217 | 4680.8 | -463.8 |
| 16 | 4366 | 4716.2 | -350.2 |
| 17 | 4532 | 4934 | -402 |
| 18 | 4743 | 5225.8 | -482.8 |
| 19 | 4776 | 5396.6 | -620.6 |
| 20 | 4949 | 5570.6 | -621.6 |
| 21 | 5069 | 5540 | -471 |
| 22 | 4980 | 5441.6 | -461.6 |
| 23 | 5213 | 5306.4 | -93.4 |
| 24 | 5394 | 5201.6 | 192.4 |
| 25 | 6075 | 5044 | 1031 |
| 26 | 5919 | 4750.4 | 1168.6 |
| 27 | 5758 | 4680.8 | 1077.2 |
| 28 | 5916 | 4716.2 | 1199.8 |
| 29 | 6474 | 4934 | 1540 |
| 30 | 6704 | 5225.8 | 1478.2 |
| 31 | 7553 | 5396.6 | 2156.4 |
| 32 | 7891 | 5570.6 | 2320.4 |
| 33 | 7840 | 5540 | 2300 |
| 34 | 7007 | 5441.6 | 1565.4 |
| 35 | 6680 | 5306.4 | 1373.6 |
| 36 | 6102 | 5201.6 | 900.4 |
| 37 | 5238 | 5044 | 194 |
| 38 | 4237 | 4750.4 | -513.4 |
| 39 | 3983 | 4680.8 | -697.8 |
| 40 | 3879 | 4716.2 | -837.2 |
| 41 | 3733 | 4934 | -1201 |
| 42 | 3940 | 5225.8 | -1285.8 |
| 43 | 3945 | 5396.6 | -1451.6 |
| 44 | 4324 | 5570.6 | -1246.6 |
| 45 | 4233 | 5540 | -1307 |
| 46 | 4550 | 5441.6 | -891.6 |
| 47 | 4344 | 5306.4 | -962.4 |
| 48 | 4388 | 5201.6 | -813.6 |
| 49 | 4561 | 5044 | -482.999999999999 |
| 50 | 4512 | 4750.4 | -238.4 |
| 51 | 4756 | 4680.8 | 75.2 |
| 52 | 4704 | 4716.2 | -12.2 |
| 53 | 5107 | 4934 | 173 |
| 54 | 5472 | 5225.8 | 246.2 |
| 55 | 5537 | 5396.6 | 140.4 |
| 56 | 5539 | 5570.6 | -31.6 |
| 57 | 5313 | 5540 | -227 |
| 58 | 5371 | 5441.6 | -70.6 |
| 59 | 5459 | 5306.4 | 152.6 |
| 60 | 5461 | 5201.6 | 259.4 |
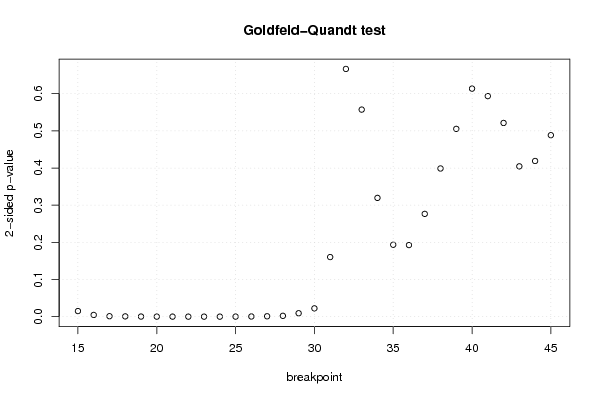
| Goldfeld-Quandt test for Heteroskedasticity | |||
| p-values | Alternative Hypothesis | ||
| breakpoint index | greater | 2-sided | less |
| 15 | 0.00754306650143446 | 0.0150861330028689 | 0.992456933498566 |
| 16 | 0.00231920435004474 | 0.00463840870008949 | 0.997680795649955 |
| 17 | 0.000592129497563979 | 0.00118425899512796 | 0.999407870502436 |
| 18 | 0.000367817161777738 | 0.000735634323555477 | 0.999632182838222 |
| 19 | 0.000131941218358315 | 0.000263882436716629 | 0.999868058781642 |
| 20 | 3.04473499258097e-05 | 6.08946998516194e-05 | 0.999969552650074 |
| 21 | 6.39228931629099e-06 | 1.2784578632582e-05 | 0.999993607710684 |
| 22 | 1.8017560271664e-06 | 3.6035120543328e-06 | 0.999998198243973 |
| 23 | 5.80957123210544e-07 | 1.16191424642109e-06 | 0.999999419042877 |
| 24 | 7.83306825342432e-07 | 1.56661365068486e-06 | 0.999999216693175 |
| 25 | 4.03476967523565e-05 | 8.0695393504713e-05 | 0.999959652303248 |
| 26 | 0.000221460190973714 | 0.000442920381947428 | 0.999778539809026 |
| 27 | 0.000508471629975747 | 0.00101694325995149 | 0.999491528370024 |
| 28 | 0.00110464235655415 | 0.00220928471310831 | 0.998895357643446 |
| 29 | 0.00458136600925779 | 0.00916273201851558 | 0.995418633990742 |
| 30 | 0.0111573001819087 | 0.0223146003638173 | 0.98884269981809 |
| 31 | 0.0801814803586917 | 0.160362960717383 | 0.919818519641308 |
| 32 | 0.333286279867146 | 0.666572559734291 | 0.666713720132854 |
| 33 | 0.721405651857533 | 0.557188696284934 | 0.278594348142467 |
| 34 | 0.840211213346461 | 0.319577573307078 | 0.159788786653539 |
| 35 | 0.903265640752592 | 0.193468718494816 | 0.096734359247408 |
| 36 | 0.90365980458539 | 0.192680390829219 | 0.0963401954146093 |
| 37 | 0.861711002744547 | 0.276577994510905 | 0.138288997255453 |
| 38 | 0.800634061685778 | 0.398731876628443 | 0.199365938314222 |
| 39 | 0.747330774873059 | 0.505338450253882 | 0.252669225126941 |
| 40 | 0.693211670208565 | 0.61357665958287 | 0.306788329791435 |
| 41 | 0.703264443624475 | 0.593471112751049 | 0.296735556375525 |
| 42 | 0.739385853516219 | 0.521228292967563 | 0.260614146483781 |
| 43 | 0.797755543691654 | 0.404488912616692 | 0.202244456308346 |
| 44 | 0.790545686185878 | 0.418908627628244 | 0.209454313814122 |
| 45 | 0.755849589570002 | 0.488300820859996 | 0.244150410429998 |
| Meta Analysis of Goldfeld-Quandt test for Heteroskedasticity | |||
| Description | # significant tests | % significant tests | OK/NOK |
| 1% type I error level | 14 | 0.451612903225806 | NOK |
| 5% type I error level | 16 | 0.516129032258065 | NOK |
| 10% type I error level | 16 | 0.516129032258065 | NOK |