Free Statistics

of Irreproducible Research!

Author's title

Author*The author of this computation has been verified*
R Software Modulerwasp_multipleregression.wasp
Title produced by softwareMultiple Regression
Date of computationSat, 27 Nov 2010 17:25:01 +0000
Cite this page as followsStatistical Computations at FreeStatistics.org, Office for Research Development and Education, URL https://freestatistics.org/blog/index.php?v=date/2010/Nov/27/t1290878581clnucj6wtjy5hdp.htm/, Retrieved Mon, 29 Apr 2024 14:18:41 +0000
Statistical Computations at FreeStatistics.org, Office for Research Development and Education, URL https://freestatistics.org/blog/index.php?pk=102416, Retrieved Mon, 29 Apr 2024 14:18:41 +0000
QR Codes:

Original text written by user:
IsPrivate?No (this computation is public)
User-defined keywords
Estimated Impact101
Family? (F = Feedback message, R = changed R code, M = changed R Module, P = changed Parameters, D = changed Data)
-     [Multiple Regression] [Q1 The Seatbeltlaw] [2007-11-14 19:27:43] [8cd6641b921d30ebe00b648d1481bba0]
- RMPD  [Multiple Regression] [Seatbelt] [2009-11-12 13:54:52] [b98453cac15ba1066b407e146608df68]
-    D      [Multiple Regression] [] [2010-11-27 17:25:01] [558c060a42ec367ec2c020fab85c25c7] [Current]
Feedback Forum

Post a new message
Dataseries X:
4754
4531
4690
4716
4824
5270
5172
5150
5245
5300
4836
4663
4592
4553
4217
4366
4532
4743
4776
4949
5069
4980
5213
5394
6075
5919
5758
5916
6474
6704
7553
7891
7840
7007
6680
6102
5238
4237
3983
3879
3733
3940
3945
4324
4233
4550
4344
4388
4561
4512
4756
4704
5107
5472
5537
5539
5313
5371
5459
5461


Summary of computational transaction
Raw Inputview raw input (R code)
Raw Outputview raw output of R engine
Computing time7 seconds
R Server'RServer@AstonUniversity' @ vre.aston.ac.uk

\begin{tabular}{lllllllll}
\hline
Summary of computational transaction \tabularnewline
Raw Input & view raw input (R code)  \tabularnewline
Raw Output & view raw output of R engine  \tabularnewline
Computing time & 7 seconds \tabularnewline
R Server & 'RServer@AstonUniversity' @ vre.aston.ac.uk \tabularnewline
\hline
\end{tabular}
%Source: https://freestatistics.org/blog/index.php?pk=102416&T=0

[TABLE]
[ROW][C]Summary of computational transaction[/C][/ROW]
[ROW][C]Raw Input[/C][C]view raw input (R code) [/C][/ROW]
[ROW][C]Raw Output[/C][C]view raw output of R engine [/C][/ROW]
[ROW][C]Computing time[/C][C]7 seconds[/C][/ROW]
[ROW][C]R Server[/C][C]'RServer@AstonUniversity' @ vre.aston.ac.uk[/C][/ROW]
[/TABLE]
Source: https://freestatistics.org/blog/index.php?pk=102416&T=0

Globally Unique Identifier (entire table): ba.freestatistics.org/blog/index.php?pk=102416&T=0

As an alternative you can also use a QR Code:  

The GUIDs for individual cells are displayed in the table below:

Summary of computational transaction
Raw Inputview raw input (R code)
Raw Outputview raw output of R engine
Computing time7 seconds
R Server'RServer@AstonUniversity' @ vre.aston.ac.uk


Multiple Linear Regression - Estimated Regression Equation
Y[t] = + 5201.6 -157.600000000001M1[t] -451.2M2[t] -520.8M3[t] -485.4M4[t] -267.6M5[t] + 24.1999999999999M6[t] + 195M7[t] + 369M8[t] + 338.4M9[t] + 240M10[t] + 104.8M11[t] + e[t]

\begin{tabular}{lllllllll}
\hline
Multiple Linear Regression - Estimated Regression Equation \tabularnewline
Y[t] =  +  5201.6 -157.600000000001M1[t] -451.2M2[t] -520.8M3[t] -485.4M4[t] -267.6M5[t] +  24.1999999999999M6[t] +  195M7[t] +  369M8[t] +  338.4M9[t] +  240M10[t] +  104.8M11[t]  + e[t] \tabularnewline
\hline
\end{tabular}
%Source: https://freestatistics.org/blog/index.php?pk=102416&T=1

[TABLE]
[ROW][C]Multiple Linear Regression - Estimated Regression Equation[/C][/ROW]
[ROW][C]Y[t] =  +  5201.6 -157.600000000001M1[t] -451.2M2[t] -520.8M3[t] -485.4M4[t] -267.6M5[t] +  24.1999999999999M6[t] +  195M7[t] +  369M8[t] +  338.4M9[t] +  240M10[t] +  104.8M11[t]  + e[t][/C][/ROW]
[/TABLE]
Source: https://freestatistics.org/blog/index.php?pk=102416&T=1

Globally Unique Identifier (entire table): ba.freestatistics.org/blog/index.php?pk=102416&T=1

As an alternative you can also use a QR Code:  

The GUIDs for individual cells are displayed in the table below:

Multiple Linear Regression - Estimated Regression Equation
Y[t] = + 5201.6 -157.600000000001M1[t] -451.2M2[t] -520.8M3[t] -485.4M4[t] -267.6M5[t] + 24.1999999999999M6[t] + 195M7[t] + 369M8[t] + 338.4M9[t] + 240M10[t] + 104.8M11[t] + e[t]


Multiple Linear Regression - Ordinary Least Squares
VariableParameterS.D.T-STATH0: parameter = 02-tail p-value1-tail p-value
(Intercept)5201.6438.60107911.859500
M1-157.600000000001620.275595-0.25410.8005190.400259
M2-451.2620.275595-0.72740.4705030.235251
M3-520.8620.275595-0.83960.405280.20264
M4-485.4620.275595-0.78260.4377320.218866
M5-267.6620.275595-0.43140.6680940.334047
M624.1999999999999620.2755950.0390.969040.48452
M7195620.2755950.31440.7545980.377299
M8369620.2755950.59490.5547070.277353
M9338.4620.2755950.54560.5878920.293946
M10240620.2755950.38690.7005220.350261
M11104.8620.2755950.1690.866540.43327

\begin{tabular}{lllllllll}
\hline
Multiple Linear Regression - Ordinary Least Squares \tabularnewline
Variable & Parameter & S.D. & T-STATH0: parameter = 0 & 2-tail p-value & 1-tail p-value \tabularnewline
(Intercept) & 5201.6 & 438.601079 & 11.8595 & 0 & 0 \tabularnewline
M1 & -157.600000000001 & 620.275595 & -0.2541 & 0.800519 & 0.400259 \tabularnewline
M2 & -451.2 & 620.275595 & -0.7274 & 0.470503 & 0.235251 \tabularnewline
M3 & -520.8 & 620.275595 & -0.8396 & 0.40528 & 0.20264 \tabularnewline
M4 & -485.4 & 620.275595 & -0.7826 & 0.437732 & 0.218866 \tabularnewline
M5 & -267.6 & 620.275595 & -0.4314 & 0.668094 & 0.334047 \tabularnewline
M6 & 24.1999999999999 & 620.275595 & 0.039 & 0.96904 & 0.48452 \tabularnewline
M7 & 195 & 620.275595 & 0.3144 & 0.754598 & 0.377299 \tabularnewline
M8 & 369 & 620.275595 & 0.5949 & 0.554707 & 0.277353 \tabularnewline
M9 & 338.4 & 620.275595 & 0.5456 & 0.587892 & 0.293946 \tabularnewline
M10 & 240 & 620.275595 & 0.3869 & 0.700522 & 0.350261 \tabularnewline
M11 & 104.8 & 620.275595 & 0.169 & 0.86654 & 0.43327 \tabularnewline
\hline
\end{tabular}
%Source: https://freestatistics.org/blog/index.php?pk=102416&T=2

[TABLE]
[ROW][C]Multiple Linear Regression - Ordinary Least Squares[/C][/ROW]
[ROW][C]Variable[/C][C]Parameter[/C][C]S.D.[/C][C]T-STATH0: parameter = 0[/C][C]2-tail p-value[/C][C]1-tail p-value[/C][/ROW]
[ROW][C](Intercept)[/C][C]5201.6[/C][C]438.601079[/C][C]11.8595[/C][C]0[/C][C]0[/C][/ROW]
[ROW][C]M1[/C][C]-157.600000000001[/C][C]620.275595[/C][C]-0.2541[/C][C]0.800519[/C][C]0.400259[/C][/ROW]
[ROW][C]M2[/C][C]-451.2[/C][C]620.275595[/C][C]-0.7274[/C][C]0.470503[/C][C]0.235251[/C][/ROW]
[ROW][C]M3[/C][C]-520.8[/C][C]620.275595[/C][C]-0.8396[/C][C]0.40528[/C][C]0.20264[/C][/ROW]
[ROW][C]M4[/C][C]-485.4[/C][C]620.275595[/C][C]-0.7826[/C][C]0.437732[/C][C]0.218866[/C][/ROW]
[ROW][C]M5[/C][C]-267.6[/C][C]620.275595[/C][C]-0.4314[/C][C]0.668094[/C][C]0.334047[/C][/ROW]
[ROW][C]M6[/C][C]24.1999999999999[/C][C]620.275595[/C][C]0.039[/C][C]0.96904[/C][C]0.48452[/C][/ROW]
[ROW][C]M7[/C][C]195[/C][C]620.275595[/C][C]0.3144[/C][C]0.754598[/C][C]0.377299[/C][/ROW]
[ROW][C]M8[/C][C]369[/C][C]620.275595[/C][C]0.5949[/C][C]0.554707[/C][C]0.277353[/C][/ROW]
[ROW][C]M9[/C][C]338.4[/C][C]620.275595[/C][C]0.5456[/C][C]0.587892[/C][C]0.293946[/C][/ROW]
[ROW][C]M10[/C][C]240[/C][C]620.275595[/C][C]0.3869[/C][C]0.700522[/C][C]0.350261[/C][/ROW]
[ROW][C]M11[/C][C]104.8[/C][C]620.275595[/C][C]0.169[/C][C]0.86654[/C][C]0.43327[/C][/ROW]
[/TABLE]
Source: https://freestatistics.org/blog/index.php?pk=102416&T=2

Globally Unique Identifier (entire table): ba.freestatistics.org/blog/index.php?pk=102416&T=2

As an alternative you can also use a QR Code:  

The GUIDs for individual cells are displayed in the table below:

Multiple Linear Regression - Ordinary Least Squares
VariableParameterS.D.T-STATH0: parameter = 02-tail p-value1-tail p-value
(Intercept)5201.6438.60107911.859500
M1-157.600000000001620.275595-0.25410.8005190.400259
M2-451.2620.275595-0.72740.4705030.235251
M3-520.8620.275595-0.83960.405280.20264
M4-485.4620.275595-0.78260.4377320.218866
M5-267.6620.275595-0.43140.6680940.334047
M624.1999999999999620.2755950.0390.969040.48452
M7195620.2755950.31440.7545980.377299
M8369620.2755950.59490.5547070.277353
M9338.4620.2755950.54560.5878920.293946
M10240620.2755950.38690.7005220.350261
M11104.8620.2755950.1690.866540.43327


Multiple Linear Regression - Regression Statistics
Multiple R0.330671852624358
R-squared0.109343874118025
Adjusted R-squared-0.094764821396594
F-TEST (value)0.535713943212153
F-TEST (DF numerator)11
F-TEST (DF denominator)48
p-value0.869091752881583
Multiple Linear Regression - Residual Statistics
Residual Standard Deviation980.741828073695
Sum Squared Residuals46169017.6

\begin{tabular}{lllllllll}
\hline
Multiple Linear Regression - Regression Statistics \tabularnewline
Multiple R & 0.330671852624358 \tabularnewline
R-squared & 0.109343874118025 \tabularnewline
Adjusted R-squared & -0.094764821396594 \tabularnewline
F-TEST (value) & 0.535713943212153 \tabularnewline
F-TEST (DF numerator) & 11 \tabularnewline
F-TEST (DF denominator) & 48 \tabularnewline
p-value & 0.869091752881583 \tabularnewline
Multiple Linear Regression - Residual Statistics \tabularnewline
Residual Standard Deviation & 980.741828073695 \tabularnewline
Sum Squared Residuals & 46169017.6 \tabularnewline
\hline
\end{tabular}
%Source: https://freestatistics.org/blog/index.php?pk=102416&T=3

[TABLE]
[ROW][C]Multiple Linear Regression - Regression Statistics[/C][/ROW]
[ROW][C]Multiple R[/C][C]0.330671852624358[/C][/ROW]
[ROW][C]R-squared[/C][C]0.109343874118025[/C][/ROW]
[ROW][C]Adjusted R-squared[/C][C]-0.094764821396594[/C][/ROW]
[ROW][C]F-TEST (value)[/C][C]0.535713943212153[/C][/ROW]
[ROW][C]F-TEST (DF numerator)[/C][C]11[/C][/ROW]
[ROW][C]F-TEST (DF denominator)[/C][C]48[/C][/ROW]
[ROW][C]p-value[/C][C]0.869091752881583[/C][/ROW]
[ROW][C]Multiple Linear Regression - Residual Statistics[/C][/ROW]
[ROW][C]Residual Standard Deviation[/C][C]980.741828073695[/C][/ROW]
[ROW][C]Sum Squared Residuals[/C][C]46169017.6[/C][/ROW]
[/TABLE]
Source: https://freestatistics.org/blog/index.php?pk=102416&T=3

Globally Unique Identifier (entire table): ba.freestatistics.org/blog/index.php?pk=102416&T=3

As an alternative you can also use a QR Code:  

The GUIDs for individual cells are displayed in the table below:

Multiple Linear Regression - Regression Statistics
Multiple R0.330671852624358
R-squared0.109343874118025
Adjusted R-squared-0.094764821396594
F-TEST (value)0.535713943212153
F-TEST (DF numerator)11
F-TEST (DF denominator)48
p-value0.869091752881583
Multiple Linear Regression - Residual Statistics
Residual Standard Deviation980.741828073695
Sum Squared Residuals46169017.6


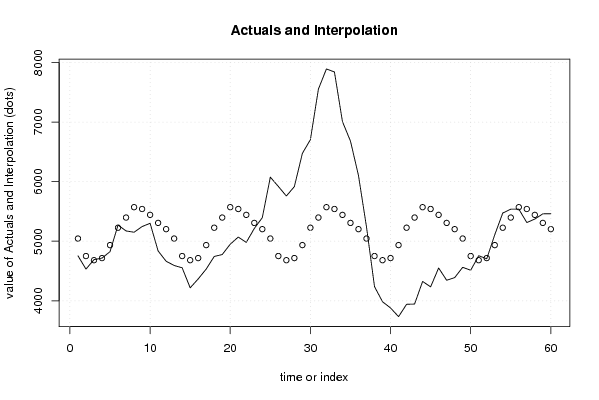
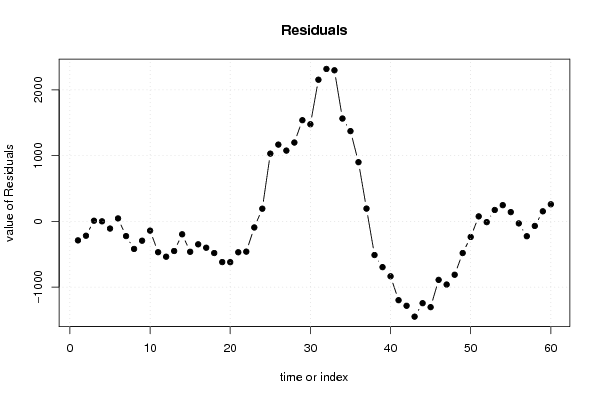
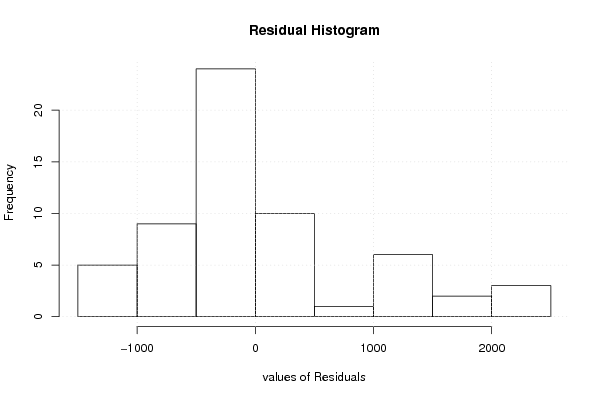
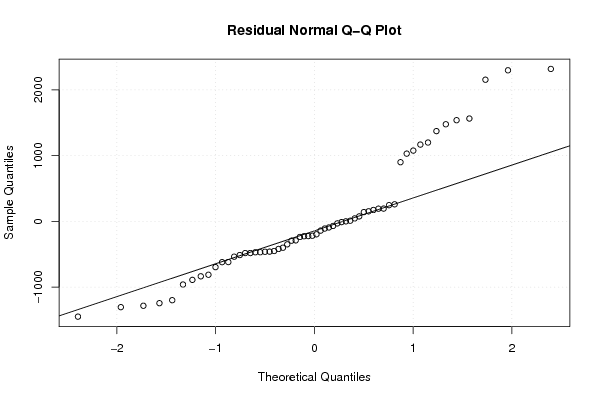
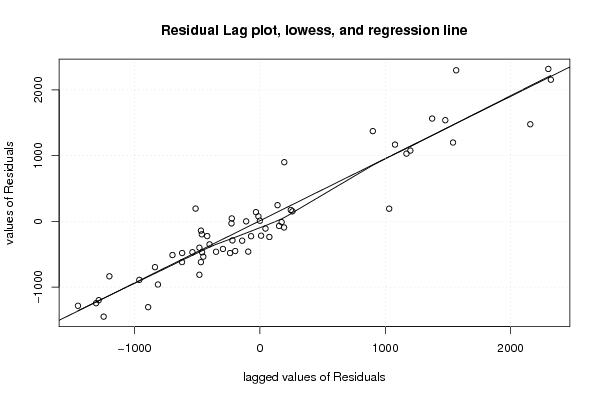
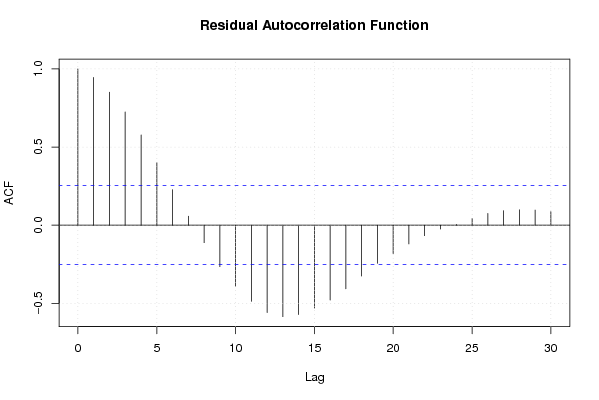
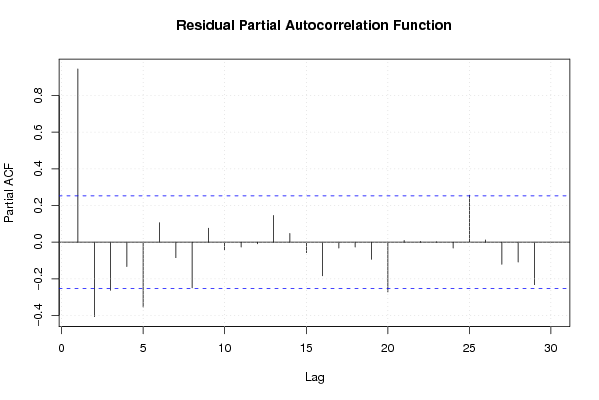
Multiple Linear Regression - Actuals, Interpolation, and Residuals
Time or IndexActualsInterpolationForecastResidualsPrediction Error
147545044-290.000000000002
245314750.4-219.4
346904680.89.19999999999978
447164716.2-0.199999999999998
548244934-110
652705225.844.2000000000003
751725396.6-224.6
851505570.6-420.6
952455540-295
1053005441.6-141.6
1148365306.4-470.4
1246635201.6-538.6
1345925044-451.999999999999
1445534750.4-197.4
1542174680.8-463.8
1643664716.2-350.2
1745324934-402
1847435225.8-482.8
1947765396.6-620.6
2049495570.6-621.6
2150695540-471
2249805441.6-461.6
2352135306.4-93.4
2453945201.6192.4
25607550441031
2659194750.41168.6
2757584680.81077.2
2859164716.21199.8
29647449341540
3067045225.81478.2
3175535396.62156.4
3278915570.62320.4
33784055402300
3470075441.61565.4
3566805306.41373.6
3661025201.6900.4
3752385044194
3842374750.4-513.4
3939834680.8-697.8
4038794716.2-837.2
4137334934-1201
4239405225.8-1285.8
4339455396.6-1451.6
4443245570.6-1246.6
4542335540-1307
4645505441.6-891.6
4743445306.4-962.4
4843885201.6-813.6
4945615044-482.999999999999
5045124750.4-238.4
5147564680.875.2
5247044716.2-12.2
5351074934173
5454725225.8246.2
5555375396.6140.4
5655395570.6-31.6
5753135540-227
5853715441.6-70.6
5954595306.4152.6
6054615201.6259.4

\begin{tabular}{lllllllll}
\hline
Multiple Linear Regression - Actuals, Interpolation, and Residuals \tabularnewline
Time or Index & Actuals & InterpolationForecast & ResidualsPrediction Error \tabularnewline
1 & 4754 & 5044 & -290.000000000002 \tabularnewline
2 & 4531 & 4750.4 & -219.4 \tabularnewline
3 & 4690 & 4680.8 & 9.19999999999978 \tabularnewline
4 & 4716 & 4716.2 & -0.199999999999998 \tabularnewline
5 & 4824 & 4934 & -110 \tabularnewline
6 & 5270 & 5225.8 & 44.2000000000003 \tabularnewline
7 & 5172 & 5396.6 & -224.6 \tabularnewline
8 & 5150 & 5570.6 & -420.6 \tabularnewline
9 & 5245 & 5540 & -295 \tabularnewline
10 & 5300 & 5441.6 & -141.6 \tabularnewline
11 & 4836 & 5306.4 & -470.4 \tabularnewline
12 & 4663 & 5201.6 & -538.6 \tabularnewline
13 & 4592 & 5044 & -451.999999999999 \tabularnewline
14 & 4553 & 4750.4 & -197.4 \tabularnewline
15 & 4217 & 4680.8 & -463.8 \tabularnewline
16 & 4366 & 4716.2 & -350.2 \tabularnewline
17 & 4532 & 4934 & -402 \tabularnewline
18 & 4743 & 5225.8 & -482.8 \tabularnewline
19 & 4776 & 5396.6 & -620.6 \tabularnewline
20 & 4949 & 5570.6 & -621.6 \tabularnewline
21 & 5069 & 5540 & -471 \tabularnewline
22 & 4980 & 5441.6 & -461.6 \tabularnewline
23 & 5213 & 5306.4 & -93.4 \tabularnewline
24 & 5394 & 5201.6 & 192.4 \tabularnewline
25 & 6075 & 5044 & 1031 \tabularnewline
26 & 5919 & 4750.4 & 1168.6 \tabularnewline
27 & 5758 & 4680.8 & 1077.2 \tabularnewline
28 & 5916 & 4716.2 & 1199.8 \tabularnewline
29 & 6474 & 4934 & 1540 \tabularnewline
30 & 6704 & 5225.8 & 1478.2 \tabularnewline
31 & 7553 & 5396.6 & 2156.4 \tabularnewline
32 & 7891 & 5570.6 & 2320.4 \tabularnewline
33 & 7840 & 5540 & 2300 \tabularnewline
34 & 7007 & 5441.6 & 1565.4 \tabularnewline
35 & 6680 & 5306.4 & 1373.6 \tabularnewline
36 & 6102 & 5201.6 & 900.4 \tabularnewline
37 & 5238 & 5044 & 194 \tabularnewline
38 & 4237 & 4750.4 & -513.4 \tabularnewline
39 & 3983 & 4680.8 & -697.8 \tabularnewline
40 & 3879 & 4716.2 & -837.2 \tabularnewline
41 & 3733 & 4934 & -1201 \tabularnewline
42 & 3940 & 5225.8 & -1285.8 \tabularnewline
43 & 3945 & 5396.6 & -1451.6 \tabularnewline
44 & 4324 & 5570.6 & -1246.6 \tabularnewline
45 & 4233 & 5540 & -1307 \tabularnewline
46 & 4550 & 5441.6 & -891.6 \tabularnewline
47 & 4344 & 5306.4 & -962.4 \tabularnewline
48 & 4388 & 5201.6 & -813.6 \tabularnewline
49 & 4561 & 5044 & -482.999999999999 \tabularnewline
50 & 4512 & 4750.4 & -238.4 \tabularnewline
51 & 4756 & 4680.8 & 75.2 \tabularnewline
52 & 4704 & 4716.2 & -12.2 \tabularnewline
53 & 5107 & 4934 & 173 \tabularnewline
54 & 5472 & 5225.8 & 246.2 \tabularnewline
55 & 5537 & 5396.6 & 140.4 \tabularnewline
56 & 5539 & 5570.6 & -31.6 \tabularnewline
57 & 5313 & 5540 & -227 \tabularnewline
58 & 5371 & 5441.6 & -70.6 \tabularnewline
59 & 5459 & 5306.4 & 152.6 \tabularnewline
60 & 5461 & 5201.6 & 259.4 \tabularnewline
\hline
\end{tabular}
%Source: https://freestatistics.org/blog/index.php?pk=102416&T=4

[TABLE]
[ROW][C]Multiple Linear Regression - Actuals, Interpolation, and Residuals[/C][/ROW]
[ROW][C]Time or Index[/C][C]Actuals[/C][C]InterpolationForecast[/C][C]ResidualsPrediction Error[/C][/ROW]
[ROW][C]1[/C][C]4754[/C][C]5044[/C][C]-290.000000000002[/C][/ROW]
[ROW][C]2[/C][C]4531[/C][C]4750.4[/C][C]-219.4[/C][/ROW]
[ROW][C]3[/C][C]4690[/C][C]4680.8[/C][C]9.19999999999978[/C][/ROW]
[ROW][C]4[/C][C]4716[/C][C]4716.2[/C][C]-0.199999999999998[/C][/ROW]
[ROW][C]5[/C][C]4824[/C][C]4934[/C][C]-110[/C][/ROW]
[ROW][C]6[/C][C]5270[/C][C]5225.8[/C][C]44.2000000000003[/C][/ROW]
[ROW][C]7[/C][C]5172[/C][C]5396.6[/C][C]-224.6[/C][/ROW]
[ROW][C]8[/C][C]5150[/C][C]5570.6[/C][C]-420.6[/C][/ROW]
[ROW][C]9[/C][C]5245[/C][C]5540[/C][C]-295[/C][/ROW]
[ROW][C]10[/C][C]5300[/C][C]5441.6[/C][C]-141.6[/C][/ROW]
[ROW][C]11[/C][C]4836[/C][C]5306.4[/C][C]-470.4[/C][/ROW]
[ROW][C]12[/C][C]4663[/C][C]5201.6[/C][C]-538.6[/C][/ROW]
[ROW][C]13[/C][C]4592[/C][C]5044[/C][C]-451.999999999999[/C][/ROW]
[ROW][C]14[/C][C]4553[/C][C]4750.4[/C][C]-197.4[/C][/ROW]
[ROW][C]15[/C][C]4217[/C][C]4680.8[/C][C]-463.8[/C][/ROW]
[ROW][C]16[/C][C]4366[/C][C]4716.2[/C][C]-350.2[/C][/ROW]
[ROW][C]17[/C][C]4532[/C][C]4934[/C][C]-402[/C][/ROW]
[ROW][C]18[/C][C]4743[/C][C]5225.8[/C][C]-482.8[/C][/ROW]
[ROW][C]19[/C][C]4776[/C][C]5396.6[/C][C]-620.6[/C][/ROW]
[ROW][C]20[/C][C]4949[/C][C]5570.6[/C][C]-621.6[/C][/ROW]
[ROW][C]21[/C][C]5069[/C][C]5540[/C][C]-471[/C][/ROW]
[ROW][C]22[/C][C]4980[/C][C]5441.6[/C][C]-461.6[/C][/ROW]
[ROW][C]23[/C][C]5213[/C][C]5306.4[/C][C]-93.4[/C][/ROW]
[ROW][C]24[/C][C]5394[/C][C]5201.6[/C][C]192.4[/C][/ROW]
[ROW][C]25[/C][C]6075[/C][C]5044[/C][C]1031[/C][/ROW]
[ROW][C]26[/C][C]5919[/C][C]4750.4[/C][C]1168.6[/C][/ROW]
[ROW][C]27[/C][C]5758[/C][C]4680.8[/C][C]1077.2[/C][/ROW]
[ROW][C]28[/C][C]5916[/C][C]4716.2[/C][C]1199.8[/C][/ROW]
[ROW][C]29[/C][C]6474[/C][C]4934[/C][C]1540[/C][/ROW]
[ROW][C]30[/C][C]6704[/C][C]5225.8[/C][C]1478.2[/C][/ROW]
[ROW][C]31[/C][C]7553[/C][C]5396.6[/C][C]2156.4[/C][/ROW]
[ROW][C]32[/C][C]7891[/C][C]5570.6[/C][C]2320.4[/C][/ROW]
[ROW][C]33[/C][C]7840[/C][C]5540[/C][C]2300[/C][/ROW]
[ROW][C]34[/C][C]7007[/C][C]5441.6[/C][C]1565.4[/C][/ROW]
[ROW][C]35[/C][C]6680[/C][C]5306.4[/C][C]1373.6[/C][/ROW]
[ROW][C]36[/C][C]6102[/C][C]5201.6[/C][C]900.4[/C][/ROW]
[ROW][C]37[/C][C]5238[/C][C]5044[/C][C]194[/C][/ROW]
[ROW][C]38[/C][C]4237[/C][C]4750.4[/C][C]-513.4[/C][/ROW]
[ROW][C]39[/C][C]3983[/C][C]4680.8[/C][C]-697.8[/C][/ROW]
[ROW][C]40[/C][C]3879[/C][C]4716.2[/C][C]-837.2[/C][/ROW]
[ROW][C]41[/C][C]3733[/C][C]4934[/C][C]-1201[/C][/ROW]
[ROW][C]42[/C][C]3940[/C][C]5225.8[/C][C]-1285.8[/C][/ROW]
[ROW][C]43[/C][C]3945[/C][C]5396.6[/C][C]-1451.6[/C][/ROW]
[ROW][C]44[/C][C]4324[/C][C]5570.6[/C][C]-1246.6[/C][/ROW]
[ROW][C]45[/C][C]4233[/C][C]5540[/C][C]-1307[/C][/ROW]
[ROW][C]46[/C][C]4550[/C][C]5441.6[/C][C]-891.6[/C][/ROW]
[ROW][C]47[/C][C]4344[/C][C]5306.4[/C][C]-962.4[/C][/ROW]
[ROW][C]48[/C][C]4388[/C][C]5201.6[/C][C]-813.6[/C][/ROW]
[ROW][C]49[/C][C]4561[/C][C]5044[/C][C]-482.999999999999[/C][/ROW]
[ROW][C]50[/C][C]4512[/C][C]4750.4[/C][C]-238.4[/C][/ROW]
[ROW][C]51[/C][C]4756[/C][C]4680.8[/C][C]75.2[/C][/ROW]
[ROW][C]52[/C][C]4704[/C][C]4716.2[/C][C]-12.2[/C][/ROW]
[ROW][C]53[/C][C]5107[/C][C]4934[/C][C]173[/C][/ROW]
[ROW][C]54[/C][C]5472[/C][C]5225.8[/C][C]246.2[/C][/ROW]
[ROW][C]55[/C][C]5537[/C][C]5396.6[/C][C]140.4[/C][/ROW]
[ROW][C]56[/C][C]5539[/C][C]5570.6[/C][C]-31.6[/C][/ROW]
[ROW][C]57[/C][C]5313[/C][C]5540[/C][C]-227[/C][/ROW]
[ROW][C]58[/C][C]5371[/C][C]5441.6[/C][C]-70.6[/C][/ROW]
[ROW][C]59[/C][C]5459[/C][C]5306.4[/C][C]152.6[/C][/ROW]
[ROW][C]60[/C][C]5461[/C][C]5201.6[/C][C]259.4[/C][/ROW]
[/TABLE]
Source: https://freestatistics.org/blog/index.php?pk=102416&T=4

Globally Unique Identifier (entire table): ba.freestatistics.org/blog/index.php?pk=102416&T=4

As an alternative you can also use a QR Code:  

The GUIDs for individual cells are displayed in the table below:

Multiple Linear Regression - Actuals, Interpolation, and Residuals
Time or IndexActualsInterpolationForecastResidualsPrediction Error
147545044-290.000000000002
245314750.4-219.4
346904680.89.19999999999978
447164716.2-0.199999999999998
548244934-110
652705225.844.2000000000003
751725396.6-224.6
851505570.6-420.6
952455540-295
1053005441.6-141.6
1148365306.4-470.4
1246635201.6-538.6
1345925044-451.999999999999
1445534750.4-197.4
1542174680.8-463.8
1643664716.2-350.2
1745324934-402
1847435225.8-482.8
1947765396.6-620.6
2049495570.6-621.6
2150695540-471
2249805441.6-461.6
2352135306.4-93.4
2453945201.6192.4
25607550441031
2659194750.41168.6
2757584680.81077.2
2859164716.21199.8
29647449341540
3067045225.81478.2
3175535396.62156.4
3278915570.62320.4
33784055402300
3470075441.61565.4
3566805306.41373.6
3661025201.6900.4
3752385044194
3842374750.4-513.4
3939834680.8-697.8
4038794716.2-837.2
4137334934-1201
4239405225.8-1285.8
4339455396.6-1451.6
4443245570.6-1246.6
4542335540-1307
4645505441.6-891.6
4743445306.4-962.4
4843885201.6-813.6
4945615044-482.999999999999
5045124750.4-238.4
5147564680.875.2
5247044716.2-12.2
5351074934173
5454725225.8246.2
5555375396.6140.4
5655395570.6-31.6
5753135540-227
5853715441.6-70.6
5954595306.4152.6
6054615201.6259.4


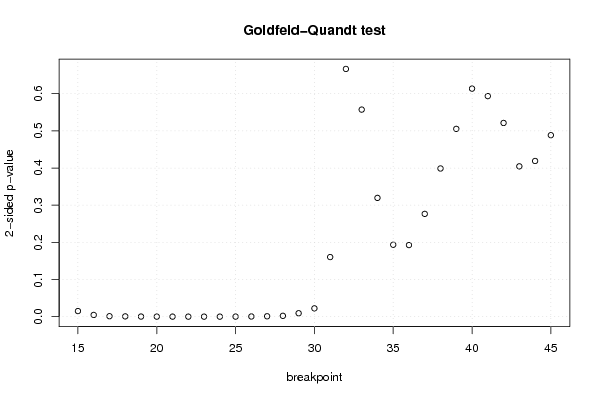
Goldfeld-Quandt test for Heteroskedasticity
p-valuesAlternative Hypothesis
breakpoint indexgreater2-sidedless
150.007543066501434460.01508613300286890.992456933498566
160.002319204350044740.004638408700089490.997680795649955
170.0005921294975639790.001184258995127960.999407870502436
180.0003678171617777380.0007356343235554770.999632182838222
190.0001319412183583150.0002638824367166290.999868058781642
203.04473499258097e-056.08946998516194e-050.999969552650074
216.39228931629099e-061.2784578632582e-050.999993607710684
221.8017560271664e-063.6035120543328e-060.999998198243973
235.80957123210544e-071.16191424642109e-060.999999419042877
247.83306825342432e-071.56661365068486e-060.999999216693175
254.03476967523565e-058.0695393504713e-050.999959652303248
260.0002214601909737140.0004429203819474280.999778539809026
270.0005084716299757470.001016943259951490.999491528370024
280.001104642356554150.002209284713108310.998895357643446
290.004581366009257790.009162732018515580.995418633990742
300.01115730018190870.02231460036381730.98884269981809
310.08018148035869170.1603629607173830.919818519641308
320.3332862798671460.6665725597342910.666713720132854
330.7214056518575330.5571886962849340.278594348142467
340.8402112133464610.3195775733070780.159788786653539
350.9032656407525920.1934687184948160.096734359247408
360.903659804585390.1926803908292190.0963401954146093
370.8617110027445470.2765779945109050.138288997255453
380.8006340616857780.3987318766284430.199365938314222
390.7473307748730590.5053384502538820.252669225126941
400.6932116702085650.613576659582870.306788329791435
410.7032644436244750.5934711127510490.296735556375525
420.7393858535162190.5212282929675630.260614146483781
430.7977555436916540.4044889126166920.202244456308346
440.7905456861858780.4189086276282440.209454313814122
450.7558495895700020.4883008208599960.244150410429998

\begin{tabular}{lllllllll}
\hline
Goldfeld-Quandt test for Heteroskedasticity \tabularnewline
p-values & Alternative Hypothesis \tabularnewline
breakpoint index & greater & 2-sided & less \tabularnewline
15 & 0.00754306650143446 & 0.0150861330028689 & 0.992456933498566 \tabularnewline
16 & 0.00231920435004474 & 0.00463840870008949 & 0.997680795649955 \tabularnewline
17 & 0.000592129497563979 & 0.00118425899512796 & 0.999407870502436 \tabularnewline
18 & 0.000367817161777738 & 0.000735634323555477 & 0.999632182838222 \tabularnewline
19 & 0.000131941218358315 & 0.000263882436716629 & 0.999868058781642 \tabularnewline
20 & 3.04473499258097e-05 & 6.08946998516194e-05 & 0.999969552650074 \tabularnewline
21 & 6.39228931629099e-06 & 1.2784578632582e-05 & 0.999993607710684 \tabularnewline
22 & 1.8017560271664e-06 & 3.6035120543328e-06 & 0.999998198243973 \tabularnewline
23 & 5.80957123210544e-07 & 1.16191424642109e-06 & 0.999999419042877 \tabularnewline
24 & 7.83306825342432e-07 & 1.56661365068486e-06 & 0.999999216693175 \tabularnewline
25 & 4.03476967523565e-05 & 8.0695393504713e-05 & 0.999959652303248 \tabularnewline
26 & 0.000221460190973714 & 0.000442920381947428 & 0.999778539809026 \tabularnewline
27 & 0.000508471629975747 & 0.00101694325995149 & 0.999491528370024 \tabularnewline
28 & 0.00110464235655415 & 0.00220928471310831 & 0.998895357643446 \tabularnewline
29 & 0.00458136600925779 & 0.00916273201851558 & 0.995418633990742 \tabularnewline
30 & 0.0111573001819087 & 0.0223146003638173 & 0.98884269981809 \tabularnewline
31 & 0.0801814803586917 & 0.160362960717383 & 0.919818519641308 \tabularnewline
32 & 0.333286279867146 & 0.666572559734291 & 0.666713720132854 \tabularnewline
33 & 0.721405651857533 & 0.557188696284934 & 0.278594348142467 \tabularnewline
34 & 0.840211213346461 & 0.319577573307078 & 0.159788786653539 \tabularnewline
35 & 0.903265640752592 & 0.193468718494816 & 0.096734359247408 \tabularnewline
36 & 0.90365980458539 & 0.192680390829219 & 0.0963401954146093 \tabularnewline
37 & 0.861711002744547 & 0.276577994510905 & 0.138288997255453 \tabularnewline
38 & 0.800634061685778 & 0.398731876628443 & 0.199365938314222 \tabularnewline
39 & 0.747330774873059 & 0.505338450253882 & 0.252669225126941 \tabularnewline
40 & 0.693211670208565 & 0.61357665958287 & 0.306788329791435 \tabularnewline
41 & 0.703264443624475 & 0.593471112751049 & 0.296735556375525 \tabularnewline
42 & 0.739385853516219 & 0.521228292967563 & 0.260614146483781 \tabularnewline
43 & 0.797755543691654 & 0.404488912616692 & 0.202244456308346 \tabularnewline
44 & 0.790545686185878 & 0.418908627628244 & 0.209454313814122 \tabularnewline
45 & 0.755849589570002 & 0.488300820859996 & 0.244150410429998 \tabularnewline
\hline
\end{tabular}
%Source: https://freestatistics.org/blog/index.php?pk=102416&T=5

[TABLE]
[ROW][C]Goldfeld-Quandt test for Heteroskedasticity[/C][/ROW]
[ROW][C]p-values[/C][C]Alternative Hypothesis[/C][/ROW]
[ROW][C]breakpoint index[/C][C]greater[/C][C]2-sided[/C][C]less[/C][/ROW]
[ROW][C]15[/C][C]0.00754306650143446[/C][C]0.0150861330028689[/C][C]0.992456933498566[/C][/ROW]
[ROW][C]16[/C][C]0.00231920435004474[/C][C]0.00463840870008949[/C][C]0.997680795649955[/C][/ROW]
[ROW][C]17[/C][C]0.000592129497563979[/C][C]0.00118425899512796[/C][C]0.999407870502436[/C][/ROW]
[ROW][C]18[/C][C]0.000367817161777738[/C][C]0.000735634323555477[/C][C]0.999632182838222[/C][/ROW]
[ROW][C]19[/C][C]0.000131941218358315[/C][C]0.000263882436716629[/C][C]0.999868058781642[/C][/ROW]
[ROW][C]20[/C][C]3.04473499258097e-05[/C][C]6.08946998516194e-05[/C][C]0.999969552650074[/C][/ROW]
[ROW][C]21[/C][C]6.39228931629099e-06[/C][C]1.2784578632582e-05[/C][C]0.999993607710684[/C][/ROW]
[ROW][C]22[/C][C]1.8017560271664e-06[/C][C]3.6035120543328e-06[/C][C]0.999998198243973[/C][/ROW]
[ROW][C]23[/C][C]5.80957123210544e-07[/C][C]1.16191424642109e-06[/C][C]0.999999419042877[/C][/ROW]
[ROW][C]24[/C][C]7.83306825342432e-07[/C][C]1.56661365068486e-06[/C][C]0.999999216693175[/C][/ROW]
[ROW][C]25[/C][C]4.03476967523565e-05[/C][C]8.0695393504713e-05[/C][C]0.999959652303248[/C][/ROW]
[ROW][C]26[/C][C]0.000221460190973714[/C][C]0.000442920381947428[/C][C]0.999778539809026[/C][/ROW]
[ROW][C]27[/C][C]0.000508471629975747[/C][C]0.00101694325995149[/C][C]0.999491528370024[/C][/ROW]
[ROW][C]28[/C][C]0.00110464235655415[/C][C]0.00220928471310831[/C][C]0.998895357643446[/C][/ROW]
[ROW][C]29[/C][C]0.00458136600925779[/C][C]0.00916273201851558[/C][C]0.995418633990742[/C][/ROW]
[ROW][C]30[/C][C]0.0111573001819087[/C][C]0.0223146003638173[/C][C]0.98884269981809[/C][/ROW]
[ROW][C]31[/C][C]0.0801814803586917[/C][C]0.160362960717383[/C][C]0.919818519641308[/C][/ROW]
[ROW][C]32[/C][C]0.333286279867146[/C][C]0.666572559734291[/C][C]0.666713720132854[/C][/ROW]
[ROW][C]33[/C][C]0.721405651857533[/C][C]0.557188696284934[/C][C]0.278594348142467[/C][/ROW]
[ROW][C]34[/C][C]0.840211213346461[/C][C]0.319577573307078[/C][C]0.159788786653539[/C][/ROW]
[ROW][C]35[/C][C]0.903265640752592[/C][C]0.193468718494816[/C][C]0.096734359247408[/C][/ROW]
[ROW][C]36[/C][C]0.90365980458539[/C][C]0.192680390829219[/C][C]0.0963401954146093[/C][/ROW]
[ROW][C]37[/C][C]0.861711002744547[/C][C]0.276577994510905[/C][C]0.138288997255453[/C][/ROW]
[ROW][C]38[/C][C]0.800634061685778[/C][C]0.398731876628443[/C][C]0.199365938314222[/C][/ROW]
[ROW][C]39[/C][C]0.747330774873059[/C][C]0.505338450253882[/C][C]0.252669225126941[/C][/ROW]
[ROW][C]40[/C][C]0.693211670208565[/C][C]0.61357665958287[/C][C]0.306788329791435[/C][/ROW]
[ROW][C]41[/C][C]0.703264443624475[/C][C]0.593471112751049[/C][C]0.296735556375525[/C][/ROW]
[ROW][C]42[/C][C]0.739385853516219[/C][C]0.521228292967563[/C][C]0.260614146483781[/C][/ROW]
[ROW][C]43[/C][C]0.797755543691654[/C][C]0.404488912616692[/C][C]0.202244456308346[/C][/ROW]
[ROW][C]44[/C][C]0.790545686185878[/C][C]0.418908627628244[/C][C]0.209454313814122[/C][/ROW]
[ROW][C]45[/C][C]0.755849589570002[/C][C]0.488300820859996[/C][C]0.244150410429998[/C][/ROW]
[/TABLE]
Source: https://freestatistics.org/blog/index.php?pk=102416&T=5

Globally Unique Identifier (entire table): ba.freestatistics.org/blog/index.php?pk=102416&T=5

As an alternative you can also use a QR Code:  

The GUIDs for individual cells are displayed in the table below:

Goldfeld-Quandt test for Heteroskedasticity
p-valuesAlternative Hypothesis
breakpoint indexgreater2-sidedless
150.007543066501434460.01508613300286890.992456933498566
160.002319204350044740.004638408700089490.997680795649955
170.0005921294975639790.001184258995127960.999407870502436
180.0003678171617777380.0007356343235554770.999632182838222
190.0001319412183583150.0002638824367166290.999868058781642
203.04473499258097e-056.08946998516194e-050.999969552650074
216.39228931629099e-061.2784578632582e-050.999993607710684
221.8017560271664e-063.6035120543328e-060.999998198243973
235.80957123210544e-071.16191424642109e-060.999999419042877
247.83306825342432e-071.56661365068486e-060.999999216693175
254.03476967523565e-058.0695393504713e-050.999959652303248
260.0002214601909737140.0004429203819474280.999778539809026
270.0005084716299757470.001016943259951490.999491528370024
280.001104642356554150.002209284713108310.998895357643446
290.004581366009257790.009162732018515580.995418633990742
300.01115730018190870.02231460036381730.98884269981809
310.08018148035869170.1603629607173830.919818519641308
320.3332862798671460.6665725597342910.666713720132854
330.7214056518575330.5571886962849340.278594348142467
340.8402112133464610.3195775733070780.159788786653539
350.9032656407525920.1934687184948160.096734359247408
360.903659804585390.1926803908292190.0963401954146093
370.8617110027445470.2765779945109050.138288997255453
380.8006340616857780.3987318766284430.199365938314222
390.7473307748730590.5053384502538820.252669225126941
400.6932116702085650.613576659582870.306788329791435
410.7032644436244750.5934711127510490.296735556375525
420.7393858535162190.5212282929675630.260614146483781
430.7977555436916540.4044889126166920.202244456308346
440.7905456861858780.4189086276282440.209454313814122
450.7558495895700020.4883008208599960.244150410429998


Meta Analysis of Goldfeld-Quandt test for Heteroskedasticity
Description# significant tests% significant testsOK/NOK
1% type I error level140.451612903225806NOK
5% type I error level160.516129032258065NOK
10% type I error level160.516129032258065NOK

\begin{tabular}{lllllllll}
\hline
Meta Analysis of Goldfeld-Quandt test for Heteroskedasticity \tabularnewline
Description & # significant tests & % significant tests & OK/NOK \tabularnewline
1% type I error level & 14 & 0.451612903225806 & NOK \tabularnewline
5% type I error level & 16 & 0.516129032258065 & NOK \tabularnewline
10% type I error level & 16 & 0.516129032258065 & NOK \tabularnewline
\hline
\end{tabular}
%Source: https://freestatistics.org/blog/index.php?pk=102416&T=6

[TABLE]
[ROW][C]Meta Analysis of Goldfeld-Quandt test for Heteroskedasticity[/C][/ROW]
[ROW][C]Description[/C][C]# significant tests[/C][C]% significant tests[/C][C]OK/NOK[/C][/ROW]
[ROW][C]1% type I error level[/C][C]14[/C][C]0.451612903225806[/C][C]NOK[/C][/ROW]
[ROW][C]5% type I error level[/C][C]16[/C][C]0.516129032258065[/C][C]NOK[/C][/ROW]
[ROW][C]10% type I error level[/C][C]16[/C][C]0.516129032258065[/C][C]NOK[/C][/ROW]
[/TABLE]
Source: https://freestatistics.org/blog/index.php?pk=102416&T=6

Globally Unique Identifier (entire table): ba.freestatistics.org/blog/index.php?pk=102416&T=6

As an alternative you can also use a QR Code:  

The GUIDs for individual cells are displayed in the table below:

Meta Analysis of Goldfeld-Quandt test for Heteroskedasticity
Description# significant tests% significant testsOK/NOK
1% type I error level140.451612903225806NOK
5% type I error level160.516129032258065NOK
10% type I error level160.516129032258065NOK


Parameters (Session):
par1 = 1 ; par2 = Do not include Seasonal Dummies ; par3 = No Linear Trend ;
Parameters (R input):
par1 = 1 ; par2 = Include Monthly Dummies ; par3 = No Linear Trend ;
R code (references can be found in the software module):
library(lattice)
library(lmtest)
n25 <- 25 #minimum number of obs. for Goldfeld-Quandt test
par1 <- as.numeric(par1)
x <- t(y)
k <- length(x[1,])
n <- length(x[,1])
x1 <- cbind(x[,par1], x[,1:k!=par1])
mycolnames <- c(colnames(x)[par1], colnames(x)[1:k!=par1])
colnames(x1) <- mycolnames #colnames(x)[par1]
x <- x1
if (par3 == 'First Differences'){
x2 <- array(0, dim=c(n-1,k), dimnames=list(1:(n-1), paste('(1-B)',colnames(x),sep='')))
for (i in 1:n-1) {
for (j in 1:k) {
x2[i,j] <- x[i+1,j] - x[i,j]
}
}
x <- x2
}
if (par2 == 'Include Monthly Dummies'){
x2 <- array(0, dim=c(n,11), dimnames=list(1:n, paste('M', seq(1:11), sep ='')))
for (i in 1:11){
x2[seq(i,n,12),i] <- 1
}
x <- cbind(x, x2)
}
if (par2 == 'Include Quarterly Dummies'){
x2 <- array(0, dim=c(n,3), dimnames=list(1:n, paste('Q', seq(1:3), sep ='')))
for (i in 1:3){
x2[seq(i,n,4),i] <- 1
}
x <- cbind(x, x2)
}
k <- length(x[1,])
if (par3 == 'Linear Trend'){
x <- cbind(x, c(1:n))
colnames(x)[k+1] <- 't'
}
x
k <- length(x[1,])
df <- as.data.frame(x)
(mylm <- lm(df))
(mysum <- summary(mylm))
if (n > n25) {
kp3 <- k + 3
nmkm3 <- n - k - 3
gqarr <- array(NA, dim=c(nmkm3-kp3+1,3))
numgqtests <- 0
numsignificant1 <- 0
numsignificant5 <- 0
numsignificant10 <- 0
for (mypoint in kp3:nmkm3) {
j <- 0
numgqtests <- numgqtests + 1
for (myalt in c('greater', 'two.sided', 'less')) {
j <- j + 1
gqarr[mypoint-kp3+1,j] <- gqtest(mylm, point=mypoint, alternative=myalt)$p.value
}
if (gqarr[mypoint-kp3+1,2] < 0.01) numsignificant1 <- numsignificant1 + 1
if (gqarr[mypoint-kp3+1,2] < 0.05) numsignificant5 <- numsignificant5 + 1
if (gqarr[mypoint-kp3+1,2] < 0.10) numsignificant10 <- numsignificant10 + 1
}
gqarr
}
bitmap(file='test0.png')
plot(x[,1], type='l', main='Actuals and Interpolation', ylab='value of Actuals and Interpolation (dots)', xlab='time or index')
points(x[,1]-mysum$resid)
grid()
dev.off()
bitmap(file='test1.png')
plot(mysum$resid, type='b', pch=19, main='Residuals', ylab='value of Residuals', xlab='time or index')
grid()
dev.off()
bitmap(file='test2.png')
hist(mysum$resid, main='Residual Histogram', xlab='values of Residuals')
grid()
dev.off()
bitmap(file='test3.png')
densityplot(~mysum$resid,col='black',main='Residual Density Plot', xlab='values of Residuals')
dev.off()
bitmap(file='test4.png')
qqnorm(mysum$resid, main='Residual Normal Q-Q Plot')
qqline(mysum$resid)
grid()
dev.off()
(myerror <- as.ts(mysum$resid))
bitmap(file='test5.png')
dum <- cbind(lag(myerror,k=1),myerror)
dum
dum1 <- dum[2:length(myerror),]
dum1
z <- as.data.frame(dum1)
z
plot(z,main=paste('Residual Lag plot, lowess, and regression line'), ylab='values of Residuals', xlab='lagged values of Residuals')
lines(lowess(z))
abline(lm(z))
grid()
dev.off()
bitmap(file='test6.png')
acf(mysum$resid, lag.max=length(mysum$resid)/2, main='Residual Autocorrelation Function')
grid()
dev.off()
bitmap(file='test7.png')
pacf(mysum$resid, lag.max=length(mysum$resid)/2, main='Residual Partial Autocorrelation Function')
grid()
dev.off()
bitmap(file='test8.png')
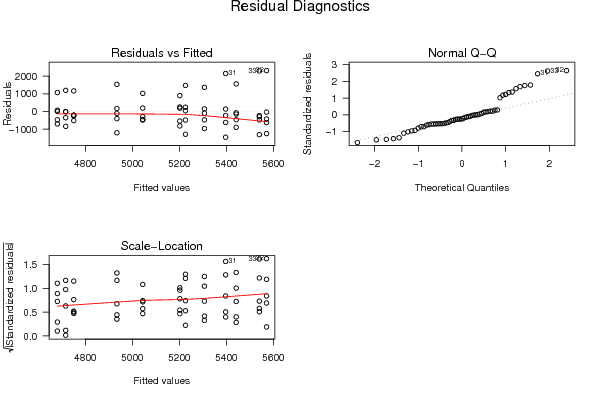
opar <- par(mfrow = c(2,2), oma = c(0, 0, 1.1, 0))
plot(mylm, las = 1, sub='Residual Diagnostics')
par(opar)
dev.off()
if (n > n25) {
bitmap(file='test9.png')
plot(kp3:nmkm3,gqarr[,2], main='Goldfeld-Quandt test',ylab='2-sided p-value',xlab='breakpoint')
grid()
dev.off()
}
load(file='createtable')
a<-table.start()
a<-table.row.start(a)
a<-table.element(a, 'Multiple Linear Regression - Estimated Regression Equation', 1, TRUE)
a<-table.row.end(a)
myeq <- colnames(x)[1]
myeq <- paste(myeq, '[t] = ', sep='')
for (i in 1:k){
if (mysum$coefficients[i,1] > 0) myeq <- paste(myeq, '+', '')
myeq <- paste(myeq, mysum$coefficients[i,1], sep=' ')
if (rownames(mysum$coefficients)[i] != '(Intercept)') {
myeq <- paste(myeq, rownames(mysum$coefficients)[i], sep='')
if (rownames(mysum$coefficients)[i] != 't') myeq <- paste(myeq, '[t]', sep='')
}
}
myeq <- paste(myeq, ' + e[t]')
a<-table.row.start(a)
a<-table.element(a, myeq)
a<-table.row.end(a)
a<-table.end(a)
table.save(a,file='mytable1.tab')
a<-table.start()
a<-table.row.start(a)
a<-table.element(a,hyperlink('ols1.htm','Multiple Linear Regression - Ordinary Least Squares',''), 6, TRUE)
a<-table.row.end(a)
a<-table.row.start(a)
a<-table.element(a,'Variable',header=TRUE)
a<-table.element(a,'Parameter',header=TRUE)
a<-table.element(a,'S.D.',header=TRUE)
a<-table.element(a,'T-STAT
H0: parameter = 0',header=TRUE)
a<-table.element(a,'2-tail p-value',header=TRUE)
a<-table.element(a,'1-tail p-value',header=TRUE)
a<-table.row.end(a)
for (i in 1:k){
a<-table.row.start(a)
a<-table.element(a,rownames(mysum$coefficients)[i],header=TRUE)
a<-table.element(a,mysum$coefficients[i,1])
a<-table.element(a, round(mysum$coefficients[i,2],6))
a<-table.element(a, round(mysum$coefficients[i,3],4))
a<-table.element(a, round(mysum$coefficients[i,4],6))
a<-table.element(a, round(mysum$coefficients[i,4]/2,6))
a<-table.row.end(a)
}
a<-table.end(a)
table.save(a,file='mytable2.tab')
a<-table.start()
a<-table.row.start(a)
a<-table.element(a, 'Multiple Linear Regression - Regression Statistics', 2, TRUE)
a<-table.row.end(a)
a<-table.row.start(a)
a<-table.element(a, 'Multiple R',1,TRUE)
a<-table.element(a, sqrt(mysum$r.squared))
a<-table.row.end(a)
a<-table.row.start(a)
a<-table.element(a, 'R-squared',1,TRUE)
a<-table.element(a, mysum$r.squared)
a<-table.row.end(a)
a<-table.row.start(a)
a<-table.element(a, 'Adjusted R-squared',1,TRUE)
a<-table.element(a, mysum$adj.r.squared)
a<-table.row.end(a)
a<-table.row.start(a)
a<-table.element(a, 'F-TEST (value)',1,TRUE)
a<-table.element(a, mysum$fstatistic[1])
a<-table.row.end(a)
a<-table.row.start(a)
a<-table.element(a, 'F-TEST (DF numerator)',1,TRUE)
a<-table.element(a, mysum$fstatistic[2])
a<-table.row.end(a)
a<-table.row.start(a)
a<-table.element(a, 'F-TEST (DF denominator)',1,TRUE)
a<-table.element(a, mysum$fstatistic[3])
a<-table.row.end(a)
a<-table.row.start(a)
a<-table.element(a, 'p-value',1,TRUE)
a<-table.element(a, 1-pf(mysum$fstatistic[1],mysum$fstatistic[2],mysum$fstatistic[3]))
a<-table.row.end(a)
a<-table.row.start(a)
a<-table.element(a, 'Multiple Linear Regression - Residual Statistics', 2, TRUE)
a<-table.row.end(a)
a<-table.row.start(a)
a<-table.element(a, 'Residual Standard Deviation',1,TRUE)
a<-table.element(a, mysum$sigma)
a<-table.row.end(a)
a<-table.row.start(a)
a<-table.element(a, 'Sum Squared Residuals',1,TRUE)
a<-table.element(a, sum(myerror*myerror))
a<-table.row.end(a)
a<-table.end(a)
table.save(a,file='mytable3.tab')
a<-table.start()
a<-table.row.start(a)
a<-table.element(a, 'Multiple Linear Regression - Actuals, Interpolation, and Residuals', 4, TRUE)
a<-table.row.end(a)
a<-table.row.start(a)
a<-table.element(a, 'Time or Index', 1, TRUE)
a<-table.element(a, 'Actuals', 1, TRUE)
a<-table.element(a, 'Interpolation
Forecast', 1, TRUE)
a<-table.element(a, 'Residuals
Prediction Error', 1, TRUE)
a<-table.row.end(a)
for (i in 1:n) {
a<-table.row.start(a)
a<-table.element(a,i, 1, TRUE)
a<-table.element(a,x[i])
a<-table.element(a,x[i]-mysum$resid[i])
a<-table.element(a,mysum$resid[i])
a<-table.row.end(a)
}
a<-table.end(a)
table.save(a,file='mytable4.tab')
if (n > n25) {
a<-table.start()
a<-table.row.start(a)
a<-table.element(a,'Goldfeld-Quandt test for Heteroskedasticity',4,TRUE)
a<-table.row.end(a)
a<-table.row.start(a)
a<-table.element(a,'p-values',header=TRUE)
a<-table.element(a,'Alternative Hypothesis',3,header=TRUE)
a<-table.row.end(a)
a<-table.row.start(a)
a<-table.element(a,'breakpoint index',header=TRUE)
a<-table.element(a,'greater',header=TRUE)
a<-table.element(a,'2-sided',header=TRUE)
a<-table.element(a,'less',header=TRUE)
a<-table.row.end(a)
for (mypoint in kp3:nmkm3) {
a<-table.row.start(a)
a<-table.element(a,mypoint,header=TRUE)
a<-table.element(a,gqarr[mypoint-kp3+1,1])
a<-table.element(a,gqarr[mypoint-kp3+1,2])
a<-table.element(a,gqarr[mypoint-kp3+1,3])
a<-table.row.end(a)
}
a<-table.end(a)
table.save(a,file='mytable5.tab')
a<-table.start()
a<-table.row.start(a)
a<-table.element(a,'Meta Analysis of Goldfeld-Quandt test for Heteroskedasticity',4,TRUE)
a<-table.row.end(a)
a<-table.row.start(a)
a<-table.element(a,'Description',header=TRUE)
a<-table.element(a,'# significant tests',header=TRUE)
a<-table.element(a,'% significant tests',header=TRUE)
a<-table.element(a,'OK/NOK',header=TRUE)
a<-table.row.end(a)
a<-table.row.start(a)
a<-table.element(a,'1% type I error level',header=TRUE)
a<-table.element(a,numsignificant1)
a<-table.element(a,numsignificant1/numgqtests)
if (numsignificant1/numgqtests < 0.01) dum <- 'OK' else dum <- 'NOK'
a<-table.element(a,dum)
a<-table.row.end(a)
a<-table.row.start(a)
a<-table.element(a,'5% type I error level',header=TRUE)
a<-table.element(a,numsignificant5)
a<-table.element(a,numsignificant5/numgqtests)
if (numsignificant5/numgqtests < 0.05) dum <- 'OK' else dum <- 'NOK'
a<-table.element(a,dum)
a<-table.row.end(a)
a<-table.row.start(a)
a<-table.element(a,'10% type I error level',header=TRUE)
a<-table.element(a,numsignificant10)
a<-table.element(a,numsignificant10/numgqtests)
if (numsignificant10/numgqtests < 0.1) dum <- 'OK' else dum <- 'NOK'
a<-table.element(a,dum)
a<-table.row.end(a)
a<-table.end(a)
table.save(a,file='mytable6.tab')
}