| Multiple Linear Regression - Estimated Regression Equation |
| Y[t] = + 51.2642 + 1.4548`X `[t] + e[t] |
| Multiple Linear Regression - Ordinary Least Squares | |||||
| Variable | Parameter | S.D. | T-STAT H0: parameter = 0 | 2-tail p-value | 1-tail p-value |
| (Intercept) | 51.2642 | 1.334692 | 38.409 | 0 | 0 |
| `X ` | 1.4548 | 3.269315 | 0.445 | 0.657986 | 0.328993 |
| Multiple Linear Regression - Regression Statistics | |
| Multiple R | 0.0583300545013329 |
| R-squared | 0.00340239525812847 |
| Adjusted R-squared | -0.0137803220650072 |
| F-TEST (value) | 0.19801264224648 |
| F-TEST (DF numerator) | 1 |
| F-TEST (DF denominator) | 58 |
| p-value | 0.657986088726541 |
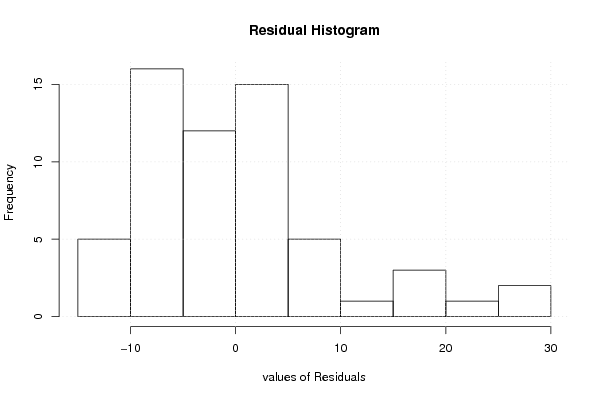
| Multiple Linear Regression - Residual Statistics | |
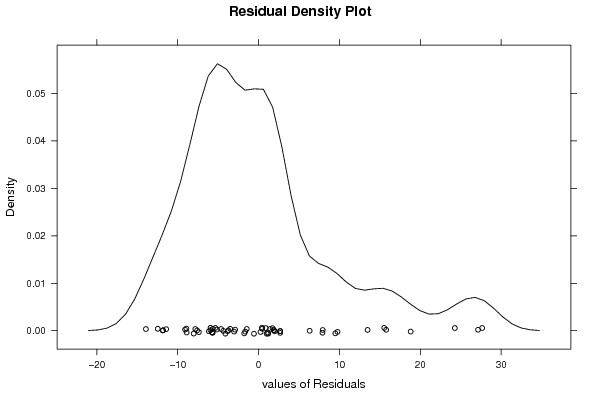
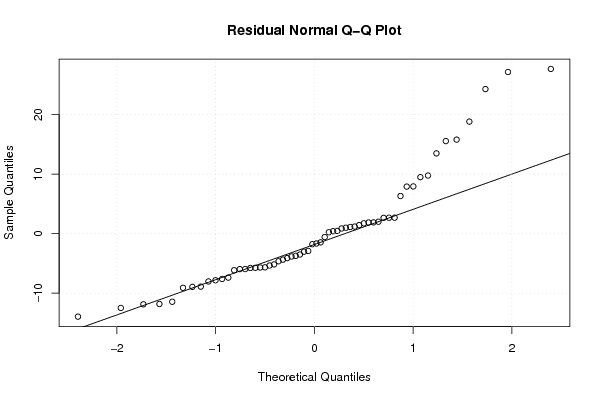
| Residual Standard Deviation | 9.43770090720156 |
| Sum Squared Residuals | 5166.071508 |
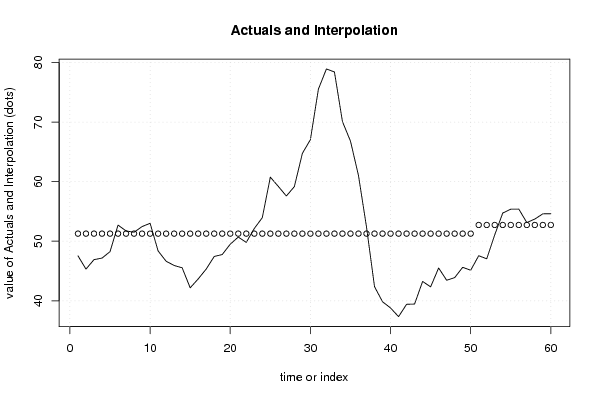
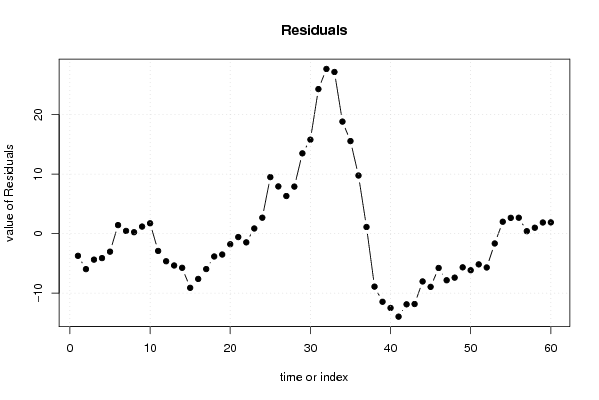
| Multiple Linear Regression - Actuals, Interpolation, and Residuals | |||
| Time or Index | Actuals | Interpolation Forecast | Residuals Prediction Error |
| 1 | 47.54 | 51.2642000000001 | -3.72420000000009 |
| 2 | 45.31 | 51.2642 | -5.95419999999999 |
| 3 | 46.9 | 51.2642 | -4.3642 |
| 4 | 47.16 | 51.2642 | -4.1042 |
| 5 | 48.24 | 51.2642 | -3.0242 |
| 6 | 52.7 | 51.2642 | 1.4358 |
| 7 | 51.72 | 51.2642 | 0.455800000000001 |
| 8 | 51.5 | 51.2642 | 0.235800000000002 |
| 9 | 52.45 | 51.2642 | 1.1858 |
| 10 | 53 | 51.2642 | 1.7358 |
| 11 | 48.36 | 51.2642 | -2.9042 |
| 12 | 46.63 | 51.2642 | -4.63419999999999 |
| 13 | 45.92 | 51.2642 | -5.3442 |
| 14 | 45.53 | 51.2642 | -5.7342 |
| 15 | 42.17 | 51.2642 | -9.0942 |
| 16 | 43.66 | 51.2642 | -7.6042 |
| 17 | 45.32 | 51.2642 | -5.9442 |
| 18 | 47.43 | 51.2642 | -3.8342 |
| 19 | 47.76 | 51.2642 | -3.5042 |
| 20 | 49.49 | 51.2642 | -1.7742 |
| 21 | 50.69 | 51.2642 | -0.5742 |
| 22 | 49.8 | 51.2642 | -1.4642 |
| 23 | 52.13 | 51.2642 | 0.865800000000004 |
| 24 | 53.94 | 51.2642 | 2.6758 |
| 25 | 60.75 | 51.2642 | 9.4858 |
| 26 | 59.19 | 51.2642 | 7.9258 |
| 27 | 57.58 | 51.2642 | 6.3158 |
| 28 | 59.16 | 51.2642 | 7.8958 |
| 29 | 64.74 | 51.2642 | 13.4758 |
| 30 | 67.04 | 51.2642 | 15.7758 |
| 31 | 75.53 | 51.2642 | 24.2658 |
| 32 | 78.91 | 51.2642 | 27.6458 |
| 33 | 78.4 | 51.2642 | 27.1358 |
| 34 | 70.07 | 51.2642 | 18.8058 |
| 35 | 66.8 | 51.2642 | 15.5358 |
| 36 | 61.02 | 51.2642 | 9.7558 |
| 37 | 52.38 | 51.2642 | 1.1158 |
| 38 | 42.37 | 51.2642 | -8.8942 |
| 39 | 39.83 | 51.2642 | -11.4342 |
| 40 | 38.79 | 51.2642 | -12.4742 |
| 41 | 37.33 | 51.2642 | -13.9342 |
| 42 | 39.4 | 51.2642 | -11.8642 |
| 43 | 39.45 | 51.2642 | -11.8142 |
| 44 | 43.24 | 51.2642 | -8.0242 |
| 45 | 42.33 | 51.2642 | -8.9342 |
| 46 | 45.5 | 51.2642 | -5.7642 |
| 47 | 43.44 | 51.2642 | -7.8242 |
| 48 | 43.88 | 51.2642 | -7.3842 |
| 49 | 45.61 | 51.2642 | -5.6542 |
| 50 | 45.12 | 51.2642 | -6.1442 |
| 51 | 47.56 | 52.719 | -5.159 |
| 52 | 47.04 | 52.719 | -5.679 |
| 53 | 51.07 | 52.719 | -1.649 |
| 54 | 54.72 | 52.719 | 2.001 |
| 55 | 55.37 | 52.719 | 2.651 |
| 56 | 55.39 | 52.719 | 2.671 |
| 57 | 53.13 | 52.719 | 0.411000000000001 |
| 58 | 53.71 | 52.719 | 0.991 |
| 59 | 54.59 | 52.719 | 1.871 |
| 60 | 54.61 | 52.719 | 1.891 |
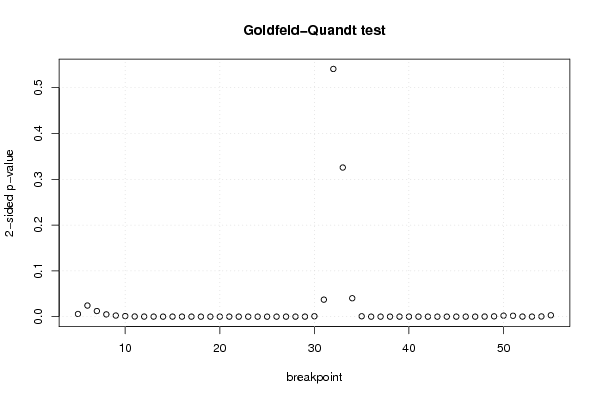
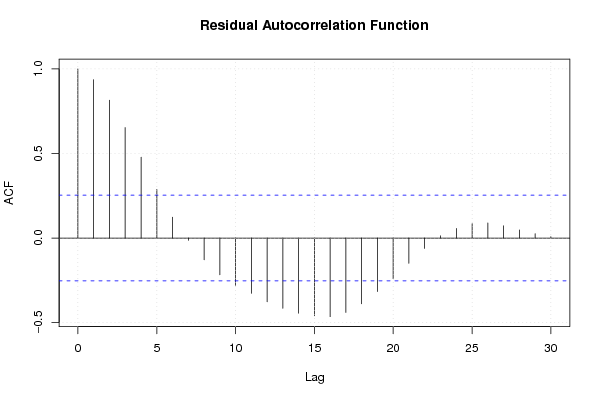
| Goldfeld-Quandt test for Heteroskedasticity | |||
| p-values | Alternative Hypothesis | ||
| breakpoint index | greater | 2-sided | less |
| 5 | 0.00291394052874483 | 0.00582788105748967 | 0.997086059471255 |
| 6 | 0.0121255173674674 | 0.0242510347349348 | 0.987874482632533 |
| 7 | 0.00614332390819851 | 0.012286647816397 | 0.993856676091802 |
| 8 | 0.00247526721394597 | 0.00495053442789195 | 0.997524732786054 |
| 9 | 0.00120250776995811 | 0.00240501553991622 | 0.998797492230042 |
| 10 | 0.000614397082310771 | 0.00122879416462154 | 0.99938560291769 |
| 11 | 0.000180164100368369 | 0.000360328200736738 | 0.999819835899632 |
| 12 | 7.34488299279166e-05 | 0.000146897659855833 | 0.999926551170072 |
| 13 | 3.50670782228352e-05 | 7.01341564456703e-05 | 0.999964932921777 |
| 14 | 1.76238949664762e-05 | 3.52477899329525e-05 | 0.999982376105033 |
| 15 | 3.51391228209298e-05 | 7.02782456418595e-05 | 0.99996486087718 |
| 16 | 2.58075748922336e-05 | 5.16151497844673e-05 | 0.999974192425108 |
| 17 | 1.10583733199668e-05 | 2.21167466399335e-05 | 0.99998894162668 |
| 18 | 3.46575979911539e-06 | 6.93151959823079e-06 | 0.9999965342402 |
| 19 | 1.03910903717346e-06 | 2.07821807434693e-06 | 0.999998960890963 |
| 20 | 3.29527734096344e-07 | 6.59055468192688e-07 | 0.999999670472266 |
| 21 | 1.25338542425687e-07 | 2.50677084851374e-07 | 0.999999874661458 |
| 22 | 3.88051874549753e-08 | 7.76103749099507e-08 | 0.999999961194812 |
| 23 | 2.07336826433361e-08 | 4.14673652866721e-08 | 0.999999979266317 |
| 24 | 2.08104302735882e-08 | 4.16208605471764e-08 | 0.99999997918957 |
| 25 | 7.06431014990399e-07 | 1.4128620299808e-06 | 0.999999293568985 |
| 26 | 2.44006662829363e-06 | 4.88013325658725e-06 | 0.999997559933372 |
| 27 | 3.12901114481542e-06 | 6.25802228963085e-06 | 0.999996870988855 |
| 28 | 5.43945157941561e-06 | 1.08789031588312e-05 | 0.99999456054842 |
| 29 | 4.86301616789662e-05 | 9.72603233579325e-05 | 0.99995136983832 |
| 30 | 0.000428002892266206 | 0.000856005784532411 | 0.999571997107734 |
| 31 | 0.0185545847768969 | 0.0371091695537938 | 0.981445415223103 |
| 32 | 0.270419020091198 | 0.540838040182397 | 0.729580979908802 |
| 33 | 0.837198028533007 | 0.325603942933986 | 0.162801971466993 |
| 34 | 0.979886373477706 | 0.0402272530445877 | 0.0201136265222939 |
| 35 | 0.999570366708292 | 0.000859266583416565 | 0.000429633291708283 |
| 36 | 0.99999834690639 | 3.30618721767932e-06 | 1.65309360883966e-06 |
| 37 | 0.999999906927945 | 1.86144109922944e-07 | 9.30720549614718e-08 |
| 38 | 0.9999997735067 | 4.52986597253314e-07 | 2.26493298626657e-07 |
| 39 | 0.999999610370044 | 7.79259911292286e-07 | 3.89629955646143e-07 |
| 40 | 0.999999529399186 | 9.41201628945368e-07 | 4.70600814472684e-07 |
| 41 | 0.999999781663882 | 4.36672236179212e-07 | 2.18336118089606e-07 |
| 42 | 0.999999748860572 | 5.0227885596095e-07 | 2.51139427980475e-07 |
| 43 | 0.999999779062887 | 4.41874225261978e-07 | 2.20937112630989e-07 |
| 44 | 0.999999207789445 | 1.58442111040375e-06 | 7.92210555201875e-07 |
| 45 | 0.999997839372923 | 4.32125415419547e-06 | 2.16062707709773e-06 |
| 46 | 0.999991918793642 | 1.61624127161642e-05 | 8.08120635808211e-06 |
| 47 | 0.99997275881434 | 5.44823713198923e-05 | 2.72411856599461e-05 |
| 48 | 0.99990907325654 | 0.000181853486918665 | 9.09267434593327e-05 |
| 49 | 0.999678958669376 | 0.000642082661247853 | 0.000321041330623927 |
| 50 | 0.99892100139279 | 0.00215799721442014 | 0.00107899860721007 |
| 51 | 0.9990535465235 | 0.0018929069529983 | 0.000946453476499152 |
| 52 | 0.999936765678035 | 0.000126468643929224 | 6.3234321964612e-05 |
| 53 | 0.999980527001919 | 3.89459961628984e-05 | 1.94729980814492e-05 |
| 54 | 0.999781832533833 | 0.000436334932334636 | 0.000218167466167318 |
| 55 | 0.99848497110345 | 0.00303005779309898 | 0.00151502889654949 |
| Meta Analysis of Goldfeld-Quandt test for Heteroskedasticity | |||
| Description | # significant tests | % significant tests | OK/NOK |
| 1% type I error level | 45 | 0.88235294117647 | NOK |
| 5% type I error level | 49 | 0.96078431372549 | NOK |
| 10% type I error level | 49 | 0.96078431372549 | NOK |