Free Statistics

of Irreproducible Research!

Author's title

Author*The author of this computation has been verified*
R Software Modulerwasp_multipleregression.wasp
Title produced by softwareMultiple Regression
Date of computationSat, 27 Nov 2010 10:38:56 +0000
Cite this page as followsStatistical Computations at FreeStatistics.org, Office for Research Development and Education, URL https://freestatistics.org/blog/index.php?v=date/2010/Nov/27/t1290854259wxeaxwb923ozn9h.htm/, Retrieved Mon, 29 Apr 2024 14:29:30 +0000
Statistical Computations at FreeStatistics.org, Office for Research Development and Education, URL https://freestatistics.org/blog/index.php?pk=102338, Retrieved Mon, 29 Apr 2024 14:29:30 +0000
QR Codes:

Original text written by user:
IsPrivate?No (this computation is public)
User-defined keywords
Estimated Impact137
Family? (F = Feedback message, R = changed R code, M = changed R Module, P = changed Parameters, D = changed Data)
-     [Multiple Regression] [Q1 The Seatbeltlaw] [2007-11-14 19:27:43] [8cd6641b921d30ebe00b648d1481bba0]
- RMPD  [Multiple Regression] [Seatbelt] [2009-11-12 13:54:52] [b98453cac15ba1066b407e146608df68]
-    D      [Multiple Regression] [W8 - Geboortecijf...] [2010-11-27 10:38:56] [bff44ea937c3f909b1dc9a8bfab919e2] [Current]
Feedback Forum

Post a new message
Dataseries X:
9700
9081
9084
9743
8587
9731
9563
9998
9437
10038
9918
9252
9737
9035
9133
9487
8700
9627
8947
9283
8829
9947
9628
9318
9605
8640
9214
9567
8547
9185
9470
9123
9278
10170
9434
9655
9429
8739
9552
9687
9019
9672
9206
9069
9788
10312
10105
9863
9656
9295
9946
9701
9049
10190
9706
9765
9893
9994
10433
10073
10112
9266
9820
10097
9115
10411
9678
10408
10153
10368
10581
10597
10680
9738
9556


Summary of computational transaction
Raw Inputview raw input (R code)
Raw Outputview raw output of R engine
Computing time7 seconds
R Server'George Udny Yule' @ 72.249.76.132

\begin{tabular}{lllllllll}
\hline
Summary of computational transaction \tabularnewline
Raw Input & view raw input (R code)  \tabularnewline
Raw Output & view raw output of R engine  \tabularnewline
Computing time & 7 seconds \tabularnewline
R Server & 'George Udny Yule' @ 72.249.76.132 \tabularnewline
\hline
\end{tabular}
%Source: https://freestatistics.org/blog/index.php?pk=102338&T=0

[TABLE]
[ROW][C]Summary of computational transaction[/C][/ROW]
[ROW][C]Raw Input[/C][C]view raw input (R code) [/C][/ROW]
[ROW][C]Raw Output[/C][C]view raw output of R engine [/C][/ROW]
[ROW][C]Computing time[/C][C]7 seconds[/C][/ROW]
[ROW][C]R Server[/C][C]'George Udny Yule' @ 72.249.76.132[/C][/ROW]
[/TABLE]
Source: https://freestatistics.org/blog/index.php?pk=102338&T=0

Globally Unique Identifier (entire table): ba.freestatistics.org/blog/index.php?pk=102338&T=0

As an alternative you can also use a QR Code:  

The GUIDs for individual cells are displayed in the table below:

Summary of computational transaction
Raw Inputview raw input (R code)
Raw Outputview raw output of R engine
Computing time7 seconds
R Server'George Udny Yule' @ 72.249.76.132


Multiple Linear Regression - Estimated Regression Equation
Gebcijf[t] = + 9793 + 52.5714285714189M1[t] -679.571428571428M2[t] -320.857142857143M3[t] -79.3333333333336M4[t] -956.833333333332M5[t] + 9.66666666666617M6[t] -364.666666666666M7[t] -185.333333333333M8[t] -230.000000000000M9[t] + 345.166666666667M10[t] + 223.5M11[t] + e[t]

\begin{tabular}{lllllllll}
\hline
Multiple Linear Regression - Estimated Regression Equation \tabularnewline
Gebcijf[t] =  +  9793 +  52.5714285714189M1[t] -679.571428571428M2[t] -320.857142857143M3[t] -79.3333333333336M4[t] -956.833333333332M5[t] +  9.66666666666617M6[t] -364.666666666666M7[t] -185.333333333333M8[t] -230.000000000000M9[t] +  345.166666666667M10[t] +  223.5M11[t]  + e[t] \tabularnewline
\hline
\end{tabular}
%Source: https://freestatistics.org/blog/index.php?pk=102338&T=1

[TABLE]
[ROW][C]Multiple Linear Regression - Estimated Regression Equation[/C][/ROW]
[ROW][C]Gebcijf[t] =  +  9793 +  52.5714285714189M1[t] -679.571428571428M2[t] -320.857142857143M3[t] -79.3333333333336M4[t] -956.833333333332M5[t] +  9.66666666666617M6[t] -364.666666666666M7[t] -185.333333333333M8[t] -230.000000000000M9[t] +  345.166666666667M10[t] +  223.5M11[t]  + e[t][/C][/ROW]
[/TABLE]
Source: https://freestatistics.org/blog/index.php?pk=102338&T=1

Globally Unique Identifier (entire table): ba.freestatistics.org/blog/index.php?pk=102338&T=1

As an alternative you can also use a QR Code:  

The GUIDs for individual cells are displayed in the table below:

Multiple Linear Regression - Estimated Regression Equation
Gebcijf[t] = + 9793 + 52.5714285714189M1[t] -679.571428571428M2[t] -320.857142857143M3[t] -79.3333333333336M4[t] -956.833333333332M5[t] + 9.66666666666617M6[t] -364.666666666666M7[t] -185.333333333333M8[t] -230.000000000000M9[t] + 345.166666666667M10[t] + 223.5M11[t] + e[t]


Multiple Linear Regression - Ordinary Least Squares
VariableParameterS.D.T-STATH0: parameter = 02-tail p-value1-tail p-value
(Intercept)9793158.73240361.69500
M152.5714285714189216.3158020.2430.8087710.404385
M2-679.571428571428216.315802-3.14160.002560.00128
M3-320.857142857143216.315802-1.48330.1429850.071493
M4-79.3333333333336224.481516-0.35340.7249630.362482
M5-956.833333333332224.481516-4.26246.9e-053.4e-05
M69.66666666666617224.4815160.04310.9657880.482894
M7-364.666666666666224.481516-1.62450.1092660.054633
M8-185.333333333333224.481516-0.82560.4121430.206072
M9-230.000000000000224.481516-1.02460.3094780.154739
M10345.166666666667224.4815161.53760.129150.064575
M11223.5224.4815160.99560.323240.16162

\begin{tabular}{lllllllll}
\hline
Multiple Linear Regression - Ordinary Least Squares \tabularnewline
Variable & Parameter & S.D. & T-STATH0: parameter = 0 & 2-tail p-value & 1-tail p-value \tabularnewline
(Intercept) & 9793 & 158.732403 & 61.695 & 0 & 0 \tabularnewline
M1 & 52.5714285714189 & 216.315802 & 0.243 & 0.808771 & 0.404385 \tabularnewline
M2 & -679.571428571428 & 216.315802 & -3.1416 & 0.00256 & 0.00128 \tabularnewline
M3 & -320.857142857143 & 216.315802 & -1.4833 & 0.142985 & 0.071493 \tabularnewline
M4 & -79.3333333333336 & 224.481516 & -0.3534 & 0.724963 & 0.362482 \tabularnewline
M5 & -956.833333333332 & 224.481516 & -4.2624 & 6.9e-05 & 3.4e-05 \tabularnewline
M6 & 9.66666666666617 & 224.481516 & 0.0431 & 0.965788 & 0.482894 \tabularnewline
M7 & -364.666666666666 & 224.481516 & -1.6245 & 0.109266 & 0.054633 \tabularnewline
M8 & -185.333333333333 & 224.481516 & -0.8256 & 0.412143 & 0.206072 \tabularnewline
M9 & -230.000000000000 & 224.481516 & -1.0246 & 0.309478 & 0.154739 \tabularnewline
M10 & 345.166666666667 & 224.481516 & 1.5376 & 0.12915 & 0.064575 \tabularnewline
M11 & 223.5 & 224.481516 & 0.9956 & 0.32324 & 0.16162 \tabularnewline
\hline
\end{tabular}
%Source: https://freestatistics.org/blog/index.php?pk=102338&T=2

[TABLE]
[ROW][C]Multiple Linear Regression - Ordinary Least Squares[/C][/ROW]
[ROW][C]Variable[/C][C]Parameter[/C][C]S.D.[/C][C]T-STATH0: parameter = 0[/C][C]2-tail p-value[/C][C]1-tail p-value[/C][/ROW]
[ROW][C](Intercept)[/C][C]9793[/C][C]158.732403[/C][C]61.695[/C][C]0[/C][C]0[/C][/ROW]
[ROW][C]M1[/C][C]52.5714285714189[/C][C]216.315802[/C][C]0.243[/C][C]0.808771[/C][C]0.404385[/C][/ROW]
[ROW][C]M2[/C][C]-679.571428571428[/C][C]216.315802[/C][C]-3.1416[/C][C]0.00256[/C][C]0.00128[/C][/ROW]
[ROW][C]M3[/C][C]-320.857142857143[/C][C]216.315802[/C][C]-1.4833[/C][C]0.142985[/C][C]0.071493[/C][/ROW]
[ROW][C]M4[/C][C]-79.3333333333336[/C][C]224.481516[/C][C]-0.3534[/C][C]0.724963[/C][C]0.362482[/C][/ROW]
[ROW][C]M5[/C][C]-956.833333333332[/C][C]224.481516[/C][C]-4.2624[/C][C]6.9e-05[/C][C]3.4e-05[/C][/ROW]
[ROW][C]M6[/C][C]9.66666666666617[/C][C]224.481516[/C][C]0.0431[/C][C]0.965788[/C][C]0.482894[/C][/ROW]
[ROW][C]M7[/C][C]-364.666666666666[/C][C]224.481516[/C][C]-1.6245[/C][C]0.109266[/C][C]0.054633[/C][/ROW]
[ROW][C]M8[/C][C]-185.333333333333[/C][C]224.481516[/C][C]-0.8256[/C][C]0.412143[/C][C]0.206072[/C][/ROW]
[ROW][C]M9[/C][C]-230.000000000000[/C][C]224.481516[/C][C]-1.0246[/C][C]0.309478[/C][C]0.154739[/C][/ROW]
[ROW][C]M10[/C][C]345.166666666667[/C][C]224.481516[/C][C]1.5376[/C][C]0.12915[/C][C]0.064575[/C][/ROW]
[ROW][C]M11[/C][C]223.5[/C][C]224.481516[/C][C]0.9956[/C][C]0.32324[/C][C]0.16162[/C][/ROW]
[/TABLE]
Source: https://freestatistics.org/blog/index.php?pk=102338&T=2

Globally Unique Identifier (entire table): ba.freestatistics.org/blog/index.php?pk=102338&T=2

As an alternative you can also use a QR Code:  

The GUIDs for individual cells are displayed in the table below:

Multiple Linear Regression - Ordinary Least Squares
VariableParameterS.D.T-STATH0: parameter = 02-tail p-value1-tail p-value
(Intercept)9793158.73240361.69500
M152.5714285714189216.3158020.2430.8087710.404385
M2-679.571428571428216.315802-3.14160.002560.00128
M3-320.857142857143216.315802-1.48330.1429850.071493
M4-79.3333333333336224.481516-0.35340.7249630.362482
M5-956.833333333332224.481516-4.26246.9e-053.4e-05
M69.66666666666617224.4815160.04310.9657880.482894
M7-364.666666666666224.481516-1.62450.1092660.054633
M8-185.333333333333224.481516-0.82560.4121430.206072
M9-230.000000000000224.481516-1.02460.3094780.154739
M10345.166666666667224.4815161.53760.129150.064575
M11223.5224.4815160.99560.323240.16162


Multiple Linear Regression - Regression Statistics
Multiple R0.701030851771317
R-squared0.491444255135219
Adjusted R-squared0.402648807619146
F-TEST (value)5.53456589141309
F-TEST (DF numerator)11
F-TEST (DF denominator)63
p-value4.08818017527679e-06
Multiple Linear Regression - Residual Statistics
Residual Standard Deviation388.813391926637
Sum Squared Residuals9524078.7857143

\begin{tabular}{lllllllll}
\hline
Multiple Linear Regression - Regression Statistics \tabularnewline
Multiple R & 0.701030851771317 \tabularnewline
R-squared & 0.491444255135219 \tabularnewline
Adjusted R-squared & 0.402648807619146 \tabularnewline
F-TEST (value) & 5.53456589141309 \tabularnewline
F-TEST (DF numerator) & 11 \tabularnewline
F-TEST (DF denominator) & 63 \tabularnewline
p-value & 4.08818017527679e-06 \tabularnewline
Multiple Linear Regression - Residual Statistics \tabularnewline
Residual Standard Deviation & 388.813391926637 \tabularnewline
Sum Squared Residuals & 9524078.7857143 \tabularnewline
\hline
\end{tabular}
%Source: https://freestatistics.org/blog/index.php?pk=102338&T=3

[TABLE]
[ROW][C]Multiple Linear Regression - Regression Statistics[/C][/ROW]
[ROW][C]Multiple R[/C][C]0.701030851771317[/C][/ROW]
[ROW][C]R-squared[/C][C]0.491444255135219[/C][/ROW]
[ROW][C]Adjusted R-squared[/C][C]0.402648807619146[/C][/ROW]
[ROW][C]F-TEST (value)[/C][C]5.53456589141309[/C][/ROW]
[ROW][C]F-TEST (DF numerator)[/C][C]11[/C][/ROW]
[ROW][C]F-TEST (DF denominator)[/C][C]63[/C][/ROW]
[ROW][C]p-value[/C][C]4.08818017527679e-06[/C][/ROW]
[ROW][C]Multiple Linear Regression - Residual Statistics[/C][/ROW]
[ROW][C]Residual Standard Deviation[/C][C]388.813391926637[/C][/ROW]
[ROW][C]Sum Squared Residuals[/C][C]9524078.7857143[/C][/ROW]
[/TABLE]
Source: https://freestatistics.org/blog/index.php?pk=102338&T=3

Globally Unique Identifier (entire table): ba.freestatistics.org/blog/index.php?pk=102338&T=3

As an alternative you can also use a QR Code:  

The GUIDs for individual cells are displayed in the table below:

Multiple Linear Regression - Regression Statistics
Multiple R0.701030851771317
R-squared0.491444255135219
Adjusted R-squared0.402648807619146
F-TEST (value)5.53456589141309
F-TEST (DF numerator)11
F-TEST (DF denominator)63
p-value4.08818017527679e-06
Multiple Linear Regression - Residual Statistics
Residual Standard Deviation388.813391926637
Sum Squared Residuals9524078.7857143


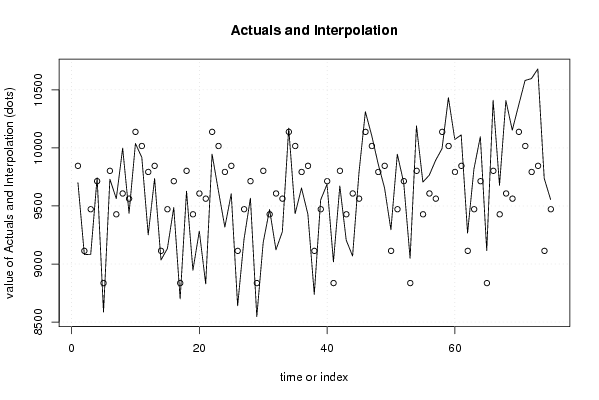
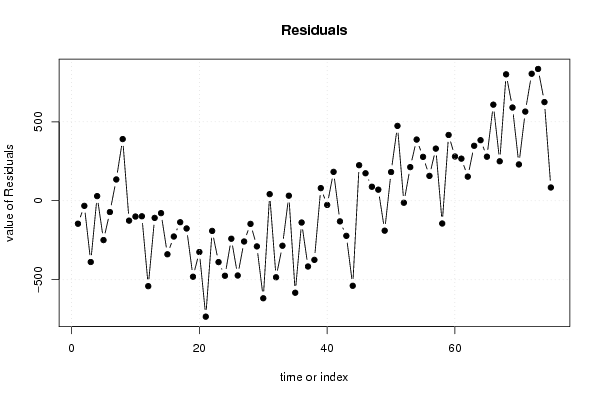
Multiple Linear Regression - Actuals, Interpolation, and Residuals
Time or IndexActualsInterpolationForecastResidualsPrediction Error
197009845.57142857148-145.571428571482
290819113.42857142857-32.4285714285699
390849472.14285714286-388.142857142858
497439713.6666666666729.3333333333337
585878836.16666666667-249.166666666666
697319802.66666666667-71.6666666666681
795639428.33333333333134.666666666667
899989607.66666666667390.333333333334
994379563-126.000000000000
101003810138.1666666667-100.166666666666
11991810016.5-98.5000000000001
1292529793-541
1397379845.57142857142-108.571428571420
1490359113.42857142857-78.4285714285718
1591339472.14285714286-339.142857142857
1694879713.66666666667-226.666666666667
1787008836.16666666667-136.166666666667
1896279802.66666666667-175.666666666666
1989479428.33333333333-481.333333333333
2092839607.66666666667-324.666666666667
2188299563-734
22994710138.1666666667-191.166666666667
23962810016.5-388.5
2493189793-475
2596059845.57142857142-240.571428571420
2686409113.42857142857-473.428571428572
2792149472.14285714286-258.142857142857
2895679713.66666666667-146.666666666667
2985478836.16666666667-289.166666666667
3091859802.66666666667-617.666666666666
3194709428.3333333333341.6666666666665
3291239607.66666666667-484.666666666666
3392789563-285
341017010138.166666666731.8333333333334
35943410016.5-582.5
3696559793-138
3794299845.57142857142-416.571428571420
3887399113.42857142857-374.428571428572
3995529472.1428571428679.857142857143
4096879713.66666666667-26.6666666666665
4190198836.16666666667182.833333333333
4296729802.66666666667-130.666666666666
4392069428.33333333333-222.333333333334
4490699607.66666666667-538.666666666666
4597889563225
461031210138.1666666667173.833333333333
471010510016.588.500
489863979370
4996569845.57142857142-189.571428571420
5092959113.42857142857181.571428571428
5199469472.14285714286473.857142857143
5297019713.66666666667-12.6666666666665
5390498836.16666666667212.833333333333
54101909802.66666666667387.333333333334
5597069428.33333333333277.666666666667
5697659607.66666666667157.333333333333
5798939563330
58999410138.1666666667-144.166666666667
591043310016.5416.5
60100739793280
61101129845.57142857142266.428571428580
6292669113.42857142857152.571428571428
6398209472.14285714286347.857142857143
64100979713.66666666667383.333333333333
6591158836.16666666667278.833333333333
66104119802.66666666667608.333333333334
6796789428.33333333333249.666666666667
68104089607.66666666667800.333333333334
69101539563590
701036810138.1666666667229.833333333333
711058110016.5564.5
72105979793804
73106809845.57142857142834.42857142858
7497389113.42857142857624.571428571428
7595569472.1428571428683.857142857143

\begin{tabular}{lllllllll}
\hline
Multiple Linear Regression - Actuals, Interpolation, and Residuals \tabularnewline
Time or Index & Actuals & InterpolationForecast & ResidualsPrediction Error \tabularnewline
1 & 9700 & 9845.57142857148 & -145.571428571482 \tabularnewline
2 & 9081 & 9113.42857142857 & -32.4285714285699 \tabularnewline
3 & 9084 & 9472.14285714286 & -388.142857142858 \tabularnewline
4 & 9743 & 9713.66666666667 & 29.3333333333337 \tabularnewline
5 & 8587 & 8836.16666666667 & -249.166666666666 \tabularnewline
6 & 9731 & 9802.66666666667 & -71.6666666666681 \tabularnewline
7 & 9563 & 9428.33333333333 & 134.666666666667 \tabularnewline
8 & 9998 & 9607.66666666667 & 390.333333333334 \tabularnewline
9 & 9437 & 9563 & -126.000000000000 \tabularnewline
10 & 10038 & 10138.1666666667 & -100.166666666666 \tabularnewline
11 & 9918 & 10016.5 & -98.5000000000001 \tabularnewline
12 & 9252 & 9793 & -541 \tabularnewline
13 & 9737 & 9845.57142857142 & -108.571428571420 \tabularnewline
14 & 9035 & 9113.42857142857 & -78.4285714285718 \tabularnewline
15 & 9133 & 9472.14285714286 & -339.142857142857 \tabularnewline
16 & 9487 & 9713.66666666667 & -226.666666666667 \tabularnewline
17 & 8700 & 8836.16666666667 & -136.166666666667 \tabularnewline
18 & 9627 & 9802.66666666667 & -175.666666666666 \tabularnewline
19 & 8947 & 9428.33333333333 & -481.333333333333 \tabularnewline
20 & 9283 & 9607.66666666667 & -324.666666666667 \tabularnewline
21 & 8829 & 9563 & -734 \tabularnewline
22 & 9947 & 10138.1666666667 & -191.166666666667 \tabularnewline
23 & 9628 & 10016.5 & -388.5 \tabularnewline
24 & 9318 & 9793 & -475 \tabularnewline
25 & 9605 & 9845.57142857142 & -240.571428571420 \tabularnewline
26 & 8640 & 9113.42857142857 & -473.428571428572 \tabularnewline
27 & 9214 & 9472.14285714286 & -258.142857142857 \tabularnewline
28 & 9567 & 9713.66666666667 & -146.666666666667 \tabularnewline
29 & 8547 & 8836.16666666667 & -289.166666666667 \tabularnewline
30 & 9185 & 9802.66666666667 & -617.666666666666 \tabularnewline
31 & 9470 & 9428.33333333333 & 41.6666666666665 \tabularnewline
32 & 9123 & 9607.66666666667 & -484.666666666666 \tabularnewline
33 & 9278 & 9563 & -285 \tabularnewline
34 & 10170 & 10138.1666666667 & 31.8333333333334 \tabularnewline
35 & 9434 & 10016.5 & -582.5 \tabularnewline
36 & 9655 & 9793 & -138 \tabularnewline
37 & 9429 & 9845.57142857142 & -416.571428571420 \tabularnewline
38 & 8739 & 9113.42857142857 & -374.428571428572 \tabularnewline
39 & 9552 & 9472.14285714286 & 79.857142857143 \tabularnewline
40 & 9687 & 9713.66666666667 & -26.6666666666665 \tabularnewline
41 & 9019 & 8836.16666666667 & 182.833333333333 \tabularnewline
42 & 9672 & 9802.66666666667 & -130.666666666666 \tabularnewline
43 & 9206 & 9428.33333333333 & -222.333333333334 \tabularnewline
44 & 9069 & 9607.66666666667 & -538.666666666666 \tabularnewline
45 & 9788 & 9563 & 225 \tabularnewline
46 & 10312 & 10138.1666666667 & 173.833333333333 \tabularnewline
47 & 10105 & 10016.5 & 88.500 \tabularnewline
48 & 9863 & 9793 & 70 \tabularnewline
49 & 9656 & 9845.57142857142 & -189.571428571420 \tabularnewline
50 & 9295 & 9113.42857142857 & 181.571428571428 \tabularnewline
51 & 9946 & 9472.14285714286 & 473.857142857143 \tabularnewline
52 & 9701 & 9713.66666666667 & -12.6666666666665 \tabularnewline
53 & 9049 & 8836.16666666667 & 212.833333333333 \tabularnewline
54 & 10190 & 9802.66666666667 & 387.333333333334 \tabularnewline
55 & 9706 & 9428.33333333333 & 277.666666666667 \tabularnewline
56 & 9765 & 9607.66666666667 & 157.333333333333 \tabularnewline
57 & 9893 & 9563 & 330 \tabularnewline
58 & 9994 & 10138.1666666667 & -144.166666666667 \tabularnewline
59 & 10433 & 10016.5 & 416.5 \tabularnewline
60 & 10073 & 9793 & 280 \tabularnewline
61 & 10112 & 9845.57142857142 & 266.428571428580 \tabularnewline
62 & 9266 & 9113.42857142857 & 152.571428571428 \tabularnewline
63 & 9820 & 9472.14285714286 & 347.857142857143 \tabularnewline
64 & 10097 & 9713.66666666667 & 383.333333333333 \tabularnewline
65 & 9115 & 8836.16666666667 & 278.833333333333 \tabularnewline
66 & 10411 & 9802.66666666667 & 608.333333333334 \tabularnewline
67 & 9678 & 9428.33333333333 & 249.666666666667 \tabularnewline
68 & 10408 & 9607.66666666667 & 800.333333333334 \tabularnewline
69 & 10153 & 9563 & 590 \tabularnewline
70 & 10368 & 10138.1666666667 & 229.833333333333 \tabularnewline
71 & 10581 & 10016.5 & 564.5 \tabularnewline
72 & 10597 & 9793 & 804 \tabularnewline
73 & 10680 & 9845.57142857142 & 834.42857142858 \tabularnewline
74 & 9738 & 9113.42857142857 & 624.571428571428 \tabularnewline
75 & 9556 & 9472.14285714286 & 83.857142857143 \tabularnewline
\hline
\end{tabular}
%Source: https://freestatistics.org/blog/index.php?pk=102338&T=4

[TABLE]
[ROW][C]Multiple Linear Regression - Actuals, Interpolation, and Residuals[/C][/ROW]
[ROW][C]Time or Index[/C][C]Actuals[/C][C]InterpolationForecast[/C][C]ResidualsPrediction Error[/C][/ROW]
[ROW][C]1[/C][C]9700[/C][C]9845.57142857148[/C][C]-145.571428571482[/C][/ROW]
[ROW][C]2[/C][C]9081[/C][C]9113.42857142857[/C][C]-32.4285714285699[/C][/ROW]
[ROW][C]3[/C][C]9084[/C][C]9472.14285714286[/C][C]-388.142857142858[/C][/ROW]
[ROW][C]4[/C][C]9743[/C][C]9713.66666666667[/C][C]29.3333333333337[/C][/ROW]
[ROW][C]5[/C][C]8587[/C][C]8836.16666666667[/C][C]-249.166666666666[/C][/ROW]
[ROW][C]6[/C][C]9731[/C][C]9802.66666666667[/C][C]-71.6666666666681[/C][/ROW]
[ROW][C]7[/C][C]9563[/C][C]9428.33333333333[/C][C]134.666666666667[/C][/ROW]
[ROW][C]8[/C][C]9998[/C][C]9607.66666666667[/C][C]390.333333333334[/C][/ROW]
[ROW][C]9[/C][C]9437[/C][C]9563[/C][C]-126.000000000000[/C][/ROW]
[ROW][C]10[/C][C]10038[/C][C]10138.1666666667[/C][C]-100.166666666666[/C][/ROW]
[ROW][C]11[/C][C]9918[/C][C]10016.5[/C][C]-98.5000000000001[/C][/ROW]
[ROW][C]12[/C][C]9252[/C][C]9793[/C][C]-541[/C][/ROW]
[ROW][C]13[/C][C]9737[/C][C]9845.57142857142[/C][C]-108.571428571420[/C][/ROW]
[ROW][C]14[/C][C]9035[/C][C]9113.42857142857[/C][C]-78.4285714285718[/C][/ROW]
[ROW][C]15[/C][C]9133[/C][C]9472.14285714286[/C][C]-339.142857142857[/C][/ROW]
[ROW][C]16[/C][C]9487[/C][C]9713.66666666667[/C][C]-226.666666666667[/C][/ROW]
[ROW][C]17[/C][C]8700[/C][C]8836.16666666667[/C][C]-136.166666666667[/C][/ROW]
[ROW][C]18[/C][C]9627[/C][C]9802.66666666667[/C][C]-175.666666666666[/C][/ROW]
[ROW][C]19[/C][C]8947[/C][C]9428.33333333333[/C][C]-481.333333333333[/C][/ROW]
[ROW][C]20[/C][C]9283[/C][C]9607.66666666667[/C][C]-324.666666666667[/C][/ROW]
[ROW][C]21[/C][C]8829[/C][C]9563[/C][C]-734[/C][/ROW]
[ROW][C]22[/C][C]9947[/C][C]10138.1666666667[/C][C]-191.166666666667[/C][/ROW]
[ROW][C]23[/C][C]9628[/C][C]10016.5[/C][C]-388.5[/C][/ROW]
[ROW][C]24[/C][C]9318[/C][C]9793[/C][C]-475[/C][/ROW]
[ROW][C]25[/C][C]9605[/C][C]9845.57142857142[/C][C]-240.571428571420[/C][/ROW]
[ROW][C]26[/C][C]8640[/C][C]9113.42857142857[/C][C]-473.428571428572[/C][/ROW]
[ROW][C]27[/C][C]9214[/C][C]9472.14285714286[/C][C]-258.142857142857[/C][/ROW]
[ROW][C]28[/C][C]9567[/C][C]9713.66666666667[/C][C]-146.666666666667[/C][/ROW]
[ROW][C]29[/C][C]8547[/C][C]8836.16666666667[/C][C]-289.166666666667[/C][/ROW]
[ROW][C]30[/C][C]9185[/C][C]9802.66666666667[/C][C]-617.666666666666[/C][/ROW]
[ROW][C]31[/C][C]9470[/C][C]9428.33333333333[/C][C]41.6666666666665[/C][/ROW]
[ROW][C]32[/C][C]9123[/C][C]9607.66666666667[/C][C]-484.666666666666[/C][/ROW]
[ROW][C]33[/C][C]9278[/C][C]9563[/C][C]-285[/C][/ROW]
[ROW][C]34[/C][C]10170[/C][C]10138.1666666667[/C][C]31.8333333333334[/C][/ROW]
[ROW][C]35[/C][C]9434[/C][C]10016.5[/C][C]-582.5[/C][/ROW]
[ROW][C]36[/C][C]9655[/C][C]9793[/C][C]-138[/C][/ROW]
[ROW][C]37[/C][C]9429[/C][C]9845.57142857142[/C][C]-416.571428571420[/C][/ROW]
[ROW][C]38[/C][C]8739[/C][C]9113.42857142857[/C][C]-374.428571428572[/C][/ROW]
[ROW][C]39[/C][C]9552[/C][C]9472.14285714286[/C][C]79.857142857143[/C][/ROW]
[ROW][C]40[/C][C]9687[/C][C]9713.66666666667[/C][C]-26.6666666666665[/C][/ROW]
[ROW][C]41[/C][C]9019[/C][C]8836.16666666667[/C][C]182.833333333333[/C][/ROW]
[ROW][C]42[/C][C]9672[/C][C]9802.66666666667[/C][C]-130.666666666666[/C][/ROW]
[ROW][C]43[/C][C]9206[/C][C]9428.33333333333[/C][C]-222.333333333334[/C][/ROW]
[ROW][C]44[/C][C]9069[/C][C]9607.66666666667[/C][C]-538.666666666666[/C][/ROW]
[ROW][C]45[/C][C]9788[/C][C]9563[/C][C]225[/C][/ROW]
[ROW][C]46[/C][C]10312[/C][C]10138.1666666667[/C][C]173.833333333333[/C][/ROW]
[ROW][C]47[/C][C]10105[/C][C]10016.5[/C][C]88.500[/C][/ROW]
[ROW][C]48[/C][C]9863[/C][C]9793[/C][C]70[/C][/ROW]
[ROW][C]49[/C][C]9656[/C][C]9845.57142857142[/C][C]-189.571428571420[/C][/ROW]
[ROW][C]50[/C][C]9295[/C][C]9113.42857142857[/C][C]181.571428571428[/C][/ROW]
[ROW][C]51[/C][C]9946[/C][C]9472.14285714286[/C][C]473.857142857143[/C][/ROW]
[ROW][C]52[/C][C]9701[/C][C]9713.66666666667[/C][C]-12.6666666666665[/C][/ROW]
[ROW][C]53[/C][C]9049[/C][C]8836.16666666667[/C][C]212.833333333333[/C][/ROW]
[ROW][C]54[/C][C]10190[/C][C]9802.66666666667[/C][C]387.333333333334[/C][/ROW]
[ROW][C]55[/C][C]9706[/C][C]9428.33333333333[/C][C]277.666666666667[/C][/ROW]
[ROW][C]56[/C][C]9765[/C][C]9607.66666666667[/C][C]157.333333333333[/C][/ROW]
[ROW][C]57[/C][C]9893[/C][C]9563[/C][C]330[/C][/ROW]
[ROW][C]58[/C][C]9994[/C][C]10138.1666666667[/C][C]-144.166666666667[/C][/ROW]
[ROW][C]59[/C][C]10433[/C][C]10016.5[/C][C]416.5[/C][/ROW]
[ROW][C]60[/C][C]10073[/C][C]9793[/C][C]280[/C][/ROW]
[ROW][C]61[/C][C]10112[/C][C]9845.57142857142[/C][C]266.428571428580[/C][/ROW]
[ROW][C]62[/C][C]9266[/C][C]9113.42857142857[/C][C]152.571428571428[/C][/ROW]
[ROW][C]63[/C][C]9820[/C][C]9472.14285714286[/C][C]347.857142857143[/C][/ROW]
[ROW][C]64[/C][C]10097[/C][C]9713.66666666667[/C][C]383.333333333333[/C][/ROW]
[ROW][C]65[/C][C]9115[/C][C]8836.16666666667[/C][C]278.833333333333[/C][/ROW]
[ROW][C]66[/C][C]10411[/C][C]9802.66666666667[/C][C]608.333333333334[/C][/ROW]
[ROW][C]67[/C][C]9678[/C][C]9428.33333333333[/C][C]249.666666666667[/C][/ROW]
[ROW][C]68[/C][C]10408[/C][C]9607.66666666667[/C][C]800.333333333334[/C][/ROW]
[ROW][C]69[/C][C]10153[/C][C]9563[/C][C]590[/C][/ROW]
[ROW][C]70[/C][C]10368[/C][C]10138.1666666667[/C][C]229.833333333333[/C][/ROW]
[ROW][C]71[/C][C]10581[/C][C]10016.5[/C][C]564.5[/C][/ROW]
[ROW][C]72[/C][C]10597[/C][C]9793[/C][C]804[/C][/ROW]
[ROW][C]73[/C][C]10680[/C][C]9845.57142857142[/C][C]834.42857142858[/C][/ROW]
[ROW][C]74[/C][C]9738[/C][C]9113.42857142857[/C][C]624.571428571428[/C][/ROW]
[ROW][C]75[/C][C]9556[/C][C]9472.14285714286[/C][C]83.857142857143[/C][/ROW]
[/TABLE]
Source: https://freestatistics.org/blog/index.php?pk=102338&T=4

Globally Unique Identifier (entire table): ba.freestatistics.org/blog/index.php?pk=102338&T=4

As an alternative you can also use a QR Code:  

The GUIDs for individual cells are displayed in the table below:

Multiple Linear Regression - Actuals, Interpolation, and Residuals
Time or IndexActualsInterpolationForecastResidualsPrediction Error
197009845.57142857148-145.571428571482
290819113.42857142857-32.4285714285699
390849472.14285714286-388.142857142858
497439713.6666666666729.3333333333337
585878836.16666666667-249.166666666666
697319802.66666666667-71.6666666666681
795639428.33333333333134.666666666667
899989607.66666666667390.333333333334
994379563-126.000000000000
101003810138.1666666667-100.166666666666
11991810016.5-98.5000000000001
1292529793-541
1397379845.57142857142-108.571428571420
1490359113.42857142857-78.4285714285718
1591339472.14285714286-339.142857142857
1694879713.66666666667-226.666666666667
1787008836.16666666667-136.166666666667
1896279802.66666666667-175.666666666666
1989479428.33333333333-481.333333333333
2092839607.66666666667-324.666666666667
2188299563-734
22994710138.1666666667-191.166666666667
23962810016.5-388.5
2493189793-475
2596059845.57142857142-240.571428571420
2686409113.42857142857-473.428571428572
2792149472.14285714286-258.142857142857
2895679713.66666666667-146.666666666667
2985478836.16666666667-289.166666666667
3091859802.66666666667-617.666666666666
3194709428.3333333333341.6666666666665
3291239607.66666666667-484.666666666666
3392789563-285
341017010138.166666666731.8333333333334
35943410016.5-582.5
3696559793-138
3794299845.57142857142-416.571428571420
3887399113.42857142857-374.428571428572
3995529472.1428571428679.857142857143
4096879713.66666666667-26.6666666666665
4190198836.16666666667182.833333333333
4296729802.66666666667-130.666666666666
4392069428.33333333333-222.333333333334
4490699607.66666666667-538.666666666666
4597889563225
461031210138.1666666667173.833333333333
471010510016.588.500
489863979370
4996569845.57142857142-189.571428571420
5092959113.42857142857181.571428571428
5199469472.14285714286473.857142857143
5297019713.66666666667-12.6666666666665
5390498836.16666666667212.833333333333
54101909802.66666666667387.333333333334
5597069428.33333333333277.666666666667
5697659607.66666666667157.333333333333
5798939563330
58999410138.1666666667-144.166666666667
591043310016.5416.5
60100739793280
61101129845.57142857142266.428571428580
6292669113.42857142857152.571428571428
6398209472.14285714286347.857142857143
64100979713.66666666667383.333333333333
6591158836.16666666667278.833333333333
66104119802.66666666667608.333333333334
6796789428.33333333333249.666666666667
68104089607.66666666667800.333333333334
69101539563590
701036810138.1666666667229.833333333333
711058110016.5564.5
72105979793804
73106809845.57142857142834.42857142858
7497389113.42857142857624.571428571428
7595569472.1428571428683.857142857143


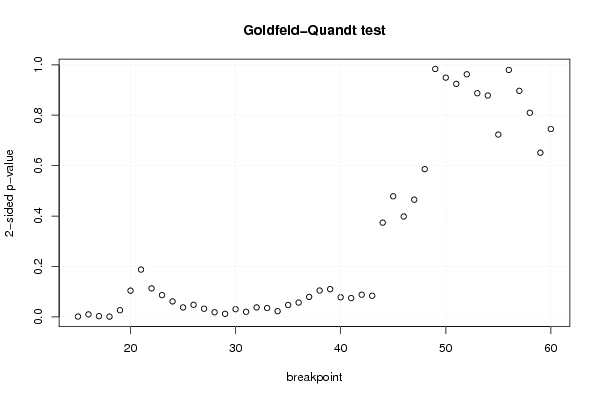
Goldfeld-Quandt test for Heteroskedasticity
p-valuesAlternative Hypothesis
breakpoint indexgreater2-sidedless
150.0005841378025156230.001168275605031250.999415862197484
160.004891751415728910.009783502831457810.995108248584271
170.001375906255346370.002751812510692750.998624093744654
180.0003671795874007170.0007343591748014340.9996328204126
190.01311698207265950.02623396414531900.98688301792734
200.05194883351495690.1038976670299140.948051166485043
210.09373556923665410.1874711384733080.906264430763346
220.05651775683649290.1130355136729860.943482243163507
230.04309697873061070.08619395746122130.95690302126939
240.03063599467960600.06127198935921210.969364005320394
250.01863694937896790.03727389875793580.981363050621032
260.02389309340018130.04778618680036260.976106906599819
270.01603483759855190.03206967519710380.983965162401448
280.009066445482236890.01813289096447380.990933554517763
290.005914050755724460.01182810151144890.994085949244276
300.01516090999015360.03032181998030720.984839090009846
310.01000723753996950.02001447507993910.98999276246003
320.01870765738680350.03741531477360690.981292342613197
330.01745088264312460.03490176528624910.982549117356875
340.01120684016825870.02241368033651740.988793159831741
350.02350501740533890.04701003481067790.97649498259466
360.02827127603858380.05654255207716760.971728723961416
370.0395815469910390.0791630939820780.96041845300896
380.05217894135503520.1043578827100700.947821058644965
390.05494628275000690.1098925655000140.945053717249993
400.03877985982308160.07755971964616320.961220140176918
410.03723310667049620.07446621334099250.962766893329504
420.0438800226041320.0877600452082640.956119977395868
430.04178685147540530.08357370295081060.958213148524595
440.1868823196869710.3737646393739430.813117680313029
450.2391066296596880.4782132593193760.760893370340312
460.1990238203755860.3980476407511720.800976179624414
470.2324067979180750.464813595836150.767593202081925
480.2929953964453300.5859907928906590.70700460355467
490.4917224980194620.9834449960389240.508277501980538
500.4745148401880570.9490296803761140.525485159811943
510.5378655666868060.9242688666263880.462134433313194
520.5188789329169110.9622421341661780.481121067083089
530.4435903865968540.8871807731937080.556409613403146
540.4390328967359270.8780657934718530.560967103264073
550.3615475788931090.7230951577862170.638452421106891
560.4897162813761080.9794325627522150.510283718623892
570.4483292879257770.8966585758515540.551670712074223
580.404797858045740.809595716091480.59520214195426
590.3256415951637020.6512831903274050.674358404836298
600.3725795559701320.7451591119402630.627420444029868

\begin{tabular}{lllllllll}
\hline
Goldfeld-Quandt test for Heteroskedasticity \tabularnewline
p-values & Alternative Hypothesis \tabularnewline
breakpoint index & greater & 2-sided & less \tabularnewline
15 & 0.000584137802515623 & 0.00116827560503125 & 0.999415862197484 \tabularnewline
16 & 0.00489175141572891 & 0.00978350283145781 & 0.995108248584271 \tabularnewline
17 & 0.00137590625534637 & 0.00275181251069275 & 0.998624093744654 \tabularnewline
18 & 0.000367179587400717 & 0.000734359174801434 & 0.9996328204126 \tabularnewline
19 & 0.0131169820726595 & 0.0262339641453190 & 0.98688301792734 \tabularnewline
20 & 0.0519488335149569 & 0.103897667029914 & 0.948051166485043 \tabularnewline
21 & 0.0937355692366541 & 0.187471138473308 & 0.906264430763346 \tabularnewline
22 & 0.0565177568364929 & 0.113035513672986 & 0.943482243163507 \tabularnewline
23 & 0.0430969787306107 & 0.0861939574612213 & 0.95690302126939 \tabularnewline
24 & 0.0306359946796060 & 0.0612719893592121 & 0.969364005320394 \tabularnewline
25 & 0.0186369493789679 & 0.0372738987579358 & 0.981363050621032 \tabularnewline
26 & 0.0238930934001813 & 0.0477861868003626 & 0.976106906599819 \tabularnewline
27 & 0.0160348375985519 & 0.0320696751971038 & 0.983965162401448 \tabularnewline
28 & 0.00906644548223689 & 0.0181328909644738 & 0.990933554517763 \tabularnewline
29 & 0.00591405075572446 & 0.0118281015114489 & 0.994085949244276 \tabularnewline
30 & 0.0151609099901536 & 0.0303218199803072 & 0.984839090009846 \tabularnewline
31 & 0.0100072375399695 & 0.0200144750799391 & 0.98999276246003 \tabularnewline
32 & 0.0187076573868035 & 0.0374153147736069 & 0.981292342613197 \tabularnewline
33 & 0.0174508826431246 & 0.0349017652862491 & 0.982549117356875 \tabularnewline
34 & 0.0112068401682587 & 0.0224136803365174 & 0.988793159831741 \tabularnewline
35 & 0.0235050174053389 & 0.0470100348106779 & 0.97649498259466 \tabularnewline
36 & 0.0282712760385838 & 0.0565425520771676 & 0.971728723961416 \tabularnewline
37 & 0.039581546991039 & 0.079163093982078 & 0.96041845300896 \tabularnewline
38 & 0.0521789413550352 & 0.104357882710070 & 0.947821058644965 \tabularnewline
39 & 0.0549462827500069 & 0.109892565500014 & 0.945053717249993 \tabularnewline
40 & 0.0387798598230816 & 0.0775597196461632 & 0.961220140176918 \tabularnewline
41 & 0.0372331066704962 & 0.0744662133409925 & 0.962766893329504 \tabularnewline
42 & 0.043880022604132 & 0.087760045208264 & 0.956119977395868 \tabularnewline
43 & 0.0417868514754053 & 0.0835737029508106 & 0.958213148524595 \tabularnewline
44 & 0.186882319686971 & 0.373764639373943 & 0.813117680313029 \tabularnewline
45 & 0.239106629659688 & 0.478213259319376 & 0.760893370340312 \tabularnewline
46 & 0.199023820375586 & 0.398047640751172 & 0.800976179624414 \tabularnewline
47 & 0.232406797918075 & 0.46481359583615 & 0.767593202081925 \tabularnewline
48 & 0.292995396445330 & 0.585990792890659 & 0.70700460355467 \tabularnewline
49 & 0.491722498019462 & 0.983444996038924 & 0.508277501980538 \tabularnewline
50 & 0.474514840188057 & 0.949029680376114 & 0.525485159811943 \tabularnewline
51 & 0.537865566686806 & 0.924268866626388 & 0.462134433313194 \tabularnewline
52 & 0.518878932916911 & 0.962242134166178 & 0.481121067083089 \tabularnewline
53 & 0.443590386596854 & 0.887180773193708 & 0.556409613403146 \tabularnewline
54 & 0.439032896735927 & 0.878065793471853 & 0.560967103264073 \tabularnewline
55 & 0.361547578893109 & 0.723095157786217 & 0.638452421106891 \tabularnewline
56 & 0.489716281376108 & 0.979432562752215 & 0.510283718623892 \tabularnewline
57 & 0.448329287925777 & 0.896658575851554 & 0.551670712074223 \tabularnewline
58 & 0.40479785804574 & 0.80959571609148 & 0.59520214195426 \tabularnewline
59 & 0.325641595163702 & 0.651283190327405 & 0.674358404836298 \tabularnewline
60 & 0.372579555970132 & 0.745159111940263 & 0.627420444029868 \tabularnewline
\hline
\end{tabular}
%Source: https://freestatistics.org/blog/index.php?pk=102338&T=5

[TABLE]
[ROW][C]Goldfeld-Quandt test for Heteroskedasticity[/C][/ROW]
[ROW][C]p-values[/C][C]Alternative Hypothesis[/C][/ROW]
[ROW][C]breakpoint index[/C][C]greater[/C][C]2-sided[/C][C]less[/C][/ROW]
[ROW][C]15[/C][C]0.000584137802515623[/C][C]0.00116827560503125[/C][C]0.999415862197484[/C][/ROW]
[ROW][C]16[/C][C]0.00489175141572891[/C][C]0.00978350283145781[/C][C]0.995108248584271[/C][/ROW]
[ROW][C]17[/C][C]0.00137590625534637[/C][C]0.00275181251069275[/C][C]0.998624093744654[/C][/ROW]
[ROW][C]18[/C][C]0.000367179587400717[/C][C]0.000734359174801434[/C][C]0.9996328204126[/C][/ROW]
[ROW][C]19[/C][C]0.0131169820726595[/C][C]0.0262339641453190[/C][C]0.98688301792734[/C][/ROW]
[ROW][C]20[/C][C]0.0519488335149569[/C][C]0.103897667029914[/C][C]0.948051166485043[/C][/ROW]
[ROW][C]21[/C][C]0.0937355692366541[/C][C]0.187471138473308[/C][C]0.906264430763346[/C][/ROW]
[ROW][C]22[/C][C]0.0565177568364929[/C][C]0.113035513672986[/C][C]0.943482243163507[/C][/ROW]
[ROW][C]23[/C][C]0.0430969787306107[/C][C]0.0861939574612213[/C][C]0.95690302126939[/C][/ROW]
[ROW][C]24[/C][C]0.0306359946796060[/C][C]0.0612719893592121[/C][C]0.969364005320394[/C][/ROW]
[ROW][C]25[/C][C]0.0186369493789679[/C][C]0.0372738987579358[/C][C]0.981363050621032[/C][/ROW]
[ROW][C]26[/C][C]0.0238930934001813[/C][C]0.0477861868003626[/C][C]0.976106906599819[/C][/ROW]
[ROW][C]27[/C][C]0.0160348375985519[/C][C]0.0320696751971038[/C][C]0.983965162401448[/C][/ROW]
[ROW][C]28[/C][C]0.00906644548223689[/C][C]0.0181328909644738[/C][C]0.990933554517763[/C][/ROW]
[ROW][C]29[/C][C]0.00591405075572446[/C][C]0.0118281015114489[/C][C]0.994085949244276[/C][/ROW]
[ROW][C]30[/C][C]0.0151609099901536[/C][C]0.0303218199803072[/C][C]0.984839090009846[/C][/ROW]
[ROW][C]31[/C][C]0.0100072375399695[/C][C]0.0200144750799391[/C][C]0.98999276246003[/C][/ROW]
[ROW][C]32[/C][C]0.0187076573868035[/C][C]0.0374153147736069[/C][C]0.981292342613197[/C][/ROW]
[ROW][C]33[/C][C]0.0174508826431246[/C][C]0.0349017652862491[/C][C]0.982549117356875[/C][/ROW]
[ROW][C]34[/C][C]0.0112068401682587[/C][C]0.0224136803365174[/C][C]0.988793159831741[/C][/ROW]
[ROW][C]35[/C][C]0.0235050174053389[/C][C]0.0470100348106779[/C][C]0.97649498259466[/C][/ROW]
[ROW][C]36[/C][C]0.0282712760385838[/C][C]0.0565425520771676[/C][C]0.971728723961416[/C][/ROW]
[ROW][C]37[/C][C]0.039581546991039[/C][C]0.079163093982078[/C][C]0.96041845300896[/C][/ROW]
[ROW][C]38[/C][C]0.0521789413550352[/C][C]0.104357882710070[/C][C]0.947821058644965[/C][/ROW]
[ROW][C]39[/C][C]0.0549462827500069[/C][C]0.109892565500014[/C][C]0.945053717249993[/C][/ROW]
[ROW][C]40[/C][C]0.0387798598230816[/C][C]0.0775597196461632[/C][C]0.961220140176918[/C][/ROW]
[ROW][C]41[/C][C]0.0372331066704962[/C][C]0.0744662133409925[/C][C]0.962766893329504[/C][/ROW]
[ROW][C]42[/C][C]0.043880022604132[/C][C]0.087760045208264[/C][C]0.956119977395868[/C][/ROW]
[ROW][C]43[/C][C]0.0417868514754053[/C][C]0.0835737029508106[/C][C]0.958213148524595[/C][/ROW]
[ROW][C]44[/C][C]0.186882319686971[/C][C]0.373764639373943[/C][C]0.813117680313029[/C][/ROW]
[ROW][C]45[/C][C]0.239106629659688[/C][C]0.478213259319376[/C][C]0.760893370340312[/C][/ROW]
[ROW][C]46[/C][C]0.199023820375586[/C][C]0.398047640751172[/C][C]0.800976179624414[/C][/ROW]
[ROW][C]47[/C][C]0.232406797918075[/C][C]0.46481359583615[/C][C]0.767593202081925[/C][/ROW]
[ROW][C]48[/C][C]0.292995396445330[/C][C]0.585990792890659[/C][C]0.70700460355467[/C][/ROW]
[ROW][C]49[/C][C]0.491722498019462[/C][C]0.983444996038924[/C][C]0.508277501980538[/C][/ROW]
[ROW][C]50[/C][C]0.474514840188057[/C][C]0.949029680376114[/C][C]0.525485159811943[/C][/ROW]
[ROW][C]51[/C][C]0.537865566686806[/C][C]0.924268866626388[/C][C]0.462134433313194[/C][/ROW]
[ROW][C]52[/C][C]0.518878932916911[/C][C]0.962242134166178[/C][C]0.481121067083089[/C][/ROW]
[ROW][C]53[/C][C]0.443590386596854[/C][C]0.887180773193708[/C][C]0.556409613403146[/C][/ROW]
[ROW][C]54[/C][C]0.439032896735927[/C][C]0.878065793471853[/C][C]0.560967103264073[/C][/ROW]
[ROW][C]55[/C][C]0.361547578893109[/C][C]0.723095157786217[/C][C]0.638452421106891[/C][/ROW]
[ROW][C]56[/C][C]0.489716281376108[/C][C]0.979432562752215[/C][C]0.510283718623892[/C][/ROW]
[ROW][C]57[/C][C]0.448329287925777[/C][C]0.896658575851554[/C][C]0.551670712074223[/C][/ROW]
[ROW][C]58[/C][C]0.40479785804574[/C][C]0.80959571609148[/C][C]0.59520214195426[/C][/ROW]
[ROW][C]59[/C][C]0.325641595163702[/C][C]0.651283190327405[/C][C]0.674358404836298[/C][/ROW]
[ROW][C]60[/C][C]0.372579555970132[/C][C]0.745159111940263[/C][C]0.627420444029868[/C][/ROW]
[/TABLE]
Source: https://freestatistics.org/blog/index.php?pk=102338&T=5

Globally Unique Identifier (entire table): ba.freestatistics.org/blog/index.php?pk=102338&T=5

As an alternative you can also use a QR Code:  

The GUIDs for individual cells are displayed in the table below:

Goldfeld-Quandt test for Heteroskedasticity
p-valuesAlternative Hypothesis
breakpoint indexgreater2-sidedless
150.0005841378025156230.001168275605031250.999415862197484
160.004891751415728910.009783502831457810.995108248584271
170.001375906255346370.002751812510692750.998624093744654
180.0003671795874007170.0007343591748014340.9996328204126
190.01311698207265950.02623396414531900.98688301792734
200.05194883351495690.1038976670299140.948051166485043
210.09373556923665410.1874711384733080.906264430763346
220.05651775683649290.1130355136729860.943482243163507
230.04309697873061070.08619395746122130.95690302126939
240.03063599467960600.06127198935921210.969364005320394
250.01863694937896790.03727389875793580.981363050621032
260.02389309340018130.04778618680036260.976106906599819
270.01603483759855190.03206967519710380.983965162401448
280.009066445482236890.01813289096447380.990933554517763
290.005914050755724460.01182810151144890.994085949244276
300.01516090999015360.03032181998030720.984839090009846
310.01000723753996950.02001447507993910.98999276246003
320.01870765738680350.03741531477360690.981292342613197
330.01745088264312460.03490176528624910.982549117356875
340.01120684016825870.02241368033651740.988793159831741
350.02350501740533890.04701003481067790.97649498259466
360.02827127603858380.05654255207716760.971728723961416
370.0395815469910390.0791630939820780.96041845300896
380.05217894135503520.1043578827100700.947821058644965
390.05494628275000690.1098925655000140.945053717249993
400.03877985982308160.07755971964616320.961220140176918
410.03723310667049620.07446621334099250.962766893329504
420.0438800226041320.0877600452082640.956119977395868
430.04178685147540530.08357370295081060.958213148524595
440.1868823196869710.3737646393739430.813117680313029
450.2391066296596880.4782132593193760.760893370340312
460.1990238203755860.3980476407511720.800976179624414
470.2324067979180750.464813595836150.767593202081925
480.2929953964453300.5859907928906590.70700460355467
490.4917224980194620.9834449960389240.508277501980538
500.4745148401880570.9490296803761140.525485159811943
510.5378655666868060.9242688666263880.462134433313194
520.5188789329169110.9622421341661780.481121067083089
530.4435903865968540.8871807731937080.556409613403146
540.4390328967359270.8780657934718530.560967103264073
550.3615475788931090.7230951577862170.638452421106891
560.4897162813761080.9794325627522150.510283718623892
570.4483292879257770.8966585758515540.551670712074223
580.404797858045740.809595716091480.59520214195426
590.3256415951637020.6512831903274050.674358404836298
600.3725795559701320.7451591119402630.627420444029868


Meta Analysis of Goldfeld-Quandt test for Heteroskedasticity
Description# significant tests% significant testsOK/NOK
1% type I error level40.0869565217391304NOK
5% type I error level160.347826086956522NOK
10% type I error level240.521739130434783NOK

\begin{tabular}{lllllllll}
\hline
Meta Analysis of Goldfeld-Quandt test for Heteroskedasticity \tabularnewline
Description & # significant tests & % significant tests & OK/NOK \tabularnewline
1% type I error level & 4 & 0.0869565217391304 & NOK \tabularnewline
5% type I error level & 16 & 0.347826086956522 & NOK \tabularnewline
10% type I error level & 24 & 0.521739130434783 & NOK \tabularnewline
\hline
\end{tabular}
%Source: https://freestatistics.org/blog/index.php?pk=102338&T=6

[TABLE]
[ROW][C]Meta Analysis of Goldfeld-Quandt test for Heteroskedasticity[/C][/ROW]
[ROW][C]Description[/C][C]# significant tests[/C][C]% significant tests[/C][C]OK/NOK[/C][/ROW]
[ROW][C]1% type I error level[/C][C]4[/C][C]0.0869565217391304[/C][C]NOK[/C][/ROW]
[ROW][C]5% type I error level[/C][C]16[/C][C]0.347826086956522[/C][C]NOK[/C][/ROW]
[ROW][C]10% type I error level[/C][C]24[/C][C]0.521739130434783[/C][C]NOK[/C][/ROW]
[/TABLE]
Source: https://freestatistics.org/blog/index.php?pk=102338&T=6

Globally Unique Identifier (entire table): ba.freestatistics.org/blog/index.php?pk=102338&T=6

As an alternative you can also use a QR Code:  

The GUIDs for individual cells are displayed in the table below:

Meta Analysis of Goldfeld-Quandt test for Heteroskedasticity
Description# significant tests% significant testsOK/NOK
1% type I error level40.0869565217391304NOK
5% type I error level160.347826086956522NOK
10% type I error level240.521739130434783NOK


Parameters (Session):
par1 = 1 ; par2 = Do not include Seasonal Dummies ; par3 = No Linear Trend ;
Parameters (R input):
par1 = 1 ; par2 = Include Monthly Dummies ; par3 = No Linear Trend ;
R code (references can be found in the software module):
library(lattice)
library(lmtest)
n25 <- 25 #minimum number of obs. for Goldfeld-Quandt test
par1 <- as.numeric(par1)
x <- t(y)
k <- length(x[1,])
n <- length(x[,1])
x1 <- cbind(x[,par1], x[,1:k!=par1])
mycolnames <- c(colnames(x)[par1], colnames(x)[1:k!=par1])
colnames(x1) <- mycolnames #colnames(x)[par1]
x <- x1
if (par3 == 'First Differences'){
x2 <- array(0, dim=c(n-1,k), dimnames=list(1:(n-1), paste('(1-B)',colnames(x),sep='')))
for (i in 1:n-1) {
for (j in 1:k) {
x2[i,j] <- x[i+1,j] - x[i,j]
}
}
x <- x2
}
if (par2 == 'Include Monthly Dummies'){
x2 <- array(0, dim=c(n,11), dimnames=list(1:n, paste('M', seq(1:11), sep ='')))
for (i in 1:11){
x2[seq(i,n,12),i] <- 1
}
x <- cbind(x, x2)
}
if (par2 == 'Include Quarterly Dummies'){
x2 <- array(0, dim=c(n,3), dimnames=list(1:n, paste('Q', seq(1:3), sep ='')))
for (i in 1:3){
x2[seq(i,n,4),i] <- 1
}
x <- cbind(x, x2)
}
k <- length(x[1,])
if (par3 == 'Linear Trend'){
x <- cbind(x, c(1:n))
colnames(x)[k+1] <- 't'
}
x
k <- length(x[1,])
df <- as.data.frame(x)
(mylm <- lm(df))
(mysum <- summary(mylm))
if (n > n25) {
kp3 <- k + 3
nmkm3 <- n - k - 3
gqarr <- array(NA, dim=c(nmkm3-kp3+1,3))
numgqtests <- 0
numsignificant1 <- 0
numsignificant5 <- 0
numsignificant10 <- 0
for (mypoint in kp3:nmkm3) {
j <- 0
numgqtests <- numgqtests + 1
for (myalt in c('greater', 'two.sided', 'less')) {
j <- j + 1
gqarr[mypoint-kp3+1,j] <- gqtest(mylm, point=mypoint, alternative=myalt)$p.value
}
if (gqarr[mypoint-kp3+1,2] < 0.01) numsignificant1 <- numsignificant1 + 1
if (gqarr[mypoint-kp3+1,2] < 0.05) numsignificant5 <- numsignificant5 + 1
if (gqarr[mypoint-kp3+1,2] < 0.10) numsignificant10 <- numsignificant10 + 1
}
gqarr
}
bitmap(file='test0.png')
plot(x[,1], type='l', main='Actuals and Interpolation', ylab='value of Actuals and Interpolation (dots)', xlab='time or index')
points(x[,1]-mysum$resid)
grid()
dev.off()
bitmap(file='test1.png')
plot(mysum$resid, type='b', pch=19, main='Residuals', ylab='value of Residuals', xlab='time or index')
grid()
dev.off()
bitmap(file='test2.png')
hist(mysum$resid, main='Residual Histogram', xlab='values of Residuals')
grid()
dev.off()
bitmap(file='test3.png')
densityplot(~mysum$resid,col='black',main='Residual Density Plot', xlab='values of Residuals')
dev.off()
bitmap(file='test4.png')
qqnorm(mysum$resid, main='Residual Normal Q-Q Plot')
qqline(mysum$resid)
grid()
dev.off()
(myerror <- as.ts(mysum$resid))
bitmap(file='test5.png')
dum <- cbind(lag(myerror,k=1),myerror)
dum
dum1 <- dum[2:length(myerror),]
dum1
z <- as.data.frame(dum1)
z
plot(z,main=paste('Residual Lag plot, lowess, and regression line'), ylab='values of Residuals', xlab='lagged values of Residuals')
lines(lowess(z))
abline(lm(z))
grid()
dev.off()
bitmap(file='test6.png')
acf(mysum$resid, lag.max=length(mysum$resid)/2, main='Residual Autocorrelation Function')
grid()
dev.off()
bitmap(file='test7.png')
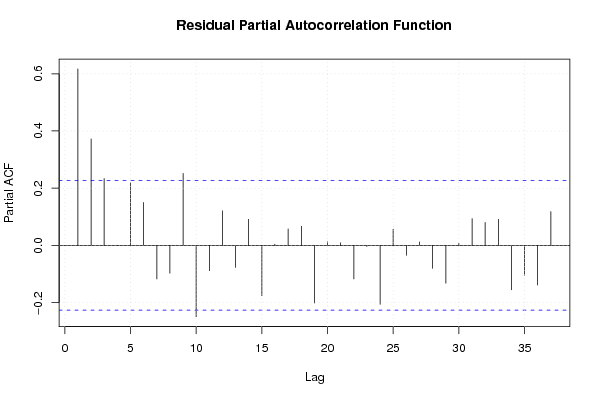
pacf(mysum$resid, lag.max=length(mysum$resid)/2, main='Residual Partial Autocorrelation Function')
grid()
dev.off()
bitmap(file='test8.png')
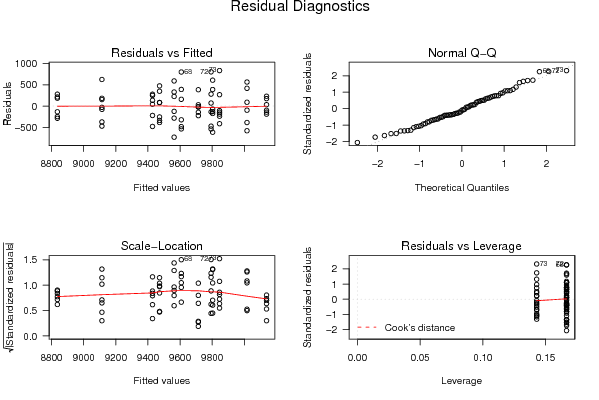
opar <- par(mfrow = c(2,2), oma = c(0, 0, 1.1, 0))
plot(mylm, las = 1, sub='Residual Diagnostics')
par(opar)
dev.off()
if (n > n25) {
bitmap(file='test9.png')
plot(kp3:nmkm3,gqarr[,2], main='Goldfeld-Quandt test',ylab='2-sided p-value',xlab='breakpoint')
grid()
dev.off()
}
load(file='createtable')
a<-table.start()
a<-table.row.start(a)
a<-table.element(a, 'Multiple Linear Regression - Estimated Regression Equation', 1, TRUE)
a<-table.row.end(a)
myeq <- colnames(x)[1]
myeq <- paste(myeq, '[t] = ', sep='')
for (i in 1:k){
if (mysum$coefficients[i,1] > 0) myeq <- paste(myeq, '+', '')
myeq <- paste(myeq, mysum$coefficients[i,1], sep=' ')
if (rownames(mysum$coefficients)[i] != '(Intercept)') {
myeq <- paste(myeq, rownames(mysum$coefficients)[i], sep='')
if (rownames(mysum$coefficients)[i] != 't') myeq <- paste(myeq, '[t]', sep='')
}
}
myeq <- paste(myeq, ' + e[t]')
a<-table.row.start(a)
a<-table.element(a, myeq)
a<-table.row.end(a)
a<-table.end(a)
table.save(a,file='mytable1.tab')
a<-table.start()
a<-table.row.start(a)
a<-table.element(a,hyperlink('ols1.htm','Multiple Linear Regression - Ordinary Least Squares',''), 6, TRUE)
a<-table.row.end(a)
a<-table.row.start(a)
a<-table.element(a,'Variable',header=TRUE)
a<-table.element(a,'Parameter',header=TRUE)
a<-table.element(a,'S.D.',header=TRUE)
a<-table.element(a,'T-STAT
H0: parameter = 0',header=TRUE)
a<-table.element(a,'2-tail p-value',header=TRUE)
a<-table.element(a,'1-tail p-value',header=TRUE)
a<-table.row.end(a)
for (i in 1:k){
a<-table.row.start(a)
a<-table.element(a,rownames(mysum$coefficients)[i],header=TRUE)
a<-table.element(a,mysum$coefficients[i,1])
a<-table.element(a, round(mysum$coefficients[i,2],6))
a<-table.element(a, round(mysum$coefficients[i,3],4))
a<-table.element(a, round(mysum$coefficients[i,4],6))
a<-table.element(a, round(mysum$coefficients[i,4]/2,6))
a<-table.row.end(a)
}
a<-table.end(a)
table.save(a,file='mytable2.tab')
a<-table.start()
a<-table.row.start(a)
a<-table.element(a, 'Multiple Linear Regression - Regression Statistics', 2, TRUE)
a<-table.row.end(a)
a<-table.row.start(a)
a<-table.element(a, 'Multiple R',1,TRUE)
a<-table.element(a, sqrt(mysum$r.squared))
a<-table.row.end(a)
a<-table.row.start(a)
a<-table.element(a, 'R-squared',1,TRUE)
a<-table.element(a, mysum$r.squared)
a<-table.row.end(a)
a<-table.row.start(a)
a<-table.element(a, 'Adjusted R-squared',1,TRUE)
a<-table.element(a, mysum$adj.r.squared)
a<-table.row.end(a)
a<-table.row.start(a)
a<-table.element(a, 'F-TEST (value)',1,TRUE)
a<-table.element(a, mysum$fstatistic[1])
a<-table.row.end(a)
a<-table.row.start(a)
a<-table.element(a, 'F-TEST (DF numerator)',1,TRUE)
a<-table.element(a, mysum$fstatistic[2])
a<-table.row.end(a)
a<-table.row.start(a)
a<-table.element(a, 'F-TEST (DF denominator)',1,TRUE)
a<-table.element(a, mysum$fstatistic[3])
a<-table.row.end(a)
a<-table.row.start(a)
a<-table.element(a, 'p-value',1,TRUE)
a<-table.element(a, 1-pf(mysum$fstatistic[1],mysum$fstatistic[2],mysum$fstatistic[3]))
a<-table.row.end(a)
a<-table.row.start(a)
a<-table.element(a, 'Multiple Linear Regression - Residual Statistics', 2, TRUE)
a<-table.row.end(a)
a<-table.row.start(a)
a<-table.element(a, 'Residual Standard Deviation',1,TRUE)
a<-table.element(a, mysum$sigma)
a<-table.row.end(a)
a<-table.row.start(a)
a<-table.element(a, 'Sum Squared Residuals',1,TRUE)
a<-table.element(a, sum(myerror*myerror))
a<-table.row.end(a)
a<-table.end(a)
table.save(a,file='mytable3.tab')
a<-table.start()
a<-table.row.start(a)
a<-table.element(a, 'Multiple Linear Regression - Actuals, Interpolation, and Residuals', 4, TRUE)
a<-table.row.end(a)
a<-table.row.start(a)
a<-table.element(a, 'Time or Index', 1, TRUE)
a<-table.element(a, 'Actuals', 1, TRUE)
a<-table.element(a, 'Interpolation
Forecast', 1, TRUE)
a<-table.element(a, 'Residuals
Prediction Error', 1, TRUE)
a<-table.row.end(a)
for (i in 1:n) {
a<-table.row.start(a)
a<-table.element(a,i, 1, TRUE)
a<-table.element(a,x[i])
a<-table.element(a,x[i]-mysum$resid[i])
a<-table.element(a,mysum$resid[i])
a<-table.row.end(a)
}
a<-table.end(a)
table.save(a,file='mytable4.tab')
if (n > n25) {
a<-table.start()
a<-table.row.start(a)
a<-table.element(a,'Goldfeld-Quandt test for Heteroskedasticity',4,TRUE)
a<-table.row.end(a)
a<-table.row.start(a)
a<-table.element(a,'p-values',header=TRUE)
a<-table.element(a,'Alternative Hypothesis',3,header=TRUE)
a<-table.row.end(a)
a<-table.row.start(a)
a<-table.element(a,'breakpoint index',header=TRUE)
a<-table.element(a,'greater',header=TRUE)
a<-table.element(a,'2-sided',header=TRUE)
a<-table.element(a,'less',header=TRUE)
a<-table.row.end(a)
for (mypoint in kp3:nmkm3) {
a<-table.row.start(a)
a<-table.element(a,mypoint,header=TRUE)
a<-table.element(a,gqarr[mypoint-kp3+1,1])
a<-table.element(a,gqarr[mypoint-kp3+1,2])
a<-table.element(a,gqarr[mypoint-kp3+1,3])
a<-table.row.end(a)
}
a<-table.end(a)
table.save(a,file='mytable5.tab')
a<-table.start()
a<-table.row.start(a)
a<-table.element(a,'Meta Analysis of Goldfeld-Quandt test for Heteroskedasticity',4,TRUE)
a<-table.row.end(a)
a<-table.row.start(a)
a<-table.element(a,'Description',header=TRUE)
a<-table.element(a,'# significant tests',header=TRUE)
a<-table.element(a,'% significant tests',header=TRUE)
a<-table.element(a,'OK/NOK',header=TRUE)
a<-table.row.end(a)
a<-table.row.start(a)
a<-table.element(a,'1% type I error level',header=TRUE)
a<-table.element(a,numsignificant1)
a<-table.element(a,numsignificant1/numgqtests)
if (numsignificant1/numgqtests < 0.01) dum <- 'OK' else dum <- 'NOK'
a<-table.element(a,dum)
a<-table.row.end(a)
a<-table.row.start(a)
a<-table.element(a,'5% type I error level',header=TRUE)
a<-table.element(a,numsignificant5)
a<-table.element(a,numsignificant5/numgqtests)
if (numsignificant5/numgqtests < 0.05) dum <- 'OK' else dum <- 'NOK'
a<-table.element(a,dum)
a<-table.row.end(a)
a<-table.row.start(a)
a<-table.element(a,'10% type I error level',header=TRUE)
a<-table.element(a,numsignificant10)
a<-table.element(a,numsignificant10/numgqtests)
if (numsignificant10/numgqtests < 0.1) dum <- 'OK' else dum <- 'NOK'
a<-table.element(a,dum)
a<-table.row.end(a)
a<-table.end(a)
table.save(a,file='mytable6.tab')
}