Free Statistics

of Irreproducible Research!

Author's title

Author*The author of this computation has been verified*
R Software Modulerwasp_histogram.wasp
Title produced by softwareHistogram
Date of computationThu, 25 Nov 2010 16:57:52 +0000
Cite this page as followsStatistical Computations at FreeStatistics.org, Office for Research Development and Education, URL https://freestatistics.org/blog/index.php?v=date/2010/Nov/25/t1290704178atxyj92fttnotml.htm/, Retrieved Fri, 19 Apr 2024 20:16:26 +0000
Statistical Computations at FreeStatistics.org, Office for Research Development and Education, URL https://freestatistics.org/blog/index.php?pk=101237, Retrieved Fri, 19 Apr 2024 20:16:26 +0000
QR Codes:

Original text written by user:
IsPrivate?No (this computation is public)
User-defined keywords
Estimated Impact136
Family? (F = Feedback message, R = changed R code, M = changed R Module, P = changed Parameters, D = changed Data)
-     [Histogram] [] [2010-11-25 09:14:45] [e71d94d32f847f62b540eebe6fadd003]
-    D    [Histogram] [] [2010-11-25 16:57:52] [288f03f47c5783dcaccb816dacc66894] [Current]
Feedback Forum

Post a new message
Dataseries X:
58.951
59.634
58.389
57.702
56.593
55.998
57.363
58.022
57.598
57.842
58.875
59.103
58.484
58.636
61.342
63.470
64.281
63.721
62.657
62.549
61.882
62.325
61.907
63.136
63.982
65.800
67.596
68.654
67.548
67.398
66.999
66.284
65.561
67.694
69.976
72.908
75.128
75.522
75.242
75.179
75.572
78.340
80.107
82.972
81.638
80.018
80.631
79.211
79.999
77.789
76.205
75.352
74.393
72.771
70.682
69.991
67.525
67.779
66.864
67.971
67.071
66.980
57.144
56.648
53.706
47.108
43.292
48.489
52.642
53.249
50.722
49.805
49.303
49.985
49.512
51.282
50.734
50.365
46.191
44.617
42.012
41.027
39.478
36.824
34.761
31.295
28.951
25.872
17.297
10.739
9.087
8.658
8.731
8.358
6.518
5.021
3.440
2.523
1.725
1.210
777
498
312
179
92
106


Summary of computational transaction
Raw Inputview raw input (R code)
Raw Outputview raw output of R engine
Computing time1 seconds
R Server'Sir Ronald Aylmer Fisher' @ 193.190.124.24

\begin{tabular}{lllllllll}
\hline
Summary of computational transaction \tabularnewline
Raw Input & view raw input (R code)  \tabularnewline
Raw Output & view raw output of R engine  \tabularnewline
Computing time & 1 seconds \tabularnewline
R Server & 'Sir Ronald Aylmer Fisher' @ 193.190.124.24 \tabularnewline
\hline
\end{tabular}
%Source: https://freestatistics.org/blog/index.php?pk=101237&T=0

[TABLE]
[ROW][C]Summary of computational transaction[/C][/ROW]
[ROW][C]Raw Input[/C][C]view raw input (R code) [/C][/ROW]
[ROW][C]Raw Output[/C][C]view raw output of R engine [/C][/ROW]
[ROW][C]Computing time[/C][C]1 seconds[/C][/ROW]
[ROW][C]R Server[/C][C]'Sir Ronald Aylmer Fisher' @ 193.190.124.24[/C][/ROW]
[/TABLE]
Source: https://freestatistics.org/blog/index.php?pk=101237&T=0

Globally Unique Identifier (entire table): ba.freestatistics.org/blog/index.php?pk=101237&T=0

As an alternative you can also use a QR Code:  

The GUIDs for individual cells are displayed in the table below:

Summary of computational transaction
Raw Inputview raw input (R code)
Raw Outputview raw output of R engine
Computing time1 seconds
R Server'Sir Ronald Aylmer Fisher' @ 193.190.124.24


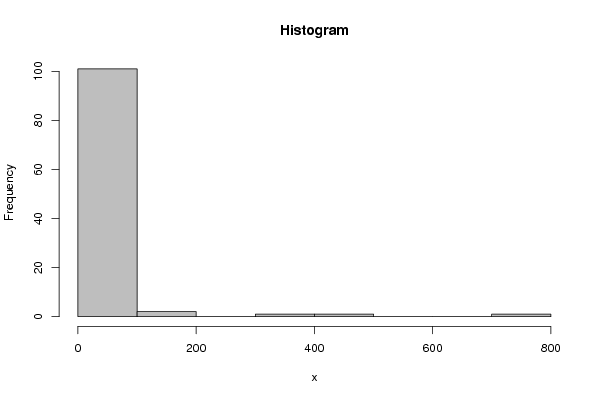
Frequency Table (Histogram)
BinsMidpointAbs. FrequencyRel. FrequencyCumul. Rel. Freq.Density
[0,100[501010.952830.952830.009528
[100,200[15020.0188680.9716980.000189
[200,300[250000.9716980
[300,400[35010.0094340.9811329.4e-05
[400,500[45010.0094340.9905669.4e-05
[500,600[550000.9905660
[600,700[650000.9905660
[700,800]75010.00943419.4e-05

\begin{tabular}{lllllllll}
\hline
Frequency Table (Histogram) \tabularnewline
Bins & Midpoint & Abs. Frequency & Rel. Frequency & Cumul. Rel. Freq. & Density \tabularnewline
[0,100[ & 50 & 101 & 0.95283 & 0.95283 & 0.009528 \tabularnewline
[100,200[ & 150 & 2 & 0.018868 & 0.971698 & 0.000189 \tabularnewline
[200,300[ & 250 & 0 & 0 & 0.971698 & 0 \tabularnewline
[300,400[ & 350 & 1 & 0.009434 & 0.981132 & 9.4e-05 \tabularnewline
[400,500[ & 450 & 1 & 0.009434 & 0.990566 & 9.4e-05 \tabularnewline
[500,600[ & 550 & 0 & 0 & 0.990566 & 0 \tabularnewline
[600,700[ & 650 & 0 & 0 & 0.990566 & 0 \tabularnewline
[700,800] & 750 & 1 & 0.009434 & 1 & 9.4e-05 \tabularnewline
\hline
\end{tabular}
%Source: https://freestatistics.org/blog/index.php?pk=101237&T=1

[TABLE]
[ROW][C]Frequency Table (Histogram)[/C][/ROW]
[ROW][C]Bins[/C][C]Midpoint[/C][C]Abs. Frequency[/C][C]Rel. Frequency[/C][C]Cumul. Rel. Freq.[/C][C]Density[/C][/ROW]
[ROW][C][0,100[[/C][C]50[/C][C]101[/C][C]0.95283[/C][C]0.95283[/C][C]0.009528[/C][/ROW]
[ROW][C][100,200[[/C][C]150[/C][C]2[/C][C]0.018868[/C][C]0.971698[/C][C]0.000189[/C][/ROW]
[ROW][C][200,300[[/C][C]250[/C][C]0[/C][C]0[/C][C]0.971698[/C][C]0[/C][/ROW]
[ROW][C][300,400[[/C][C]350[/C][C]1[/C][C]0.009434[/C][C]0.981132[/C][C]9.4e-05[/C][/ROW]
[ROW][C][400,500[[/C][C]450[/C][C]1[/C][C]0.009434[/C][C]0.990566[/C][C]9.4e-05[/C][/ROW]
[ROW][C][500,600[[/C][C]550[/C][C]0[/C][C]0[/C][C]0.990566[/C][C]0[/C][/ROW]
[ROW][C][600,700[[/C][C]650[/C][C]0[/C][C]0[/C][C]0.990566[/C][C]0[/C][/ROW]
[ROW][C][700,800][/C][C]750[/C][C]1[/C][C]0.009434[/C][C]1[/C][C]9.4e-05[/C][/ROW]
[/TABLE]
Source: https://freestatistics.org/blog/index.php?pk=101237&T=1

Globally Unique Identifier (entire table): ba.freestatistics.org/blog/index.php?pk=101237&T=1

As an alternative you can also use a QR Code:  

The GUIDs for individual cells are displayed in the table below:

Frequency Table (Histogram)
BinsMidpointAbs. FrequencyRel. FrequencyCumul. Rel. Freq.Density
[0,100[501010.952830.952830.009528
[100,200[15020.0188680.9716980.000189
[200,300[250000.9716980
[300,400[35010.0094340.9811329.4e-05
[400,500[45010.0094340.9905669.4e-05
[500,600[550000.9905660
[600,700[650000.9905660
[700,800]75010.00943419.4e-05


Parameters (Session):
par2 = grey ; par3 = FALSE ; par4 = Unknown ;
Parameters (R input):
par1 = ; par2 = grey ; par3 = FALSE ; par4 = Unknown ;
R code (references can be found in the software module):
par1 <- as.numeric(par1)
if (par3 == 'TRUE') par3 <- TRUE
if (par3 == 'FALSE') par3 <- FALSE
if (par4 == 'Unknown') par1 <- as.numeric(par1)
if (par4 == 'Interval/Ratio') par1 <- as.numeric(par1)
if (par4 == '3-point Likert') par1 <- c(1:3 - 0.5, 3.5)
if (par4 == '4-point Likert') par1 <- c(1:4 - 0.5, 4.5)
if (par4 == '5-point Likert') par1 <- c(1:5 - 0.5, 5.5)
if (par4 == '6-point Likert') par1 <- c(1:6 - 0.5, 6.5)
if (par4 == '7-point Likert') par1 <- c(1:7 - 0.5, 7.5)
if (par4 == '8-point Likert') par1 <- c(1:8 - 0.5, 8.5)
if (par4 == '9-point Likert') par1 <- c(1:9 - 0.5, 9.5)
if (par4 == '10-point Likert') par1 <- c(1:10 - 0.5, 10.5)
bitmap(file='test1.png')
if(is.numeric(x[1])) {
if (is.na(par1)) {
myhist<-hist(x,col=par2,main=main,xlab=xlab,right=par3)
} else {
if (par1 < 0) par1 <- 3
if (par1 > 50) par1 <- 50
myhist<-hist(x,breaks=par1,col=par2,main=main,xlab=xlab,right=par3)
}
} else {
plot(mytab <- table(x),col=par2,main='Frequency Plot',xlab=xlab,ylab='Absolute Frequency')
}
dev.off()
if(is.numeric(x[1])) {
myhist
n <- length(x)
load(file='createtable')
a<-table.start()
a<-table.row.start(a)
a<-table.element(a,hyperlink('histogram.htm','Frequency Table (Histogram)',''),6,TRUE)
a<-table.row.end(a)
a<-table.row.start(a)
a<-table.element(a,'Bins',header=TRUE)
a<-table.element(a,'Midpoint',header=TRUE)
a<-table.element(a,'Abs. Frequency',header=TRUE)
a<-table.element(a,'Rel. Frequency',header=TRUE)
a<-table.element(a,'Cumul. Rel. Freq.',header=TRUE)
a<-table.element(a,'Density',header=TRUE)
a<-table.row.end(a)
crf <- 0
if (par3 == FALSE) mybracket <- '[' else mybracket <- ']'
mynumrows <- (length(myhist$breaks)-1)
for (i in 1:mynumrows) {
a<-table.row.start(a)
if (i == 1)
dum <- paste('[',myhist$breaks[i],sep='')
else
dum <- paste(mybracket,myhist$breaks[i],sep='')
dum <- paste(dum,myhist$breaks[i+1],sep=',')
if (i==mynumrows)
dum <- paste(dum,']',sep='')
else
dum <- paste(dum,mybracket,sep='')
a<-table.element(a,dum,header=TRUE)
a<-table.element(a,myhist$mids[i])
a<-table.element(a,myhist$counts[i])
rf <- myhist$counts[i]/n
crf <- crf + rf
a<-table.element(a,round(rf,6))
a<-table.element(a,round(crf,6))
a<-table.element(a,round(myhist$density[i],6))
a<-table.row.end(a)
}
a<-table.end(a)
table.save(a,file='mytable.tab')
} else {
mytab
reltab <- mytab / sum(mytab)
n <- length(mytab)
load(file='createtable')
a<-table.start()
a<-table.row.start(a)
a<-table.element(a,'Frequency Table (Categorical Data)',3,TRUE)
a<-table.row.end(a)
a<-table.row.start(a)
a<-table.element(a,'Category',header=TRUE)
a<-table.element(a,'Abs. Frequency',header=TRUE)
a<-table.element(a,'Rel. Frequency',header=TRUE)
a<-table.row.end(a)
for (i in 1:n) {
a<-table.row.start(a)
a<-table.element(a,labels(mytab)$x[i],header=TRUE)
a<-table.element(a,mytab[i])
a<-table.element(a,round(reltab[i],4))
a<-table.row.end(a)
}
a<-table.end(a)
table.save(a,file='mytable1.tab')
}