| Multiple Linear Regression - Estimated Regression Equation |
| uitvoer[t] = + 2114.23967542119 + 0.876300281407902invoer[t] -674.860763094272crisis[t] + 5.89353497229609e-05invoerXcrisis[t] + e[t] |
| Multiple Linear Regression - Ordinary Least Squares | |||||
| Variable | Parameter | S.D. | T-STAT H0: parameter = 0 | 2-tail p-value | 1-tail p-value |
| (Intercept) | 2114.23967542119 | 1216.861087 | 1.7375 | 0.088343 | 0.044172 |
| invoer | 0.876300281407902 | 0.066888 | 13.101 | 0 | 0 |
| crisis | -674.860763094272 | 2086.161701 | -0.3235 | 0.747644 | 0.373822 |
| invoerXcrisis | 5.89353497229609e-05 | 0.126285 | 5e-04 | 0.999629 | 0.499815 |
| Multiple Linear Regression - Regression Statistics | |
| Multiple R | 0.943748600071709 |
| R-squared | 0.89066142013731 |
| Adjusted R-squared | 0.884229738968916 |
| F-TEST (value) | 138.480343912908 |
| F-TEST (DF numerator) | 3 |
| F-TEST (DF denominator) | 51 |
| p-value | 0 |
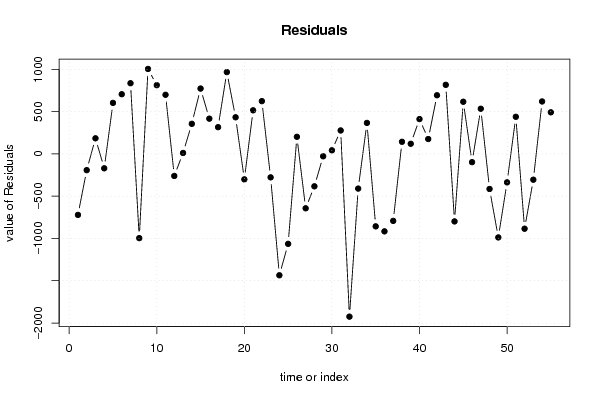
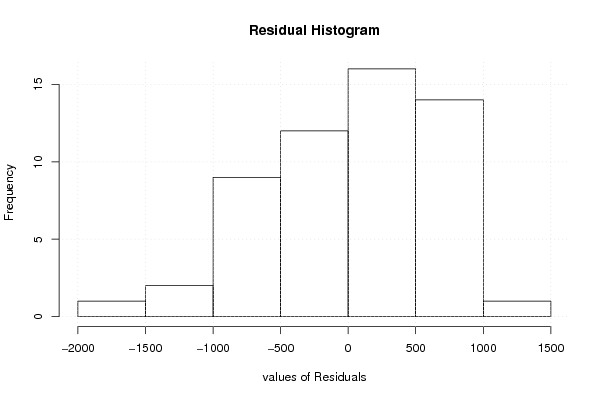
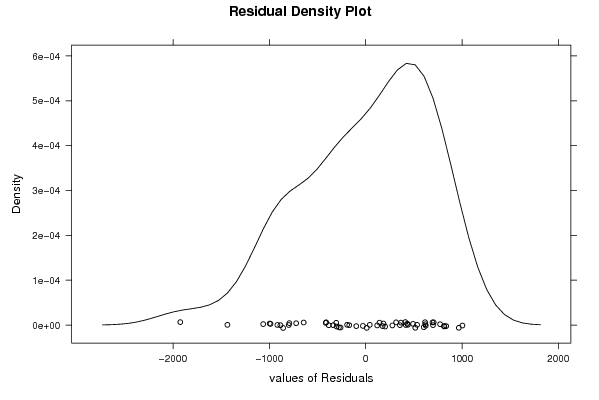
| Multiple Linear Regression - Residual Statistics | |
| Residual Standard Deviation | 686.987281817376 |
| Sum Squared Residuals | 24069527.7943201 |
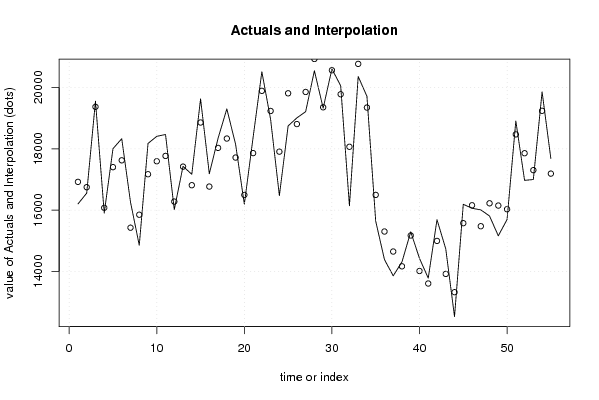
| Multiple Linear Regression - Actuals, Interpolation, and Residuals | |||
| Time or Index | Actuals | Interpolation Forecast | Residuals Prediction Error |
| 1 | 16198.9 | 16920.3844901454 | -721.48449014536 |
| 2 | 16554.2 | 16746.7017743703 | -192.501774370325 |
| 3 | 19554.2 | 19369.994296793 | 184.205703206981 |
| 4 | 15903.8 | 16074.3165684460 | -170.516568446044 |
| 5 | 18003.8 | 17400.9475644695 | 602.852435530535 |
| 6 | 18329.6 | 17624.2288761722 | 705.371123827798 |
| 7 | 16260.7 | 15425.0656899509 | 835.634310049072 |
| 8 | 14851.9 | 15848.2310958428 | -996.331095842806 |
| 9 | 18174.1 | 17169.7795502341 | 1004.32044976594 |
| 10 | 18406.6 | 17593.9965164636 | 812.603483536371 |
| 11 | 18466.5 | 17767.5039721824 | 698.996027817608 |
| 12 | 16016.5 | 16277.2677136201 | -260.767713620112 |
| 13 | 17428.5 | 17417.5972698162 | 10.9027301837855 |
| 14 | 17167.2 | 16811.6356252227 | 355.56437477735 |
| 15 | 19630 | 18857.6215222538 | 772.378477746178 |
| 16 | 17183.6 | 16767.1195709271 | 416.480429072869 |
| 17 | 18344.7 | 18028.9919761545 | 315.708023845493 |
| 18 | 19301.4 | 18334.4702542533 | 966.929745746697 |
| 19 | 18147.5 | 17714.7506952416 | 432.749304758364 |
| 20 | 16192.9 | 16494.2396632967 | -301.339663296711 |
| 21 | 18374.4 | 17859.3402416739 | 515.059758326062 |
| 22 | 20515.2 | 19891.3929642307 | 623.807035769279 |
| 23 | 18957.2 | 19234.7811633718 | -277.58116337178 |
| 24 | 16471.5 | 17906.8357169262 | -1435.33571692625 |
| 25 | 18746.8 | 19810.5104482568 | -1063.71044825677 |
| 26 | 19009.5 | 18807.4095161291 | 202.090483870853 |
| 27 | 19211.2 | 19854.6759824397 | -643.475982439732 |
| 28 | 20547.7 | 20931.2985081775 | -383.598508177478 |
| 29 | 19325.8 | 19354.2208917277 | -28.4208917276783 |
| 30 | 20605.5 | 20563.1647599580 | 42.335240041979 |
| 31 | 20056.9 | 19780.0151984638 | 276.884801536223 |
| 32 | 16141.4 | 18066.0594780581 | -1924.65947805806 |
| 33 | 20359.8 | 20770.2345164547 | -410.434516454708 |
| 34 | 19711.6 | 19345.4133368837 | 366.186663116273 |
| 35 | 15638.6 | 16495.5807999096 | -856.980799909607 |
| 36 | 14384.5 | 15300.5773719389 | -916.077371938909 |
| 37 | 13855.6 | 14647.6897554545 | -792.089755454478 |
| 38 | 14308.3 | 14165.0787347861 | 143.221265213944 |
| 39 | 15290.6 | 15170.8762078588 | 119.723792141221 |
| 40 | 14423.8 | 14012.4169592269 | 411.383040773123 |
| 41 | 13779.7 | 13604.1212001395 | 175.578799860502 |
| 42 | 15686.3 | 14993.0629227787 | 693.237077221341 |
| 43 | 14733.8 | 13917.1567123653 | 816.643287634676 |
| 44 | 12522.5 | 13320.7942653618 | -798.29426536176 |
| 45 | 16189.4 | 15572.9498165072 | 616.450183492821 |
| 46 | 16059.1 | 16156.8679626328 | -97.7679626327849 |
| 47 | 16007.1 | 15473.3954094835 | 533.704590516488 |
| 48 | 15806.8 | 16221.7185446728 | -414.91854467285 |
| 49 | 15160 | 16147.8381620562 | -987.838162056166 |
| 50 | 15692.1 | 16028.6613237847 | -336.561323784691 |
| 51 | 18908.9 | 18470.2967978715 | 438.603202128472 |
| 52 | 16969.9 | 17854.7834802106 | -884.883480210616 |
| 53 | 16997.5 | 17302.8895629799 | -305.389562979922 |
| 54 | 19858.9 | 19238.9874047225 | 619.912595277463 |
| 55 | 17681.2 | 17189.7591966502 | 491.440803349841 |
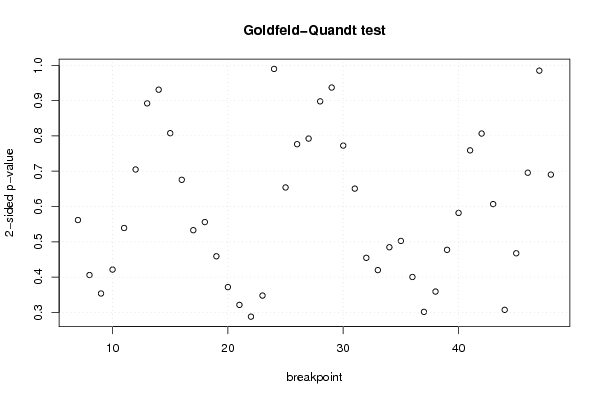
| Goldfeld-Quandt test for Heteroskedasticity | |||
| p-values | Alternative Hypothesis | ||
| breakpoint index | greater | 2-sided | less |
| 7 | 0.719152152389884 | 0.561695695220232 | 0.280847847610116 |
| 8 | 0.797064041291364 | 0.405871917417272 | 0.202935958708636 |
| 9 | 0.823184531640502 | 0.353630936718996 | 0.176815468359498 |
| 10 | 0.789348897745006 | 0.421302204509988 | 0.210651102254994 |
| 11 | 0.730445105870134 | 0.539109788259731 | 0.269554894129865 |
| 12 | 0.647558646709221 | 0.704882706581558 | 0.352441353290779 |
| 13 | 0.553893470507653 | 0.892213058984695 | 0.446106529492347 |
| 14 | 0.465460482157156 | 0.930920964314311 | 0.534539517842844 |
| 15 | 0.403853118189793 | 0.807706236379586 | 0.596146881810207 |
| 16 | 0.337810908500610 | 0.675621817001221 | 0.66218909149939 |
| 17 | 0.266452379068343 | 0.532904758136687 | 0.733547620931656 |
| 18 | 0.277963648792925 | 0.555927297585851 | 0.722036351207075 |
| 19 | 0.229515824216388 | 0.459031648432776 | 0.770484175783612 |
| 20 | 0.185850007983003 | 0.371700015966006 | 0.814149992016997 |
| 21 | 0.160656462056801 | 0.321312924113602 | 0.839343537943199 |
| 22 | 0.144000269074472 | 0.288000538148944 | 0.855999730925528 |
| 23 | 0.173862325511807 | 0.347724651023614 | 0.826137674488193 |
| 24 | 0.505168778199442 | 0.989662443601116 | 0.494831221800558 |
| 25 | 0.67302253888956 | 0.653954922220879 | 0.326977461110440 |
| 26 | 0.611732677441224 | 0.776534645117552 | 0.388267322558776 |
| 27 | 0.603802046457534 | 0.792395907084932 | 0.396197953542466 |
| 28 | 0.551062807633029 | 0.897874384733942 | 0.448937192366971 |
| 29 | 0.468511415693534 | 0.937022831387068 | 0.531488584306466 |
| 30 | 0.386295232123468 | 0.772590464246936 | 0.613704767876532 |
| 31 | 0.325336162491117 | 0.650672324982234 | 0.674663837508883 |
| 32 | 0.772703043231794 | 0.454593913536412 | 0.227296956768206 |
| 33 | 0.790057317935213 | 0.419885364129573 | 0.209942682064787 |
| 34 | 0.757699235736977 | 0.484601528526046 | 0.242300764263023 |
| 35 | 0.748754480283738 | 0.502491039432523 | 0.251245519716262 |
| 36 | 0.799845563575853 | 0.400308872848295 | 0.200154436424147 |
| 37 | 0.849242982906036 | 0.301514034187927 | 0.150757017093964 |
| 38 | 0.820443700532786 | 0.359112598934427 | 0.179556299467214 |
| 39 | 0.761368051106152 | 0.477263897787697 | 0.238631948893848 |
| 40 | 0.709095532309888 | 0.581808935380224 | 0.290904467690112 |
| 41 | 0.620482845698563 | 0.759034308602874 | 0.379517154301437 |
| 42 | 0.596641732853054 | 0.806716534293893 | 0.403358267146946 |
| 43 | 0.696609435644852 | 0.606781128710295 | 0.303390564355148 |
| 44 | 0.846375322976956 | 0.307249354046089 | 0.153624677023044 |
| 45 | 0.766241482353578 | 0.467517035292843 | 0.233758517646422 |
| 46 | 0.652135129740728 | 0.695729740518545 | 0.347864870259272 |
| 47 | 0.507586464077593 | 0.984827071844813 | 0.492413535922406 |
| 48 | 0.345192898771131 | 0.690385797542262 | 0.654807101228869 |
| Meta Analysis of Goldfeld-Quandt test for Heteroskedasticity | |||
| Description | # significant tests | % significant tests | OK/NOK |
| 1% type I error level | 0 | 0 | OK |
| 5% type I error level | 0 | 0 | OK |
| 10% type I error level | 0 | 0 | OK |