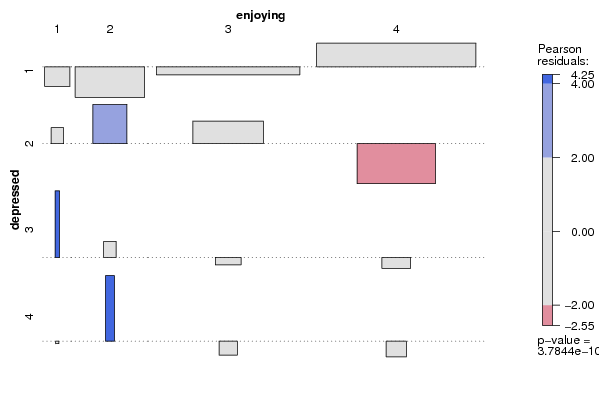
| Tabulation of Results | ||||
| depressed x enjoying | ||||
| 1 | 2 | 3 | 4 | 1 | 0 | 5 | 46 | 73 | 2 | 1 | 7 | 17 | 5 | 3 | 1 | 1 | 1 | 1 | 4 | 0 | 2 | 0 | 0 |
| Tabulation of Expected Results | ||||
| depressed x enjoying | ||||
| 1 | 2 | 3 | 4 | 1 | 1.55 | 11.62 | 49.6 | 61.23 | 2 | 0.38 | 2.81 | 12 | 14.81 | 3 | 0.05 | 0.38 | 1.6 | 1.98 | 4 | 0.02 | 0.19 | 0.8 | 0.99 |
| Statistical Results | |
| Pearson's Chi-squared test with simulated p-value (based on 2000 replicates) | |
| Chi Square Statistic | 62.84 |
| P value | 0 |