Free Statistics

of Irreproducible Research!

Author's title

Author*Unverified author*
R Software Modulerwasp_autocorrelation.wasp
Title produced by software(Partial) Autocorrelation Function
Date of computationTue, 23 Nov 2010 22:14:44 +0000
Cite this page as followsStatistical Computations at FreeStatistics.org, Office for Research Development and Education, URL https://freestatistics.org/blog/index.php?v=date/2010/Nov/23/t1290550622yfa9xw54y5ynqba.htm/, Retrieved Fri, 26 Apr 2024 21:32:25 +0000
Statistical Computations at FreeStatistics.org, Office for Research Development and Education, URL https://freestatistics.org/blog/index.php?pk=99684, Retrieved Fri, 26 Apr 2024 21:32:25 +0000
QR Codes:

Original text written by user:
IsPrivate?No (this computation is public)
User-defined keywordsKDGP2W12
Estimated Impact88
Family? (F = Feedback message, R = changed R code, M = changed R Module, P = changed Parameters, D = changed Data)
-       [(Partial) Autocorrelation Function] [De aantal werkloz...] [2010-11-23 22:14:44] [6b57770a9d87785617c80b642e34c9c4] [Current]
Feedback Forum

Post a new message
Dataseries X:
591000
589000
584000
573000
567000
569000
621000
629000
628000
612000
595000
597000
593000
590000
580000
574000
573000
573000
620000
626000
620000
588000
566000
557000
561000
549000
532000
526000
511000
499000
555000
565000
542000
527000
510000
514000
517000
508000
493000
490000
469000
478000
528000
534000
518000
506000
502000
516000
528000
533000
536000
537000
524000
536000
587000
597000
581000
564000
558000
575000


Summary of computational transaction
Raw Inputview raw input (R code)
Raw Outputview raw output of R engine
Computing time2 seconds
R Server'RServer@AstonUniversity' @ vre.aston.ac.uk

\begin{tabular}{lllllllll}
\hline
Summary of computational transaction \tabularnewline
Raw Input & view raw input (R code)  \tabularnewline
Raw Output & view raw output of R engine  \tabularnewline
Computing time & 2 seconds \tabularnewline
R Server & 'RServer@AstonUniversity' @ vre.aston.ac.uk \tabularnewline
\hline
\end{tabular}
%Source: https://freestatistics.org/blog/index.php?pk=99684&T=0

[TABLE]
[ROW][C]Summary of computational transaction[/C][/ROW]
[ROW][C]Raw Input[/C][C]view raw input (R code) [/C][/ROW]
[ROW][C]Raw Output[/C][C]view raw output of R engine [/C][/ROW]
[ROW][C]Computing time[/C][C]2 seconds[/C][/ROW]
[ROW][C]R Server[/C][C]'RServer@AstonUniversity' @ vre.aston.ac.uk[/C][/ROW]
[/TABLE]
Source: https://freestatistics.org/blog/index.php?pk=99684&T=0

Globally Unique Identifier (entire table): ba.freestatistics.org/blog/index.php?pk=99684&T=0

As an alternative you can also use a QR Code:  

The GUIDs for individual cells are displayed in the table below:

Summary of computational transaction
Raw Inputview raw input (R code)
Raw Outputview raw output of R engine
Computing time2 seconds
R Server'RServer@AstonUniversity' @ vre.aston.ac.uk


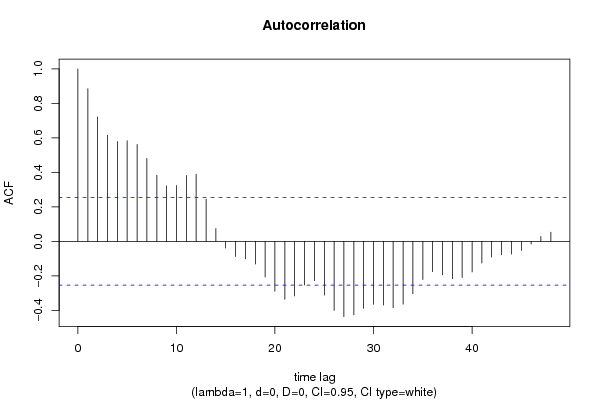
Autocorrelation Function
Time lag kACF(k)T-STATP-value
10.8851076.8560
20.7210885.58550
30.6153624.76666e-06
40.5798254.49131.6e-05
50.5838024.52211.5e-05
60.5624474.35672.6e-05
70.4812573.72780.000215
80.3836422.97170.002128
90.3218972.49340.007714
100.3245042.51360.007326
110.382182.96040.002198
120.3891773.01450.001884
130.2444471.89350.031559
140.0740660.57370.284153
15-0.038385-0.29730.383621
16-0.087858-0.68050.249388
17-0.100579-0.77910.219498
18-0.131567-1.01910.15612
19-0.206395-1.59870.057567
20-0.289253-2.24050.014385
21-0.335657-2.60.00586
22-0.316418-2.4510.008589
23-0.253653-1.96480.027037
24-0.228008-1.76610.04123
25-0.311492-2.41280.009451
26-0.400214-3.10.001473
27-0.436605-3.38190.000636
28-0.425598-3.29670.000823
29-0.388725-3.0110.001903
30-0.36431-2.82190.003232
31-0.369354-2.8610.002902
32-0.384411-2.97760.002093
33-0.364162-2.82080.003242
34-0.303585-2.35160.010998
35-0.221499-1.71570.045686
36-0.175614-1.36030.089412
37-0.193735-1.50070.069344
38-0.217446-1.68430.048657
39-0.209458-1.62250.054974
40-0.177079-1.37160.087641
41-0.125747-0.9740.166976
42-0.091359-0.70770.240947
43-0.077843-0.6030.2744
44-0.073311-0.56790.286122
45-0.053274-0.41270.340664
46-0.015862-0.12290.451311
470.0285770.22140.412784
480.0532090.41220.340848

\begin{tabular}{lllllllll}
\hline
Autocorrelation Function \tabularnewline
Time lag k & ACF(k) & T-STAT & P-value \tabularnewline
1 & 0.885107 & 6.856 & 0 \tabularnewline
2 & 0.721088 & 5.5855 & 0 \tabularnewline
3 & 0.615362 & 4.7666 & 6e-06 \tabularnewline
4 & 0.579825 & 4.4913 & 1.6e-05 \tabularnewline
5 & 0.583802 & 4.5221 & 1.5e-05 \tabularnewline
6 & 0.562447 & 4.3567 & 2.6e-05 \tabularnewline
7 & 0.481257 & 3.7278 & 0.000215 \tabularnewline
8 & 0.383642 & 2.9717 & 0.002128 \tabularnewline
9 & 0.321897 & 2.4934 & 0.007714 \tabularnewline
10 & 0.324504 & 2.5136 & 0.007326 \tabularnewline
11 & 0.38218 & 2.9604 & 0.002198 \tabularnewline
12 & 0.389177 & 3.0145 & 0.001884 \tabularnewline
13 & 0.244447 & 1.8935 & 0.031559 \tabularnewline
14 & 0.074066 & 0.5737 & 0.284153 \tabularnewline
15 & -0.038385 & -0.2973 & 0.383621 \tabularnewline
16 & -0.087858 & -0.6805 & 0.249388 \tabularnewline
17 & -0.100579 & -0.7791 & 0.219498 \tabularnewline
18 & -0.131567 & -1.0191 & 0.15612 \tabularnewline
19 & -0.206395 & -1.5987 & 0.057567 \tabularnewline
20 & -0.289253 & -2.2405 & 0.014385 \tabularnewline
21 & -0.335657 & -2.6 & 0.00586 \tabularnewline
22 & -0.316418 & -2.451 & 0.008589 \tabularnewline
23 & -0.253653 & -1.9648 & 0.027037 \tabularnewline
24 & -0.228008 & -1.7661 & 0.04123 \tabularnewline
25 & -0.311492 & -2.4128 & 0.009451 \tabularnewline
26 & -0.400214 & -3.1 & 0.001473 \tabularnewline
27 & -0.436605 & -3.3819 & 0.000636 \tabularnewline
28 & -0.425598 & -3.2967 & 0.000823 \tabularnewline
29 & -0.388725 & -3.011 & 0.001903 \tabularnewline
30 & -0.36431 & -2.8219 & 0.003232 \tabularnewline
31 & -0.369354 & -2.861 & 0.002902 \tabularnewline
32 & -0.384411 & -2.9776 & 0.002093 \tabularnewline
33 & -0.364162 & -2.8208 & 0.003242 \tabularnewline
34 & -0.303585 & -2.3516 & 0.010998 \tabularnewline
35 & -0.221499 & -1.7157 & 0.045686 \tabularnewline
36 & -0.175614 & -1.3603 & 0.089412 \tabularnewline
37 & -0.193735 & -1.5007 & 0.069344 \tabularnewline
38 & -0.217446 & -1.6843 & 0.048657 \tabularnewline
39 & -0.209458 & -1.6225 & 0.054974 \tabularnewline
40 & -0.177079 & -1.3716 & 0.087641 \tabularnewline
41 & -0.125747 & -0.974 & 0.166976 \tabularnewline
42 & -0.091359 & -0.7077 & 0.240947 \tabularnewline
43 & -0.077843 & -0.603 & 0.2744 \tabularnewline
44 & -0.073311 & -0.5679 & 0.286122 \tabularnewline
45 & -0.053274 & -0.4127 & 0.340664 \tabularnewline
46 & -0.015862 & -0.1229 & 0.451311 \tabularnewline
47 & 0.028577 & 0.2214 & 0.412784 \tabularnewline
48 & 0.053209 & 0.4122 & 0.340848 \tabularnewline
\hline
\end{tabular}
%Source: https://freestatistics.org/blog/index.php?pk=99684&T=1

[TABLE]
[ROW][C]Autocorrelation Function[/C][/ROW]
[ROW][C]Time lag k[/C][C]ACF(k)[/C][C]T-STAT[/C][C]P-value[/C][/ROW]
[ROW][C]1[/C][C]0.885107[/C][C]6.856[/C][C]0[/C][/ROW]
[ROW][C]2[/C][C]0.721088[/C][C]5.5855[/C][C]0[/C][/ROW]
[ROW][C]3[/C][C]0.615362[/C][C]4.7666[/C][C]6e-06[/C][/ROW]
[ROW][C]4[/C][C]0.579825[/C][C]4.4913[/C][C]1.6e-05[/C][/ROW]
[ROW][C]5[/C][C]0.583802[/C][C]4.5221[/C][C]1.5e-05[/C][/ROW]
[ROW][C]6[/C][C]0.562447[/C][C]4.3567[/C][C]2.6e-05[/C][/ROW]
[ROW][C]7[/C][C]0.481257[/C][C]3.7278[/C][C]0.000215[/C][/ROW]
[ROW][C]8[/C][C]0.383642[/C][C]2.9717[/C][C]0.002128[/C][/ROW]
[ROW][C]9[/C][C]0.321897[/C][C]2.4934[/C][C]0.007714[/C][/ROW]
[ROW][C]10[/C][C]0.324504[/C][C]2.5136[/C][C]0.007326[/C][/ROW]
[ROW][C]11[/C][C]0.38218[/C][C]2.9604[/C][C]0.002198[/C][/ROW]
[ROW][C]12[/C][C]0.389177[/C][C]3.0145[/C][C]0.001884[/C][/ROW]
[ROW][C]13[/C][C]0.244447[/C][C]1.8935[/C][C]0.031559[/C][/ROW]
[ROW][C]14[/C][C]0.074066[/C][C]0.5737[/C][C]0.284153[/C][/ROW]
[ROW][C]15[/C][C]-0.038385[/C][C]-0.2973[/C][C]0.383621[/C][/ROW]
[ROW][C]16[/C][C]-0.087858[/C][C]-0.6805[/C][C]0.249388[/C][/ROW]
[ROW][C]17[/C][C]-0.100579[/C][C]-0.7791[/C][C]0.219498[/C][/ROW]
[ROW][C]18[/C][C]-0.131567[/C][C]-1.0191[/C][C]0.15612[/C][/ROW]
[ROW][C]19[/C][C]-0.206395[/C][C]-1.5987[/C][C]0.057567[/C][/ROW]
[ROW][C]20[/C][C]-0.289253[/C][C]-2.2405[/C][C]0.014385[/C][/ROW]
[ROW][C]21[/C][C]-0.335657[/C][C]-2.6[/C][C]0.00586[/C][/ROW]
[ROW][C]22[/C][C]-0.316418[/C][C]-2.451[/C][C]0.008589[/C][/ROW]
[ROW][C]23[/C][C]-0.253653[/C][C]-1.9648[/C][C]0.027037[/C][/ROW]
[ROW][C]24[/C][C]-0.228008[/C][C]-1.7661[/C][C]0.04123[/C][/ROW]
[ROW][C]25[/C][C]-0.311492[/C][C]-2.4128[/C][C]0.009451[/C][/ROW]
[ROW][C]26[/C][C]-0.400214[/C][C]-3.1[/C][C]0.001473[/C][/ROW]
[ROW][C]27[/C][C]-0.436605[/C][C]-3.3819[/C][C]0.000636[/C][/ROW]
[ROW][C]28[/C][C]-0.425598[/C][C]-3.2967[/C][C]0.000823[/C][/ROW]
[ROW][C]29[/C][C]-0.388725[/C][C]-3.011[/C][C]0.001903[/C][/ROW]
[ROW][C]30[/C][C]-0.36431[/C][C]-2.8219[/C][C]0.003232[/C][/ROW]
[ROW][C]31[/C][C]-0.369354[/C][C]-2.861[/C][C]0.002902[/C][/ROW]
[ROW][C]32[/C][C]-0.384411[/C][C]-2.9776[/C][C]0.002093[/C][/ROW]
[ROW][C]33[/C][C]-0.364162[/C][C]-2.8208[/C][C]0.003242[/C][/ROW]
[ROW][C]34[/C][C]-0.303585[/C][C]-2.3516[/C][C]0.010998[/C][/ROW]
[ROW][C]35[/C][C]-0.221499[/C][C]-1.7157[/C][C]0.045686[/C][/ROW]
[ROW][C]36[/C][C]-0.175614[/C][C]-1.3603[/C][C]0.089412[/C][/ROW]
[ROW][C]37[/C][C]-0.193735[/C][C]-1.5007[/C][C]0.069344[/C][/ROW]
[ROW][C]38[/C][C]-0.217446[/C][C]-1.6843[/C][C]0.048657[/C][/ROW]
[ROW][C]39[/C][C]-0.209458[/C][C]-1.6225[/C][C]0.054974[/C][/ROW]
[ROW][C]40[/C][C]-0.177079[/C][C]-1.3716[/C][C]0.087641[/C][/ROW]
[ROW][C]41[/C][C]-0.125747[/C][C]-0.974[/C][C]0.166976[/C][/ROW]
[ROW][C]42[/C][C]-0.091359[/C][C]-0.7077[/C][C]0.240947[/C][/ROW]
[ROW][C]43[/C][C]-0.077843[/C][C]-0.603[/C][C]0.2744[/C][/ROW]
[ROW][C]44[/C][C]-0.073311[/C][C]-0.5679[/C][C]0.286122[/C][/ROW]
[ROW][C]45[/C][C]-0.053274[/C][C]-0.4127[/C][C]0.340664[/C][/ROW]
[ROW][C]46[/C][C]-0.015862[/C][C]-0.1229[/C][C]0.451311[/C][/ROW]
[ROW][C]47[/C][C]0.028577[/C][C]0.2214[/C][C]0.412784[/C][/ROW]
[ROW][C]48[/C][C]0.053209[/C][C]0.4122[/C][C]0.340848[/C][/ROW]
[/TABLE]
Source: https://freestatistics.org/blog/index.php?pk=99684&T=1

Globally Unique Identifier (entire table): ba.freestatistics.org/blog/index.php?pk=99684&T=1

As an alternative you can also use a QR Code:  

The GUIDs for individual cells are displayed in the table below:

Autocorrelation Function
Time lag kACF(k)T-STATP-value
10.8851076.8560
20.7210885.58550
30.6153624.76666e-06
40.5798254.49131.6e-05
50.5838024.52211.5e-05
60.5624474.35672.6e-05
70.4812573.72780.000215
80.3836422.97170.002128
90.3218972.49340.007714
100.3245042.51360.007326
110.382182.96040.002198
120.3891773.01450.001884
130.2444471.89350.031559
140.0740660.57370.284153
15-0.038385-0.29730.383621
16-0.087858-0.68050.249388
17-0.100579-0.77910.219498
18-0.131567-1.01910.15612
19-0.206395-1.59870.057567
20-0.289253-2.24050.014385
21-0.335657-2.60.00586
22-0.316418-2.4510.008589
23-0.253653-1.96480.027037
24-0.228008-1.76610.04123
25-0.311492-2.41280.009451
26-0.400214-3.10.001473
27-0.436605-3.38190.000636
28-0.425598-3.29670.000823
29-0.388725-3.0110.001903
30-0.36431-2.82190.003232
31-0.369354-2.8610.002902
32-0.384411-2.97760.002093
33-0.364162-2.82080.003242
34-0.303585-2.35160.010998
35-0.221499-1.71570.045686
36-0.175614-1.36030.089412
37-0.193735-1.50070.069344
38-0.217446-1.68430.048657
39-0.209458-1.62250.054974
40-0.177079-1.37160.087641
41-0.125747-0.9740.166976
42-0.091359-0.70770.240947
43-0.077843-0.6030.2744
44-0.073311-0.56790.286122
45-0.053274-0.41270.340664
46-0.015862-0.12290.451311
470.0285770.22140.412784
480.0532090.41220.340848


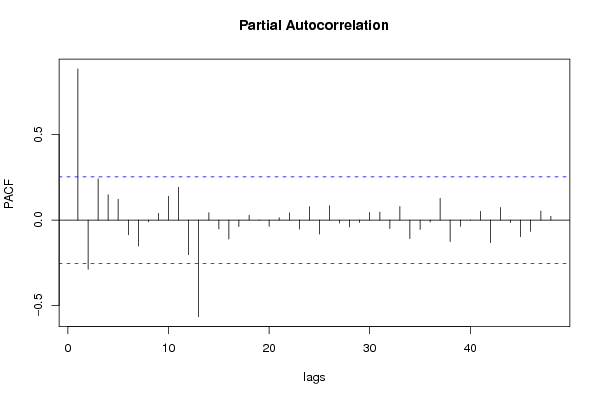
Partial Autocorrelation Function
Time lag kPACF(k)T-STATP-value
10.8851076.8560
2-0.287772-2.22910.014783
30.2424541.8780.032619
40.1480251.14660.128051
50.1218310.94370.174554
6-0.086528-0.67020.252637
7-0.151717-1.17520.12228
8-0.010227-0.07920.468561
90.0395390.30630.380232
100.1401571.08570.140988
110.1923961.49030.070693
12-0.202533-1.56880.060975
13-0.565703-4.38192.4e-05
140.043480.33680.368723
15-0.051885-0.40190.344592
16-0.111195-0.86130.196248
17-0.038207-0.2960.384144
180.0281540.21810.414053
19-0.001049-0.00810.496771
20-0.036435-0.28220.38937
210.0139460.1080.457167
220.0421680.32660.372541
23-0.052701-0.40820.342283
240.0776490.60150.274897
25-0.081733-0.63310.264538
260.0844530.65420.257752
27-0.017635-0.13660.445901
28-0.040918-0.31690.376192
29-0.014362-0.11130.455894
300.0438820.33990.367556
310.0468160.36260.359076
32-0.049362-0.38240.351773
330.0787730.61020.272027
34-0.107957-0.83620.203171
35-0.054703-0.42370.336641
36-0.011855-0.09180.463572
370.1272630.98580.164101
38-0.125417-0.97150.167607
39-0.036902-0.28580.387992
400.0001950.00150.499398
410.0512250.39680.346466
42-0.132168-1.02380.155026
430.0743240.57570.283482
44-0.014238-0.11030.456275
45-0.097166-0.75260.227303
46-0.066084-0.51190.305305
470.0524530.40630.342984
480.0217380.16840.433425

\begin{tabular}{lllllllll}
\hline
Partial Autocorrelation Function \tabularnewline
Time lag k & PACF(k) & T-STAT & P-value \tabularnewline
1 & 0.885107 & 6.856 & 0 \tabularnewline
2 & -0.287772 & -2.2291 & 0.014783 \tabularnewline
3 & 0.242454 & 1.878 & 0.032619 \tabularnewline
4 & 0.148025 & 1.1466 & 0.128051 \tabularnewline
5 & 0.121831 & 0.9437 & 0.174554 \tabularnewline
6 & -0.086528 & -0.6702 & 0.252637 \tabularnewline
7 & -0.151717 & -1.1752 & 0.12228 \tabularnewline
8 & -0.010227 & -0.0792 & 0.468561 \tabularnewline
9 & 0.039539 & 0.3063 & 0.380232 \tabularnewline
10 & 0.140157 & 1.0857 & 0.140988 \tabularnewline
11 & 0.192396 & 1.4903 & 0.070693 \tabularnewline
12 & -0.202533 & -1.5688 & 0.060975 \tabularnewline
13 & -0.565703 & -4.3819 & 2.4e-05 \tabularnewline
14 & 0.04348 & 0.3368 & 0.368723 \tabularnewline
15 & -0.051885 & -0.4019 & 0.344592 \tabularnewline
16 & -0.111195 & -0.8613 & 0.196248 \tabularnewline
17 & -0.038207 & -0.296 & 0.384144 \tabularnewline
18 & 0.028154 & 0.2181 & 0.414053 \tabularnewline
19 & -0.001049 & -0.0081 & 0.496771 \tabularnewline
20 & -0.036435 & -0.2822 & 0.38937 \tabularnewline
21 & 0.013946 & 0.108 & 0.457167 \tabularnewline
22 & 0.042168 & 0.3266 & 0.372541 \tabularnewline
23 & -0.052701 & -0.4082 & 0.342283 \tabularnewline
24 & 0.077649 & 0.6015 & 0.274897 \tabularnewline
25 & -0.081733 & -0.6331 & 0.264538 \tabularnewline
26 & 0.084453 & 0.6542 & 0.257752 \tabularnewline
27 & -0.017635 & -0.1366 & 0.445901 \tabularnewline
28 & -0.040918 & -0.3169 & 0.376192 \tabularnewline
29 & -0.014362 & -0.1113 & 0.455894 \tabularnewline
30 & 0.043882 & 0.3399 & 0.367556 \tabularnewline
31 & 0.046816 & 0.3626 & 0.359076 \tabularnewline
32 & -0.049362 & -0.3824 & 0.351773 \tabularnewline
33 & 0.078773 & 0.6102 & 0.272027 \tabularnewline
34 & -0.107957 & -0.8362 & 0.203171 \tabularnewline
35 & -0.054703 & -0.4237 & 0.336641 \tabularnewline
36 & -0.011855 & -0.0918 & 0.463572 \tabularnewline
37 & 0.127263 & 0.9858 & 0.164101 \tabularnewline
38 & -0.125417 & -0.9715 & 0.167607 \tabularnewline
39 & -0.036902 & -0.2858 & 0.387992 \tabularnewline
40 & 0.000195 & 0.0015 & 0.499398 \tabularnewline
41 & 0.051225 & 0.3968 & 0.346466 \tabularnewline
42 & -0.132168 & -1.0238 & 0.155026 \tabularnewline
43 & 0.074324 & 0.5757 & 0.283482 \tabularnewline
44 & -0.014238 & -0.1103 & 0.456275 \tabularnewline
45 & -0.097166 & -0.7526 & 0.227303 \tabularnewline
46 & -0.066084 & -0.5119 & 0.305305 \tabularnewline
47 & 0.052453 & 0.4063 & 0.342984 \tabularnewline
48 & 0.021738 & 0.1684 & 0.433425 \tabularnewline
\hline
\end{tabular}
%Source: https://freestatistics.org/blog/index.php?pk=99684&T=2

[TABLE]
[ROW][C]Partial Autocorrelation Function[/C][/ROW]
[ROW][C]Time lag k[/C][C]PACF(k)[/C][C]T-STAT[/C][C]P-value[/C][/ROW]
[ROW][C]1[/C][C]0.885107[/C][C]6.856[/C][C]0[/C][/ROW]
[ROW][C]2[/C][C]-0.287772[/C][C]-2.2291[/C][C]0.014783[/C][/ROW]
[ROW][C]3[/C][C]0.242454[/C][C]1.878[/C][C]0.032619[/C][/ROW]
[ROW][C]4[/C][C]0.148025[/C][C]1.1466[/C][C]0.128051[/C][/ROW]
[ROW][C]5[/C][C]0.121831[/C][C]0.9437[/C][C]0.174554[/C][/ROW]
[ROW][C]6[/C][C]-0.086528[/C][C]-0.6702[/C][C]0.252637[/C][/ROW]
[ROW][C]7[/C][C]-0.151717[/C][C]-1.1752[/C][C]0.12228[/C][/ROW]
[ROW][C]8[/C][C]-0.010227[/C][C]-0.0792[/C][C]0.468561[/C][/ROW]
[ROW][C]9[/C][C]0.039539[/C][C]0.3063[/C][C]0.380232[/C][/ROW]
[ROW][C]10[/C][C]0.140157[/C][C]1.0857[/C][C]0.140988[/C][/ROW]
[ROW][C]11[/C][C]0.192396[/C][C]1.4903[/C][C]0.070693[/C][/ROW]
[ROW][C]12[/C][C]-0.202533[/C][C]-1.5688[/C][C]0.060975[/C][/ROW]
[ROW][C]13[/C][C]-0.565703[/C][C]-4.3819[/C][C]2.4e-05[/C][/ROW]
[ROW][C]14[/C][C]0.04348[/C][C]0.3368[/C][C]0.368723[/C][/ROW]
[ROW][C]15[/C][C]-0.051885[/C][C]-0.4019[/C][C]0.344592[/C][/ROW]
[ROW][C]16[/C][C]-0.111195[/C][C]-0.8613[/C][C]0.196248[/C][/ROW]
[ROW][C]17[/C][C]-0.038207[/C][C]-0.296[/C][C]0.384144[/C][/ROW]
[ROW][C]18[/C][C]0.028154[/C][C]0.2181[/C][C]0.414053[/C][/ROW]
[ROW][C]19[/C][C]-0.001049[/C][C]-0.0081[/C][C]0.496771[/C][/ROW]
[ROW][C]20[/C][C]-0.036435[/C][C]-0.2822[/C][C]0.38937[/C][/ROW]
[ROW][C]21[/C][C]0.013946[/C][C]0.108[/C][C]0.457167[/C][/ROW]
[ROW][C]22[/C][C]0.042168[/C][C]0.3266[/C][C]0.372541[/C][/ROW]
[ROW][C]23[/C][C]-0.052701[/C][C]-0.4082[/C][C]0.342283[/C][/ROW]
[ROW][C]24[/C][C]0.077649[/C][C]0.6015[/C][C]0.274897[/C][/ROW]
[ROW][C]25[/C][C]-0.081733[/C][C]-0.6331[/C][C]0.264538[/C][/ROW]
[ROW][C]26[/C][C]0.084453[/C][C]0.6542[/C][C]0.257752[/C][/ROW]
[ROW][C]27[/C][C]-0.017635[/C][C]-0.1366[/C][C]0.445901[/C][/ROW]
[ROW][C]28[/C][C]-0.040918[/C][C]-0.3169[/C][C]0.376192[/C][/ROW]
[ROW][C]29[/C][C]-0.014362[/C][C]-0.1113[/C][C]0.455894[/C][/ROW]
[ROW][C]30[/C][C]0.043882[/C][C]0.3399[/C][C]0.367556[/C][/ROW]
[ROW][C]31[/C][C]0.046816[/C][C]0.3626[/C][C]0.359076[/C][/ROW]
[ROW][C]32[/C][C]-0.049362[/C][C]-0.3824[/C][C]0.351773[/C][/ROW]
[ROW][C]33[/C][C]0.078773[/C][C]0.6102[/C][C]0.272027[/C][/ROW]
[ROW][C]34[/C][C]-0.107957[/C][C]-0.8362[/C][C]0.203171[/C][/ROW]
[ROW][C]35[/C][C]-0.054703[/C][C]-0.4237[/C][C]0.336641[/C][/ROW]
[ROW][C]36[/C][C]-0.011855[/C][C]-0.0918[/C][C]0.463572[/C][/ROW]
[ROW][C]37[/C][C]0.127263[/C][C]0.9858[/C][C]0.164101[/C][/ROW]
[ROW][C]38[/C][C]-0.125417[/C][C]-0.9715[/C][C]0.167607[/C][/ROW]
[ROW][C]39[/C][C]-0.036902[/C][C]-0.2858[/C][C]0.387992[/C][/ROW]
[ROW][C]40[/C][C]0.000195[/C][C]0.0015[/C][C]0.499398[/C][/ROW]
[ROW][C]41[/C][C]0.051225[/C][C]0.3968[/C][C]0.346466[/C][/ROW]
[ROW][C]42[/C][C]-0.132168[/C][C]-1.0238[/C][C]0.155026[/C][/ROW]
[ROW][C]43[/C][C]0.074324[/C][C]0.5757[/C][C]0.283482[/C][/ROW]
[ROW][C]44[/C][C]-0.014238[/C][C]-0.1103[/C][C]0.456275[/C][/ROW]
[ROW][C]45[/C][C]-0.097166[/C][C]-0.7526[/C][C]0.227303[/C][/ROW]
[ROW][C]46[/C][C]-0.066084[/C][C]-0.5119[/C][C]0.305305[/C][/ROW]
[ROW][C]47[/C][C]0.052453[/C][C]0.4063[/C][C]0.342984[/C][/ROW]
[ROW][C]48[/C][C]0.021738[/C][C]0.1684[/C][C]0.433425[/C][/ROW]
[/TABLE]
Source: https://freestatistics.org/blog/index.php?pk=99684&T=2

Globally Unique Identifier (entire table): ba.freestatistics.org/blog/index.php?pk=99684&T=2

As an alternative you can also use a QR Code:  

The GUIDs for individual cells are displayed in the table below:

Partial Autocorrelation Function
Time lag kPACF(k)T-STATP-value
10.8851076.8560
2-0.287772-2.22910.014783
30.2424541.8780.032619
40.1480251.14660.128051
50.1218310.94370.174554
6-0.086528-0.67020.252637
7-0.151717-1.17520.12228
8-0.010227-0.07920.468561
90.0395390.30630.380232
100.1401571.08570.140988
110.1923961.49030.070693
12-0.202533-1.56880.060975
13-0.565703-4.38192.4e-05
140.043480.33680.368723
15-0.051885-0.40190.344592
16-0.111195-0.86130.196248
17-0.038207-0.2960.384144
180.0281540.21810.414053
19-0.001049-0.00810.496771
20-0.036435-0.28220.38937
210.0139460.1080.457167
220.0421680.32660.372541
23-0.052701-0.40820.342283
240.0776490.60150.274897
25-0.081733-0.63310.264538
260.0844530.65420.257752
27-0.017635-0.13660.445901
28-0.040918-0.31690.376192
29-0.014362-0.11130.455894
300.0438820.33990.367556
310.0468160.36260.359076
32-0.049362-0.38240.351773
330.0787730.61020.272027
34-0.107957-0.83620.203171
35-0.054703-0.42370.336641
36-0.011855-0.09180.463572
370.1272630.98580.164101
38-0.125417-0.97150.167607
39-0.036902-0.28580.387992
400.0001950.00150.499398
410.0512250.39680.346466
42-0.132168-1.02380.155026
430.0743240.57570.283482
44-0.014238-0.11030.456275
45-0.097166-0.75260.227303
46-0.066084-0.51190.305305
470.0524530.40630.342984
480.0217380.16840.433425


Parameters (Session):
par1 = 48 ; par2 = 1 ; par3 = 0 ; par4 = 0 ; par5 = 12 ; par6 = White Noise ; par7 = 0.95 ;
Parameters (R input):
par1 = 48 ; par2 = 1 ; par3 = 0 ; par4 = 0 ; par5 = 12 ; par6 = White Noise ; par7 = 0.95 ;
R code (references can be found in the software module):
if (par1 == 'Default') {
par1 = 10*log10(length(x))
} else {
par1 <- as.numeric(par1)
}
par2 <- as.numeric(par2)
par3 <- as.numeric(par3)
par4 <- as.numeric(par4)
par5 <- as.numeric(par5)
if (par6 == 'White Noise') par6 <- 'white' else par6 <- 'ma'
par7 <- as.numeric(par7)
if (par2 == 0) {
x <- log(x)
} else {
x <- (x ^ par2 - 1) / par2
}
if (par3 > 0) x <- diff(x,lag=1,difference=par3)
if (par4 > 0) x <- diff(x,lag=par5,difference=par4)
bitmap(file='pic1.png')
racf <- acf(x, par1, main='Autocorrelation', xlab='time lag', ylab='ACF', ci.type=par6, ci=par7, sub=paste('(lambda=',par2,', d=',par3,', D=',par4,', CI=', par7, ', CI type=',par6,')',sep=''))
dev.off()
bitmap(file='pic2.png')
rpacf <- pacf(x,par1,main='Partial Autocorrelation',xlab='lags',ylab='PACF')
dev.off()
(myacf <- c(racf$acf))
(mypacf <- c(rpacf$acf))
lengthx <- length(x)
sqrtn <- sqrt(lengthx)
load(file='createtable')
a<-table.start()
a<-table.row.start(a)
a<-table.element(a,'Autocorrelation Function',4,TRUE)
a<-table.row.end(a)
a<-table.row.start(a)
a<-table.element(a,'Time lag k',header=TRUE)
a<-table.element(a,hyperlink('basics.htm','ACF(k)','click here for more information about the Autocorrelation Function'),header=TRUE)
a<-table.element(a,'T-STAT',header=TRUE)
a<-table.element(a,'P-value',header=TRUE)
a<-table.row.end(a)
for (i in 2:(par1+1)) {
a<-table.row.start(a)
a<-table.element(a,i-1,header=TRUE)
a<-table.element(a,round(myacf[i],6))
mytstat <- myacf[i]*sqrtn
a<-table.element(a,round(mytstat,4))
a<-table.element(a,round(1-pt(abs(mytstat),lengthx),6))
a<-table.row.end(a)
}
a<-table.end(a)
table.save(a,file='mytable.tab')
a<-table.start()
a<-table.row.start(a)
a<-table.element(a,'Partial Autocorrelation Function',4,TRUE)
a<-table.row.end(a)
a<-table.row.start(a)
a<-table.element(a,'Time lag k',header=TRUE)
a<-table.element(a,hyperlink('basics.htm','PACF(k)','click here for more information about the Partial Autocorrelation Function'),header=TRUE)
a<-table.element(a,'T-STAT',header=TRUE)
a<-table.element(a,'P-value',header=TRUE)
a<-table.row.end(a)
for (i in 1:par1) {
a<-table.row.start(a)
a<-table.element(a,i,header=TRUE)
a<-table.element(a,round(mypacf[i],6))
mytstat <- mypacf[i]*sqrtn
a<-table.element(a,round(mytstat,4))
a<-table.element(a,round(1-pt(abs(mytstat),lengthx),6))
a<-table.row.end(a)
}
a<-table.end(a)
table.save(a,file='mytable1.tab')