| Multiple Linear Regression - Estimated Regression Equation |
| Bier[t] = + 69.8633744517073 -0.00683435744293085Tarwe[t] + 0.297906175405562suiker[t] + 0.0895655954552326minerwater[t] -0.0559117429109895`fruit `[t] + 0.301835836738048t + e[t] |
| Multiple Linear Regression - Ordinary Least Squares | |||||
| Variable | Parameter | S.D. | T-STAT H0: parameter = 0 | 2-tail p-value | 1-tail p-value |
| (Intercept) | 69.8633744517073 | 28.616018 | 2.4414 | 0.018069 | 0.009035 |
| Tarwe | -0.00683435744293085 | 0.00218 | -3.1355 | 0.002821 | 0.00141 |
| suiker | 0.297906175405562 | 0.133131 | 2.2377 | 0.029551 | 0.014775 |
| minerwater | 0.0895655954552326 | 0.255794 | 0.3501 | 0.727642 | 0.363821 |
| `fruit ` | -0.0559117429109895 | 0.022358 | -2.5008 | 0.015581 | 0.00779 |
| t | 0.301835836738048 | 0.084159 | 3.5865 | 0.00074 | 0.00037 |
| Multiple Linear Regression - Regression Statistics | |
| Multiple R | 0.991103313689328 |
| R-squared | 0.982285778405966 |
| Adjusted R-squared | 0.980582487868078 |
| F-TEST (value) | 576.698899310532 |
| F-TEST (DF numerator) | 5 |
| F-TEST (DF denominator) | 52 |
| p-value | 0 |
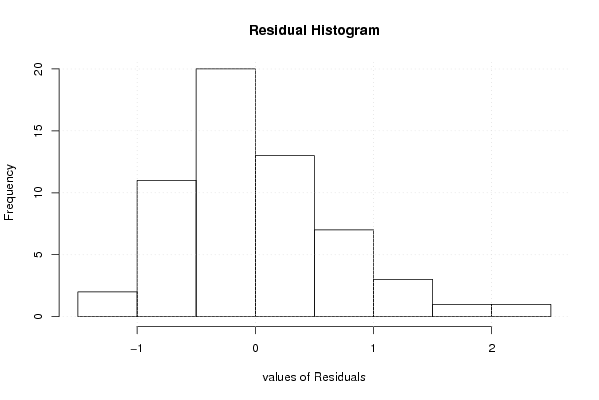
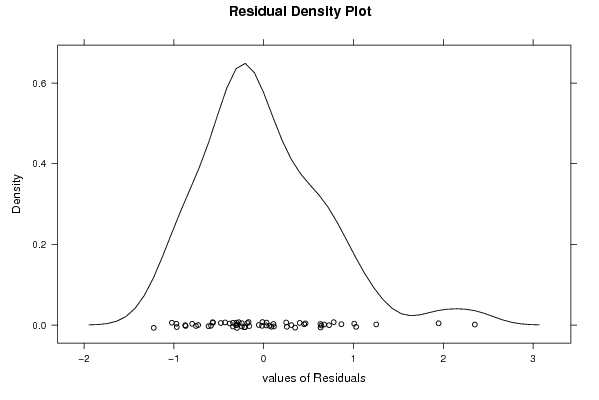
| Multiple Linear Regression - Residual Statistics | |
| Residual Standard Deviation | 0.734513116633436 |
| Sum Squared Residuals | 28.0544949623413 |
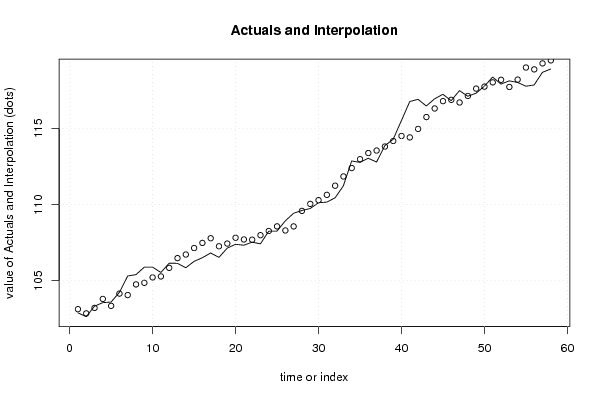
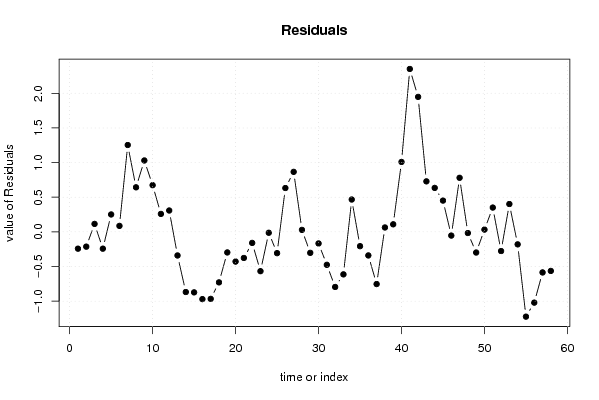
| Multiple Linear Regression - Actuals, Interpolation, and Residuals | |||
| Time or Index | Actuals | Interpolation Forecast | Residuals Prediction Error |
| 1 | 102.89 | 103.132683638906 | -0.242683638906177 |
| 2 | 102.64 | 102.853526571595 | -0.213526571595034 |
| 3 | 103.33 | 103.215152259253 | 0.114847740747191 |
| 4 | 103.56 | 103.802604471137 | -0.24260447113661 |
| 5 | 103.6 | 103.348764674565 | 0.251235325435013 |
| 6 | 104.24 | 104.153726201515 | 0.0862737984848322 |
| 7 | 105.31 | 104.056448386560 | 1.25355161344014 |
| 8 | 105.4 | 104.756956624306 | 0.643043375694419 |
| 9 | 105.89 | 104.859727774228 | 1.03027222577168 |
| 10 | 105.89 | 105.216063426023 | 0.673936573977261 |
| 11 | 105.54 | 105.281192530834 | 0.258807469165562 |
| 12 | 106.15 | 105.841760291386 | 0.308239708613978 |
| 13 | 106.14 | 106.48073216361 | -0.340732163609888 |
| 14 | 105.85 | 106.718434811289 | -0.868434811288836 |
| 15 | 106.27 | 107.143463460163 | -0.873463460162977 |
| 16 | 106.51 | 107.480706916274 | -0.97070691627391 |
| 17 | 106.82 | 107.787294437193 | -0.967294437192651 |
| 18 | 106.53 | 107.259107205440 | -0.729107205440385 |
| 19 | 107.14 | 107.437020977250 | -0.297020977250447 |
| 20 | 107.39 | 107.818746011574 | -0.428746011574177 |
| 21 | 107.33 | 107.706788516404 | -0.376788516404455 |
| 22 | 107.53 | 107.689458366650 | -0.159458366649669 |
| 23 | 107.42 | 107.987568287375 | -0.567568287375306 |
| 24 | 108.25 | 108.262918491175 | -0.0129184911753782 |
| 25 | 108.26 | 108.567157816095 | -0.30715781609545 |
| 26 | 108.93 | 108.297571081250 | 0.632428918750427 |
| 27 | 109.43 | 108.564018942331 | 0.865981057668588 |
| 28 | 109.61 | 109.581657776669 | 0.0283422233314187 |
| 29 | 109.74 | 110.042753165678 | -0.302753165677895 |
| 30 | 110.12 | 110.287302695253 | -0.167302695252599 |
| 31 | 110.16 | 110.635668114295 | -0.475668114295267 |
| 32 | 110.44 | 111.235478746547 | -0.795478746546753 |
| 33 | 111.23 | 111.843514754071 | -0.613514754071378 |
| 34 | 112.86 | 112.393226492119 | 0.466773507881204 |
| 35 | 112.77 | 112.976475489634 | -0.206475489634281 |
| 36 | 113.04 | 113.380262739529 | -0.340262739529257 |
| 37 | 112.79 | 113.543551552498 | -0.753551552497622 |
| 38 | 113.87 | 113.806687789089 | 0.063312210911412 |
| 39 | 114.28 | 114.171104066483 | 0.108895933517175 |
| 40 | 115.51 | 114.500567842858 | 1.00943215714189 |
| 41 | 116.76 | 114.408476741746 | 2.35152325825364 |
| 42 | 116.91 | 114.961828225906 | 1.94817177409439 |
| 43 | 116.47 | 115.741261338299 | 0.728738661700558 |
| 44 | 116.94 | 116.305667501602 | 0.634332498398377 |
| 45 | 117.24 | 116.78833702778 | 0.451662972220061 |
| 46 | 116.82 | 116.873497620107 | -0.0534976201070794 |
| 47 | 117.48 | 116.699665343874 | 0.780334656125546 |
| 48 | 117.11 | 117.127057241067 | -0.0170572410669104 |
| 49 | 117.31 | 117.608394248431 | -0.298394248430646 |
| 50 | 117.77 | 117.737342144220 | 0.0326578557795465 |
| 51 | 118.37 | 118.019290701756 | 0.350709298243679 |
| 52 | 117.91 | 118.187043278759 | -0.277043278759200 |
| 53 | 118.12 | 117.718336598076 | 0.401663401924421 |
| 54 | 118.02 | 118.200664764272 | -0.180664764271798 |
| 55 | 117.77 | 118.993943475454 | -1.22394347545425 |
| 56 | 117.85 | 118.871608312618 | -1.02160831261753 |
| 57 | 118.68 | 119.265792669255 | -0.585792669254667 |
| 58 | 118.9 | 119.463947207674 | -0.563947207673924 |
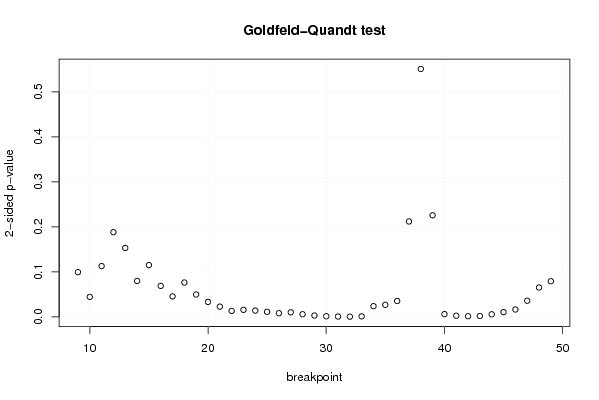
| Goldfeld-Quandt test for Heteroskedasticity | |||
| p-values | Alternative Hypothesis | ||
| breakpoint index | greater | 2-sided | less |
| 9 | 0.0496990253031775 | 0.099398050606355 | 0.950300974696823 |
| 10 | 0.0222756820580731 | 0.0445513641161461 | 0.977724317941927 |
| 11 | 0.0564725395864933 | 0.112945079172987 | 0.943527460413507 |
| 12 | 0.0941182559770203 | 0.188236511954041 | 0.90588174402298 |
| 13 | 0.0766250365206111 | 0.153250073041222 | 0.923374963479389 |
| 14 | 0.0399444132636314 | 0.0798888265272627 | 0.960055586736369 |
| 15 | 0.0575262014697434 | 0.115052402939487 | 0.942473798530256 |
| 16 | 0.0344679143784245 | 0.0689358287568489 | 0.965532085621576 |
| 17 | 0.0228079669946299 | 0.0456159339892597 | 0.97719203300537 |
| 18 | 0.0382155980381344 | 0.0764311960762687 | 0.961784401961866 |
| 19 | 0.0248468396196000 | 0.0496936792392001 | 0.9751531603804 |
| 20 | 0.0166701843084037 | 0.0333403686168075 | 0.983329815691596 |
| 21 | 0.0114028351402277 | 0.0228056702804555 | 0.988597164859772 |
| 22 | 0.00666737999275523 | 0.0133347599855105 | 0.993332620007245 |
| 23 | 0.0078581376272185 | 0.015716275254437 | 0.992141862372782 |
| 24 | 0.00704218197155988 | 0.0140843639431198 | 0.99295781802844 |
| 25 | 0.00570483905101195 | 0.0114096781020239 | 0.994295160948988 |
| 26 | 0.00409940757513739 | 0.00819881515027479 | 0.995900592424863 |
| 27 | 0.00509648246836754 | 0.0101929649367351 | 0.994903517531633 |
| 28 | 0.00295873944358895 | 0.00591747888717789 | 0.99704126055641 |
| 29 | 0.00153954833773910 | 0.00307909667547821 | 0.99846045166226 |
| 30 | 0.000750297593806008 | 0.00150059518761202 | 0.999249702406194 |
| 31 | 0.000383009087513662 | 0.000766018175027324 | 0.999616990912486 |
| 32 | 0.000275270399288779 | 0.000550540798577559 | 0.999724729600711 |
| 33 | 0.000631697535094076 | 0.00126339507018815 | 0.999368302464906 |
| 34 | 0.0119296005931846 | 0.0238592011863691 | 0.988070399406815 |
| 35 | 0.0134119722703183 | 0.0268239445406365 | 0.986588027729682 |
| 36 | 0.0176538812980499 | 0.0353077625960999 | 0.98234611870195 |
| 37 | 0.106031732314648 | 0.212063464629295 | 0.893968267685352 |
| 38 | 0.27556054225684 | 0.55112108451368 | 0.72443945774316 |
| 39 | 0.88713782419094 | 0.225724351618119 | 0.112862175809059 |
| 40 | 0.996938389905658 | 0.00612322018868453 | 0.00306161009434226 |
| 41 | 0.998678266203408 | 0.00264346759318382 | 0.00132173379659191 |
| 42 | 0.999233083538432 | 0.00153383292313501 | 0.000766916461567504 |
| 43 | 0.999036886084385 | 0.00192622783123081 | 0.000963113915615406 |
| 44 | 0.997098621419335 | 0.00580275716133079 | 0.00290137858066540 |
| 45 | 0.994679421162514 | 0.0106411576749724 | 0.0053205788374862 |
| 46 | 0.991797467895607 | 0.0164050642087860 | 0.00820253210439301 |
| 47 | 0.98199747757775 | 0.0360050448445007 | 0.0180025224222503 |
| 48 | 0.967347507450653 | 0.0653049850986936 | 0.0326524925493468 |
| 49 | 0.960372262097357 | 0.0792554758052866 | 0.0396277379026433 |
| Meta Analysis of Goldfeld-Quandt test for Heteroskedasticity | |||
| Description | # significant tests | % significant tests | OK/NOK |
| 1% type I error level | 12 | 0.292682926829268 | NOK |
| 5% type I error level | 28 | 0.682926829268293 | NOK |
| 10% type I error level | 34 | 0.829268292682927 | NOK |