| Multiple Linear Regression - Estimated Regression Equation |
| Bier[t] = -17.2101366875923 -0.0019115819018345Tarwe[t] + 0.187982201415514Suiker[t] + 1.00066611432293Mineraalwater[t] -0.0520181143946909Fruit[t] + e[t] |
| Multiple Linear Regression - Ordinary Least Squares | |||||
| Variable | Parameter | S.D. | T-STAT H0: parameter = 0 | 2-tail p-value | 1-tail p-value |
| (Intercept) | -17.2101366875923 | 16.756988 | -1.027 | 0.309065 | 0.154533 |
| Tarwe | -0.0019115819018345 | 0.001873 | -1.0205 | 0.312105 | 0.156053 |
| Suiker | 0.187982201415514 | 0.143322 | 1.3116 | 0.195306 | 0.097653 |
| Mineraalwater | 1.00066611432293 | 0.033099 | 30.2326 | 0 | 0 |
| Fruit | -0.0520181143946909 | 0.024704 | -2.1056 | 0.039992 | 0.019996 |
| Multiple Linear Regression - Regression Statistics | |
| Multiple R | 0.988890264126732 |
| R-squared | 0.977903954484638 |
| Adjusted R-squared | 0.976236328408007 |
| F-TEST (value) | 586.404811119399 |
| F-TEST (DF numerator) | 4 |
| F-TEST (DF denominator) | 53 |
| p-value | 0 |
| Multiple Linear Regression - Residual Statistics | |
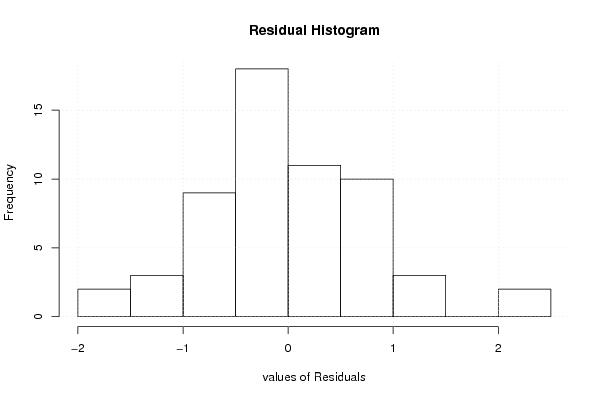
| Residual Standard Deviation | 0.812567660931656 |
| Sum Squared Residuals | 34.9941087903729 |
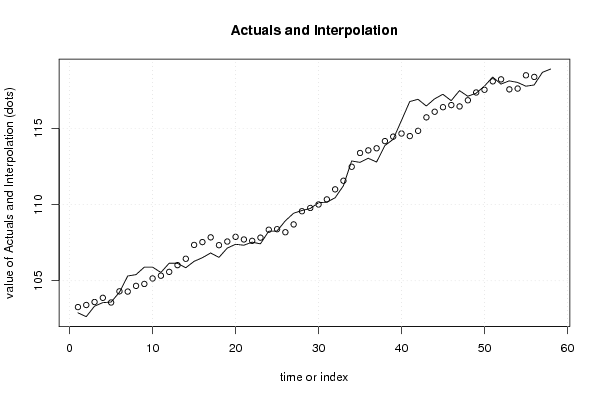
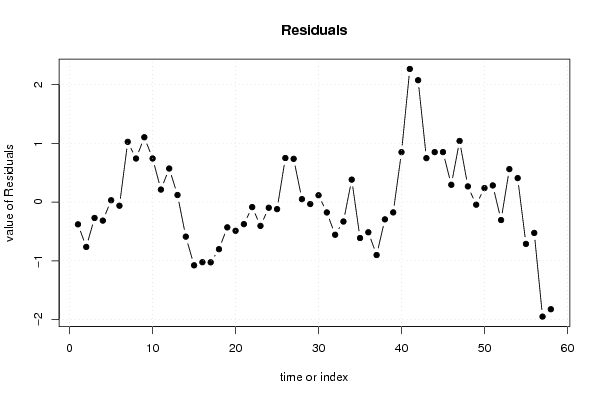
| Multiple Linear Regression - Actuals, Interpolation, and Residuals | |||
| Time or Index | Actuals | Interpolation Forecast | Residuals Prediction Error |
| 1 | 102.89 | 103.269675667857 | -0.37967566785704 |
| 2 | 102.64 | 103.404723259398 | -0.764723259398334 |
| 3 | 103.33 | 103.601076629004 | -0.271076629003569 |
| 4 | 103.56 | 103.876145370778 | -0.316145370777806 |
| 5 | 103.6 | 103.569773116954 | 0.0302268830459472 |
| 6 | 104.24 | 104.302673722804 | -0.0626737228035759 |
| 7 | 105.31 | 104.28550653614 | 1.02449346385997 |
| 8 | 105.4 | 104.659484685619 | 0.740515314380644 |
| 9 | 105.89 | 104.787427826517 | 1.10257217348268 |
| 10 | 105.89 | 105.148664769354 | 0.741335230645782 |
| 11 | 105.54 | 105.327836543019 | 0.212163456980617 |
| 12 | 106.15 | 105.579590957301 | 0.570409042698698 |
| 13 | 106.14 | 106.020455643162 | 0.119544356838327 |
| 14 | 105.85 | 106.439394890585 | -0.589394890584986 |
| 15 | 106.27 | 107.347543116858 | -1.07754311685796 |
| 16 | 106.51 | 107.534322317323 | -1.02432231732285 |
| 17 | 106.82 | 107.846254877167 | -1.02625487716703 |
| 18 | 106.53 | 107.332605434722 | -0.802605434721564 |
| 19 | 107.14 | 107.571308212059 | -0.431308212058648 |
| 20 | 107.39 | 107.879569286803 | -0.48956928680326 |
| 21 | 107.33 | 107.706449601491 | -0.376449601491115 |
| 22 | 107.53 | 107.616740731119 | -0.0867407311186347 |
| 23 | 107.42 | 107.825968309609 | -0.405968309609473 |
| 24 | 108.25 | 108.347370605976 | -0.097370605975953 |
| 25 | 108.26 | 108.380673592441 | -0.120673592441168 |
| 26 | 108.93 | 108.180809780899 | 0.749190219101455 |
| 27 | 109.43 | 108.694693104715 | 0.735306895284975 |
| 28 | 109.61 | 109.560864664271 | 0.0491353357289608 |
| 29 | 109.74 | 109.773991374670 | -0.0339913746701849 |
| 30 | 110.12 | 110.004649851698 | 0.115350148302389 |
| 31 | 110.16 | 110.337163143390 | -0.177163143390146 |
| 32 | 110.44 | 110.997057047080 | -0.557057047079817 |
| 33 | 111.23 | 111.561932077062 | -0.331932077061866 |
| 34 | 112.86 | 112.478595607787 | 0.381404392212776 |
| 35 | 112.77 | 113.383117591706 | -0.61311759170566 |
| 36 | 113.04 | 113.555280562017 | -0.515280562017024 |
| 37 | 112.79 | 113.692386678622 | -0.902386678622353 |
| 38 | 113.87 | 114.164991484063 | -0.294991484062631 |
| 39 | 114.28 | 114.456821509553 | -0.176821509552931 |
| 40 | 115.51 | 114.661394241797 | 0.848605758202528 |
| 41 | 116.76 | 114.494517755164 | 2.26548224483639 |
| 42 | 116.91 | 114.836453517077 | 2.07354648292345 |
| 43 | 116.47 | 115.722983854469 | 0.747016145530638 |
| 44 | 116.94 | 116.090360638561 | 0.84963936143926 |
| 45 | 117.24 | 116.389460165153 | 0.85053983484724 |
| 46 | 116.82 | 116.526630861703 | 0.293369138297139 |
| 47 | 117.48 | 116.440499634468 | 1.03950036553201 |
| 48 | 117.11 | 116.843828344924 | 0.266171655075977 |
| 49 | 117.31 | 117.355007799778 | -0.0450077997784247 |
| 50 | 117.77 | 117.532550799849 | 0.237449200150527 |
| 51 | 118.37 | 118.087531386159 | 0.282468613841315 |
| 52 | 117.91 | 118.216637617134 | -0.306637617133607 |
| 53 | 118.12 | 117.559763907109 | 0.560236092891495 |
| 54 | 118.02 | 117.612692478639 | 0.407307521360612 |
| 55 | 117.77 | 118.483187154614 | -0.71318715461382 |
| 56 | 117.85 | 118.376299915237 | -0.526299915237298 |
| 57 | 118.68 | 120.631437404962 | -1.95143740496156 |
| 58 | 118.9 | 120.725172341612 | -1.82517234161151 |
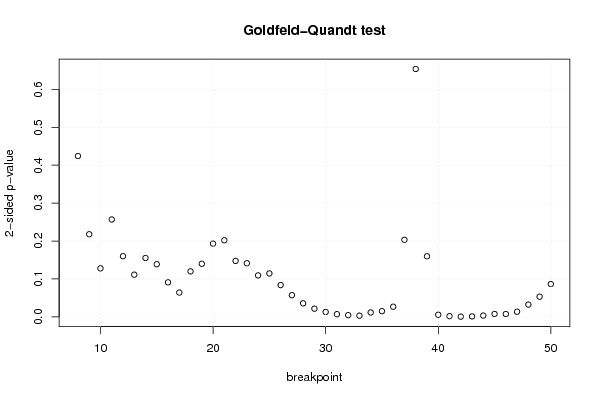
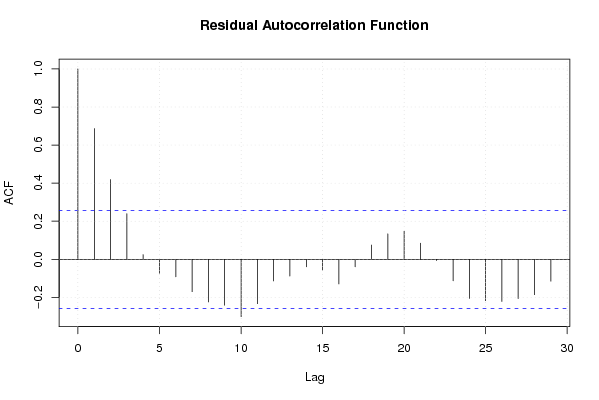
| Goldfeld-Quandt test for Heteroskedasticity | |||
| p-values | Alternative Hypothesis | ||
| breakpoint index | greater | 2-sided | less |
| 8 | 0.212088462413219 | 0.424176924826438 | 0.787911537586781 |
| 9 | 0.108952444256102 | 0.217904888512204 | 0.891047555743898 |
| 10 | 0.0640270242196385 | 0.128054048439277 | 0.935972975780361 |
| 11 | 0.128407432180850 | 0.256814864361699 | 0.87159256781915 |
| 12 | 0.0800168373870307 | 0.160033674774061 | 0.919983162612969 |
| 13 | 0.055648806552363 | 0.111297613104726 | 0.944351193447637 |
| 14 | 0.0776865495528841 | 0.155373099105768 | 0.922313450447116 |
| 15 | 0.0694808245196448 | 0.138961649039290 | 0.930519175480355 |
| 16 | 0.045571408413727 | 0.091142816827454 | 0.954428591586273 |
| 17 | 0.0320988818928830 | 0.0641977637857661 | 0.967901118107117 |
| 18 | 0.0599971634422805 | 0.119994326884561 | 0.94000283655772 |
| 19 | 0.0700337964546971 | 0.140067592909394 | 0.929966203545303 |
| 20 | 0.096566765370472 | 0.193133530740944 | 0.903433234629528 |
| 21 | 0.101016725961956 | 0.202033451923912 | 0.898983274038044 |
| 22 | 0.0738000267377063 | 0.147600053475413 | 0.926199973262294 |
| 23 | 0.0707399066953263 | 0.141479813390653 | 0.929260093304674 |
| 24 | 0.0547111060689607 | 0.109422212137921 | 0.94528889393104 |
| 25 | 0.0572992903086442 | 0.114598580617288 | 0.942700709691356 |
| 26 | 0.0419516111882869 | 0.0839032223765737 | 0.958048388811713 |
| 27 | 0.0286334936738851 | 0.0572669873477703 | 0.971366506326115 |
| 28 | 0.0178989380364287 | 0.0357978760728574 | 0.982101061963571 |
| 29 | 0.0108573758904101 | 0.0217147517808202 | 0.98914262410959 |
| 30 | 0.00651531057335713 | 0.0130306211467143 | 0.993484689426643 |
| 31 | 0.00361497359248906 | 0.00722994718497813 | 0.99638502640751 |
| 32 | 0.00228402703707015 | 0.00456805407414031 | 0.99771597296293 |
| 33 | 0.00163974970018582 | 0.00327949940037164 | 0.998360250299814 |
| 34 | 0.00583561802614232 | 0.0116712360522846 | 0.994164381973858 |
| 35 | 0.00755289514421145 | 0.0151057902884229 | 0.992447104855789 |
| 36 | 0.0134348853912624 | 0.0268697707825247 | 0.986565114608738 |
| 37 | 0.101645934534660 | 0.203291869069319 | 0.89835406546534 |
| 38 | 0.326870521385151 | 0.653741042770301 | 0.67312947861485 |
| 39 | 0.920083604712839 | 0.159832790574322 | 0.079916395287161 |
| 40 | 0.997170357242021 | 0.00565928551595782 | 0.00282964275797891 |
| 41 | 0.99903192733268 | 0.00193614533464115 | 0.000968072667320576 |
| 42 | 0.999669876142896 | 0.000660247714208514 | 0.000330123857104257 |
| 43 | 0.999365173678639 | 0.00126965264272274 | 0.000634826321361371 |
| 44 | 0.998226810371752 | 0.00354637925649517 | 0.00177318962824759 |
| 45 | 0.996103017466803 | 0.00779396506639374 | 0.00389698253319687 |
| 46 | 0.996230099360724 | 0.0075398012785519 | 0.00376990063927595 |
| 47 | 0.993150536729835 | 0.0136989265403292 | 0.00684946327016459 |
| 48 | 0.983774543208196 | 0.0324509135836074 | 0.0162254567918037 |
| 49 | 0.973350310501078 | 0.0532993789978448 | 0.0266496894989224 |
| 50 | 0.956691452883653 | 0.086617094232695 | 0.0433085471163475 |
| Meta Analysis of Goldfeld-Quandt test for Heteroskedasticity | |||
| Description | # significant tests | % significant tests | OK/NOK |
| 1% type I error level | 10 | 0.232558139534884 | NOK |
| 5% type I error level | 18 | 0.418604651162791 | NOK |
| 10% type I error level | 24 | 0.558139534883721 | NOK |