| Multiple Linear Regression - Estimated Regression Equation |
| slaagkans[t] = + 26.8300788181571 -0.39718687633662verzekeraar[t] + 0.525635231419669kost[t] + 0.734765737056835grootte[t] + 0.0308685622071769snelheid[t] + 0.318502498855332maand[t] -0.144918874305115t + e[t] |
| Multiple Linear Regression - Ordinary Least Squares | |||||
| Variable | Parameter | S.D. | T-STAT H0: parameter = 0 | 2-tail p-value | 1-tail p-value |
| (Intercept) | 26.8300788181571 | 27.276257 | 0.9836 | 0.330794 | 0.165397 |
| verzekeraar | -0.39718687633662 | 2.82093 | -0.1408 | 0.888685 | 0.444343 |
| kost | 0.525635231419669 | 0.165611 | 3.1739 | 0.002778 | 0.001389 |
| grootte | 0.734765737056835 | 4.48739 | 0.1637 | 0.870703 | 0.435351 |
| snelheid | 0.0308685622071769 | 0.135522 | 0.2278 | 0.820901 | 0.41045 |
| maand | 0.318502498855332 | 1.145549 | 0.278 | 0.782318 | 0.391159 |
| t | -0.144918874305115 | 0.287528 | -0.504 | 0.616822 | 0.308411 |
| Multiple Linear Regression - Regression Statistics | |
| Multiple R | 0.484479983675251 |
| R-squared | 0.234720854581971 |
| Adjusted R-squared | 0.127937718012013 |
| F-TEST (value) | 2.19810788596003 |
| F-TEST (DF numerator) | 6 |
| F-TEST (DF denominator) | 43 |
| p-value | 0.0615615092501303 |
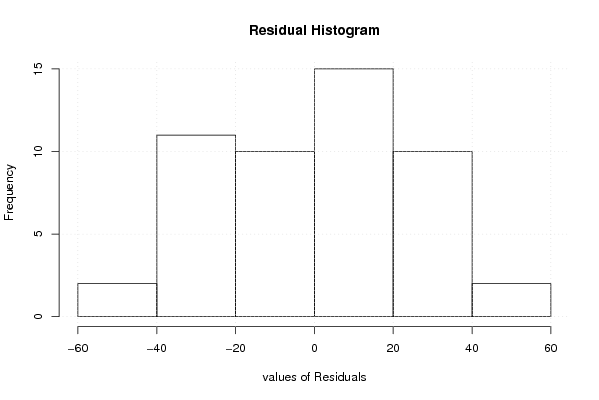
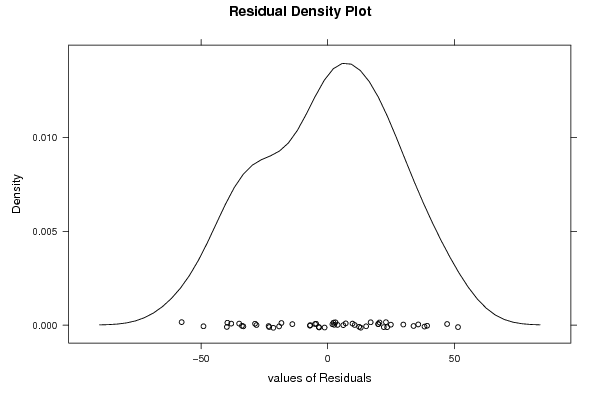
| Multiple Linear Regression - Residual Statistics | |
| Residual Standard Deviation | 28.0290263146554 |
| Sum Squared Residuals | 33781.9315943488 |
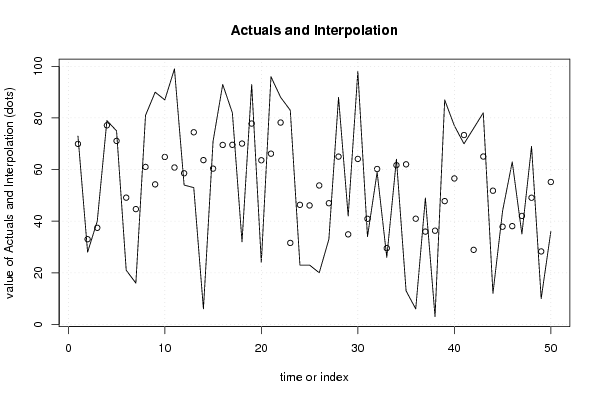
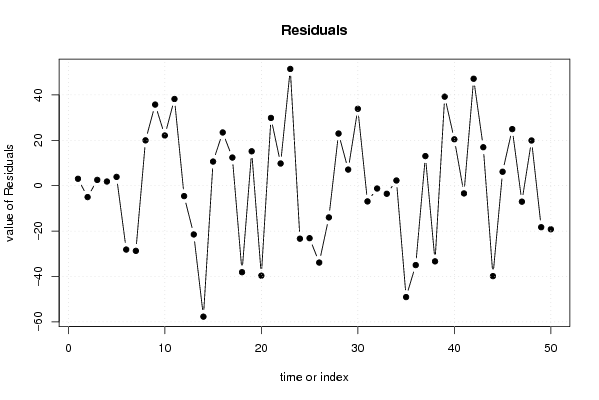
| Multiple Linear Regression - Actuals, Interpolation, and Residuals | |||
| Time or Index | Actuals | Interpolation Forecast | Residuals Prediction Error |
| 1 | 73 | 69.9428042058524 | 3.05719579414758 |
| 2 | 28 | 33.0103958459621 | -5.01039584596214 |
| 3 | 40 | 37.4364212260157 | 2.56357877398430 |
| 4 | 79 | 77.1457759184018 | 1.85422408159817 |
| 5 | 75 | 71.1148800534806 | 3.88511994651943 |
| 6 | 21 | 49.115691453555 | -28.1156914535550 |
| 7 | 16 | 44.6824944773005 | -28.6824944773005 |
| 8 | 81 | 61.0229774359705 | 19.9770225640295 |
| 9 | 90 | 54.26725032417 | 35.73274967583 |
| 10 | 87 | 64.8809190663154 | 22.1190809336846 |
| 11 | 99 | 60.80570140515 | 38.1942985948501 |
| 12 | 54 | 58.5707906743502 | -4.57079067435021 |
| 13 | 53 | 74.4616778600394 | -21.4616778600394 |
| 14 | 6 | 63.6620313370442 | -57.6620313370442 |
| 15 | 71 | 60.3667640534394 | 10.6332359465606 |
| 16 | 93 | 69.55237271424 | 23.44762728576 |
| 17 | 82 | 69.5958388548387 | 12.4041611451613 |
| 18 | 32 | 70.0784939205875 | -38.0784939205875 |
| 19 | 93 | 77.8366041656607 | 15.1633958343393 |
| 20 | 24 | 63.6131390576111 | -39.6131390576111 |
| 21 | 96 | 66.1561912998012 | 29.8438087001988 |
| 22 | 88 | 78.2207028311218 | 9.77929716887822 |
| 23 | 83 | 31.5765443127978 | 51.4234556872022 |
| 24 | 23 | 46.3241302272365 | -23.3241302272365 |
| 25 | 23 | 46.1041863742642 | -23.1041863742642 |
| 26 | 20 | 53.840489157971 | -33.840489157971 |
| 27 | 33 | 46.9575652833125 | -13.9575652833125 |
| 28 | 88 | 65.0209883655595 | 22.9790116344405 |
| 29 | 42 | 34.895143091905 | 7.10485690809501 |
| 30 | 98 | 64.1234261375546 | 33.8765738624454 |
| 31 | 34 | 40.9141373207600 | -6.91413732076005 |
| 32 | 59 | 60.2264814984457 | -1.22648149844571 |
| 33 | 26 | 29.5407927271432 | -3.54079272714323 |
| 34 | 64 | 61.7047168321768 | 2.29528316782319 |
| 35 | 13 | 62.0333120192965 | -49.0333120192965 |
| 36 | 6 | 40.9499173845932 | -34.9499173845932 |
| 37 | 49 | 35.9554257671481 | 13.0445742328519 |
| 38 | 3 | 36.3065596303886 | -33.3065596303886 |
| 39 | 87 | 47.7812450604872 | 39.2187549395128 |
| 40 | 77 | 56.5622914521314 | 20.4377085478686 |
| 41 | 70 | 73.3873270981743 | -3.38732709817425 |
| 42 | 76 | 28.8867923494887 | 47.1132076505113 |
| 43 | 82 | 65.0552284797315 | 16.9447715202685 |
| 44 | 12 | 51.8095344093154 | -39.8095344093154 |
| 45 | 44 | 37.8505258630149 | 6.14947413698506 |
| 46 | 63 | 38.0746297010116 | 24.9253702989884 |
| 47 | 35 | 42.0273539798517 | -7.02735397985172 |
| 48 | 69 | 49.0874186551782 | 19.9125813448218 |
| 49 | 10 | 28.2786005183774 | -18.2786005183774 |
| 50 | 36 | 55.1853181217762 | -19.1853181217762 |
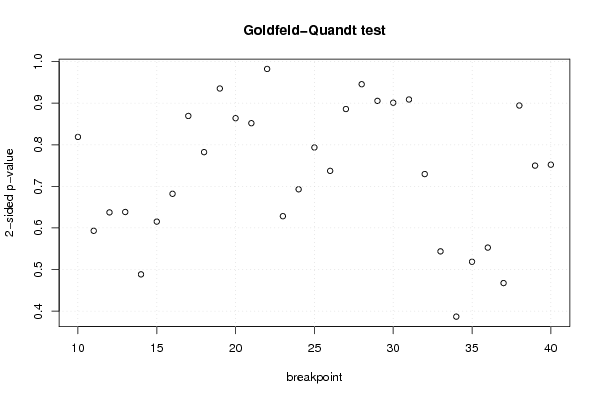
| Goldfeld-Quandt test for Heteroskedasticity | |||
| p-values | Alternative Hypothesis | ||
| breakpoint index | greater | 2-sided | less |
| 10 | 0.409373249122097 | 0.818746498244194 | 0.590626750877903 |
| 11 | 0.296628931176052 | 0.593257862352104 | 0.703371068823948 |
| 12 | 0.318731295663219 | 0.637462591326437 | 0.681268704336781 |
| 13 | 0.319200961037059 | 0.638401922074119 | 0.680799038962941 |
| 14 | 0.7557064478902 | 0.488587104219601 | 0.244293552109800 |
| 15 | 0.692333428276687 | 0.615333143446626 | 0.307666571723313 |
| 16 | 0.658917773695881 | 0.682164452608237 | 0.341082226304119 |
| 17 | 0.565399285314007 | 0.869201429371986 | 0.434600714685993 |
| 18 | 0.608883126274927 | 0.782233747450147 | 0.391116873725073 |
| 19 | 0.532422381523346 | 0.935155236953307 | 0.467577618476654 |
| 20 | 0.568094044388775 | 0.86381191122245 | 0.431905955611225 |
| 21 | 0.57412547363144 | 0.85174905273712 | 0.42587452636856 |
| 22 | 0.491072043977387 | 0.982144087954773 | 0.508927956022613 |
| 23 | 0.685827839878086 | 0.628344320243827 | 0.314172160121914 |
| 24 | 0.65353888426076 | 0.692922231478481 | 0.346461115739240 |
| 25 | 0.603272556796338 | 0.793454886407324 | 0.396727443203662 |
| 26 | 0.631358118012329 | 0.737283763975343 | 0.368641881987671 |
| 27 | 0.557070731653681 | 0.885858536692639 | 0.442929268346319 |
| 28 | 0.527289578563128 | 0.945420842873744 | 0.472710421436872 |
| 29 | 0.452733039460211 | 0.905466078920423 | 0.547266960539789 |
| 30 | 0.549517815371967 | 0.900964369256067 | 0.450482184628033 |
| 31 | 0.454379057419053 | 0.908758114838105 | 0.545620942580948 |
| 32 | 0.36477232796456 | 0.72954465592912 | 0.63522767203544 |
| 33 | 0.271927901566851 | 0.543855803133703 | 0.728072098433149 |
| 34 | 0.193468072562519 | 0.386936145125038 | 0.806531927437481 |
| 35 | 0.25939847397099 | 0.51879694794198 | 0.74060152602901 |
| 36 | 0.2764425356142 | 0.5528850712284 | 0.7235574643858 |
| 37 | 0.233818336453229 | 0.467636672906458 | 0.766181663546771 |
| 38 | 0.44713614328225 | 0.8942722865645 | 0.55286385671775 |
| 39 | 0.374919712280864 | 0.749839424561727 | 0.625080287719136 |
| 40 | 0.376014540805878 | 0.752029081611756 | 0.623985459194122 |
| Meta Analysis of Goldfeld-Quandt test for Heteroskedasticity | |||
| Description | # significant tests | % significant tests | OK/NOK |
| 1% type I error level | 0 | 0 | OK |
| 5% type I error level | 0 | 0 | OK |
| 10% type I error level | 0 | 0 | OK |