| Tabulation of Results | ||||
| depression x separate | ||||
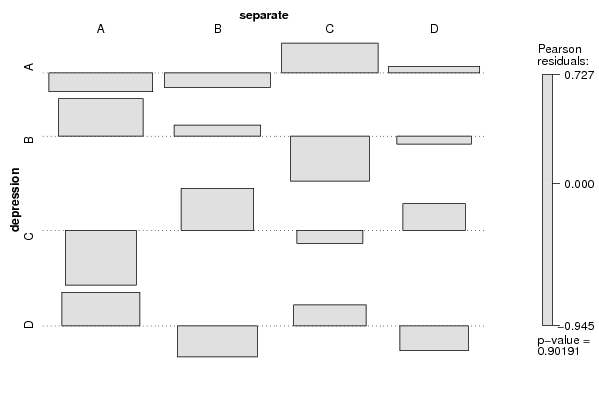
| A | B | C | D | A | 15 | 16 | 16 | 13 | B | 13 | 12 | 7 | 8 | C | 5 | 10 | 6 | 7 | D | 11 | 8 | 9 | 6 |
| Tabulation of Expected Results | ||||
| depression x separate | ||||
| A | B | C | D | A | 16.3 | 17.04 | 14.07 | 12.59 | B | 10.86 | 11.36 | 9.38 | 8.4 | C | 7.6 | 7.95 | 6.57 | 5.88 | D | 9.23 | 9.65 | 7.98 | 7.14 |
| Statistical Results | |
| Pearson's Chi-squared test with simulated p-value (based on 2000 replicates) | |
| Chi Square Statistic | 4.14 |
| P value | 0.91 |