| Multiple Linear Regression - Estimated Regression Equation |
| slaagkans[t] = + 21.2435270406808 -0.189021294324606verzekeraar[t] + 0.546658570171708kost[t] + 0.788682667921521grootte[t] + 0.0270026552096039snelheid[t] + 0.345099845668745maand[t] + e[t] |
| Multiple Linear Regression - Ordinary Least Squares | |||||
| Variable | Parameter | S.D. | T-STAT H0: parameter = 0 | 2-tail p-value | 1-tail p-value |
| (Intercept) | 21.2435270406808 | 24.710473 | 0.8597 | 0.394616 | 0.197308 |
| verzekeraar | -0.189021294324606 | 2.766775 | -0.0683 | 0.945842 | 0.472921 |
| kost | 0.546658570171708 | 0.158908 | 3.4401 | 0.001284 | 0.000642 |
| grootte | 0.788682667921521 | 4.447924 | 0.1773 | 0.860075 | 0.430037 |
| snelheid | 0.0270026552096039 | 0.134153 | 0.2013 | 0.841405 | 0.420703 |
| maand | 0.345099845668745 | 1.134591 | 0.3042 | 0.762438 | 0.381219 |
| Multiple Linear Regression - Regression Statistics | |
| Multiple R | 0.479791384134689 |
| R-squared | 0.230199772289880 |
| Adjusted R-squared | 0.142722473686458 |
| F-TEST (value) | 2.63153727841424 |
| F-TEST (DF numerator) | 5 |
| F-TEST (DF denominator) | 44 |
| p-value | 0.0363218943091439 |
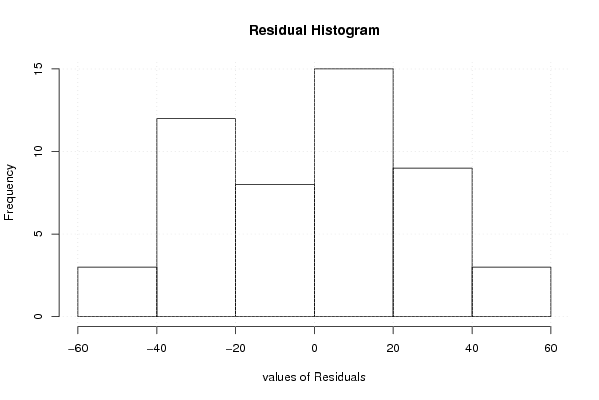
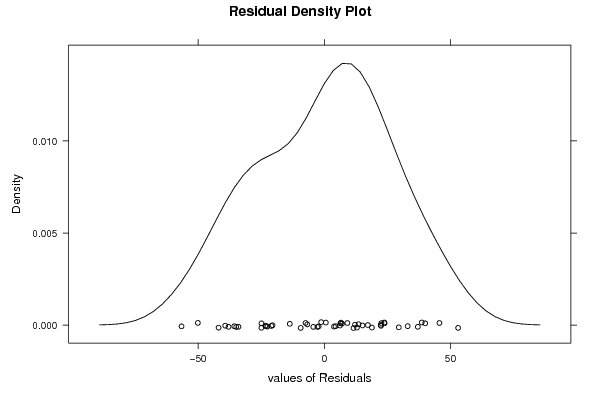
| Multiple Linear Regression - Residual Statistics | |
| Residual Standard Deviation | 27.7904116050644 |
| Sum Squared Residuals | 33981.5069958716 |
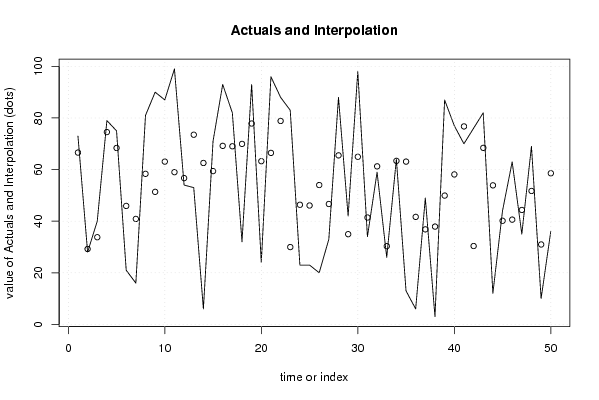
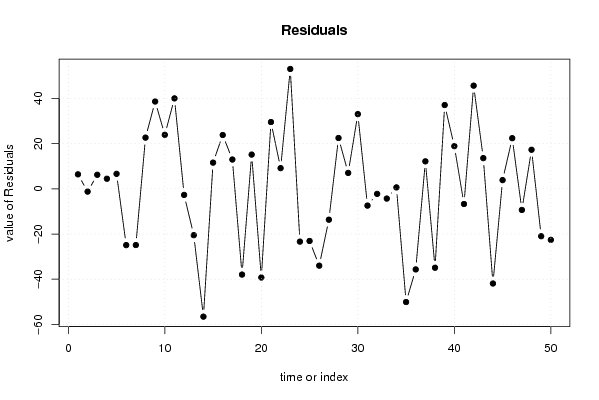
| Multiple Linear Regression - Actuals, Interpolation, and Residuals | |||
| Time or Index | Actuals | Interpolation Forecast | Residuals Prediction Error |
| 1 | 73 | 66.5913029636444 | 6.4086970363556 |
| 2 | 28 | 29.2278267061414 | -1.22782670614140 |
| 3 | 40 | 33.7884662270152 | 6.21153377298481 |
| 4 | 79 | 74.5417180149841 | 4.45828198501587 |
| 5 | 75 | 68.3717814827618 | 6.62821851723822 |
| 6 | 21 | 45.9059702515849 | -24.9059702515849 |
| 7 | 16 | 40.8742385495194 | -24.8742385495194 |
| 8 | 81 | 58.3535199386703 | 22.6464800613297 |
| 9 | 90 | 51.3642663482893 | 38.6357336517107 |
| 10 | 87 | 63.0922795222357 | 23.9077204777643 |
| 11 | 99 | 58.9952534044508 | 40.0047465955492 |
| 12 | 54 | 56.701342662365 | -2.70134266236496 |
| 13 | 53 | 73.5065341939744 | -20.5065341939744 |
| 14 | 6 | 62.5598800408435 | -56.5598800408435 |
| 15 | 71 | 59.412814131667 | 11.5871858683329 |
| 16 | 93 | 69.1916027460129 | 23.8083972539871 |
| 17 | 82 | 69.0350043629585 | 12.9649956370415 |
| 18 | 32 | 69.9396706422864 | -37.9396706422864 |
| 19 | 93 | 77.8506888327145 | 15.1493111672855 |
| 20 | 24 | 63.2509722106068 | -39.2509722106068 |
| 21 | 96 | 66.4594955815581 | 29.5405044184419 |
| 22 | 88 | 78.8496034278642 | 9.15039657213578 |
| 23 | 83 | 29.9625188985102 | 53.0374811014898 |
| 24 | 23 | 46.3563009611064 | -23.3563009611064 |
| 25 | 23 | 46.0783539040421 | -23.0783539040421 |
| 26 | 20 | 54.0028717520872 | -34.0028717520872 |
| 27 | 33 | 46.660622172898 | -13.660622172898 |
| 28 | 88 | 65.5140402583913 | 22.4859597416087 |
| 29 | 42 | 34.9631058042881 | 7.03689419571192 |
| 30 | 98 | 64.9504109821951 | 33.0495890178049 |
| 31 | 34 | 41.4150705063765 | -7.41507050637646 |
| 32 | 59 | 61.2495521527782 | -2.24955215277821 |
| 33 | 26 | 30.3148653378247 | -4.31486533782468 |
| 34 | 64 | 63.379780935049 | 0.620219064951007 |
| 35 | 13 | 63.0883295169072 | -50.0883295169072 |
| 36 | 6 | 41.663616383533 | -35.663616383533 |
| 37 | 49 | 36.8361261330018 | 12.1638738669982 |
| 38 | 3 | 37.9052012768741 | -34.9052012768741 |
| 39 | 87 | 49.9219358094036 | 37.0780641905964 |
| 40 | 77 | 58.117966085154 | 18.882033914846 |
| 41 | 70 | 76.7212993646978 | -6.72129936469776 |
| 42 | 76 | 30.3628322234458 | 45.6371677765542 |
| 43 | 82 | 68.4207804798163 | 13.5792195201837 |
| 44 | 12 | 53.8866455735835 | -41.8866455735835 |
| 45 | 44 | 40.1473816640818 | 3.85261833591824 |
| 46 | 63 | 40.599645091627 | 22.4003549083730 |
| 47 | 35 | 44.3464233300635 | -9.3464233300635 |
| 48 | 69 | 51.7164360314108 | 17.2835639685892 |
| 49 | 10 | 30.9765395379208 | -20.9765395379208 |
| 50 | 36 | 58.5771155907836 | -22.5771155907836 |
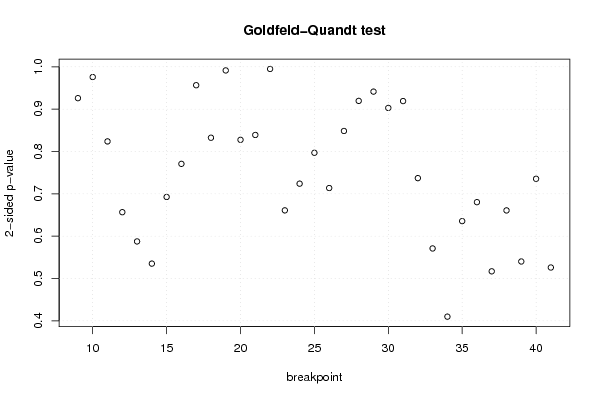
| Goldfeld-Quandt test for Heteroskedasticity | |||
| p-values | Alternative Hypothesis | ||
| breakpoint index | greater | 2-sided | less |
| 9 | 0.537032818778377 | 0.925934362443246 | 0.462967181221623 |
| 10 | 0.487884027537456 | 0.975768055074912 | 0.512115972462544 |
| 11 | 0.411889610180891 | 0.823779220361783 | 0.588110389819109 |
| 12 | 0.32829621448542 | 0.65659242897084 | 0.67170378551458 |
| 13 | 0.293772201437280 | 0.587544402874559 | 0.70622779856272 |
| 14 | 0.73244412037935 | 0.5351117592413 | 0.26755587962065 |
| 15 | 0.653719444377639 | 0.692561111244723 | 0.346280555622361 |
| 16 | 0.614620997907952 | 0.770758004184097 | 0.385379002092048 |
| 17 | 0.521757142936793 | 0.956485714126414 | 0.478242857063207 |
| 18 | 0.583784142951404 | 0.832431714097191 | 0.416215857048596 |
| 19 | 0.50429737582904 | 0.99140524834192 | 0.49570262417096 |
| 20 | 0.58622321588836 | 0.827553568223279 | 0.413776784111640 |
| 21 | 0.580486125822995 | 0.839027748354011 | 0.419513874177006 |
| 22 | 0.497453739674429 | 0.994907479348857 | 0.502546260325571 |
| 23 | 0.669542517240056 | 0.660914965519888 | 0.330457482759944 |
| 24 | 0.638018530533255 | 0.72396293893349 | 0.361981469466745 |
| 25 | 0.601550256169436 | 0.796899487661128 | 0.398449743830564 |
| 26 | 0.643174623320532 | 0.713650753358935 | 0.356825376679468 |
| 27 | 0.57580084971642 | 0.84839830056716 | 0.42419915028358 |
| 28 | 0.54026254580832 | 0.91947490838336 | 0.45973745419168 |
| 29 | 0.470684012688482 | 0.941368025376964 | 0.529315987311518 |
| 30 | 0.548578505079109 | 0.902842989841782 | 0.451421494920891 |
| 31 | 0.459533155585378 | 0.919066311170756 | 0.540466844414622 |
| 32 | 0.368513731662366 | 0.737027463324732 | 0.631486268337634 |
| 33 | 0.285493211950997 | 0.570986423901994 | 0.714506788049003 |
| 34 | 0.204934796032072 | 0.409869592064144 | 0.795065203967928 |
| 35 | 0.317779778895449 | 0.635559557790898 | 0.682220221104551 |
| 36 | 0.340149363958446 | 0.680298727916893 | 0.659850636041554 |
| 37 | 0.258475040950477 | 0.516950081900954 | 0.741524959049523 |
| 38 | 0.330395065139085 | 0.66079013027817 | 0.669604934860915 |
| 39 | 0.27007958131117 | 0.54015916262234 | 0.72992041868883 |
| 40 | 0.367744887303538 | 0.735489774607077 | 0.632255112696462 |
| 41 | 0.262976227988480 | 0.525952455976959 | 0.73702377201152 |
| Meta Analysis of Goldfeld-Quandt test for Heteroskedasticity | |||
| Description | # significant tests | % significant tests | OK/NOK |
| 1% type I error level | 0 | 0 | OK |
| 5% type I error level | 0 | 0 | OK |
| 10% type I error level | 0 | 0 | OK |