Free Statistics
of Irreproducible Research!
Description of Statistical Computation | |||||||||||||||||||||||||||||||||||||||||
|---|---|---|---|---|---|---|---|---|---|---|---|---|---|---|---|---|---|---|---|---|---|---|---|---|---|---|---|---|---|---|---|---|---|---|---|---|---|---|---|---|---|
| Author's title | |||||||||||||||||||||||||||||||||||||||||
| Author | *The author of this computation has been verified* | ||||||||||||||||||||||||||||||||||||||||
| R Software Module | rwasp_univariatedataseries.wasp | ||||||||||||||||||||||||||||||||||||||||
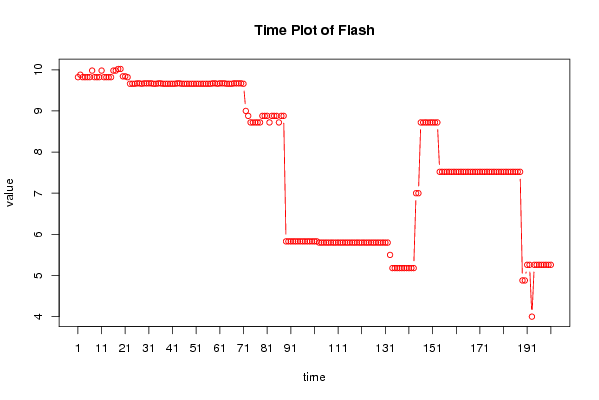
| Title produced by software | Univariate Data Series | ||||||||||||||||||||||||||||||||||||||||
| Date of computation | Tue, 23 Nov 2010 16:43:11 +0000 | ||||||||||||||||||||||||||||||||||||||||
| Cite this page as follows | Statistical Computations at FreeStatistics.org, Office for Research Development and Education, URL https://freestatistics.org/blog/index.php?v=date/2010/Nov/23/t1290530595tgt8384oeu0y25u.htm/, Retrieved Thu, 18 Apr 2024 02:30:21 +0000 | ||||||||||||||||||||||||||||||||||||||||
| Statistical Computations at FreeStatistics.org, Office for Research Development and Education, URL https://freestatistics.org/blog/index.php?pk=99411, Retrieved Thu, 18 Apr 2024 02:30:21 +0000 | |||||||||||||||||||||||||||||||||||||||||
| QR Codes: | |||||||||||||||||||||||||||||||||||||||||
|
| |||||||||||||||||||||||||||||||||||||||||
| Original text written by user: | |||||||||||||||||||||||||||||||||||||||||
| IsPrivate? | No (this computation is public) | ||||||||||||||||||||||||||||||||||||||||
| User-defined keywords | |||||||||||||||||||||||||||||||||||||||||
| Estimated Impact | 101 | ||||||||||||||||||||||||||||||||||||||||
Tree of Dependent Computations | |||||||||||||||||||||||||||||||||||||||||
| Family? (F = Feedback message, R = changed R code, M = changed R Module, P = changed Parameters, D = changed Data) | |||||||||||||||||||||||||||||||||||||||||
| - [Univariate Data Series] [FLA gewone time plot] [2010-11-23 16:43:11] [f76239c595e4d455b3b05a43389f68d5] [Current] | |||||||||||||||||||||||||||||||||||||||||
| Feedback Forum | |||||||||||||||||||||||||||||||||||||||||
Post a new message | |||||||||||||||||||||||||||||||||||||||||
Dataset | |||||||||||||||||||||||||||||||||||||||||
| Dataseries X: | |||||||||||||||||||||||||||||||||||||||||
9.82 9.88 9.82 9.82 9.82 9.82 9.98 9.82 9.82 9.82 9.98 9.82 9.82 9.82 9.82 9.98 9.98 10.02 10.02 9.84 9.84 9.82 9.66 9.66 9.66 9.67 9.67 9.66 9.67 9.67 9.67 9.67 9.66 9.66 9.67 9.67 9.66 9.66 9.66 9.66 9.66 9.66 9.67 9.67 9.66 9.66 9.66 9.66 9.66 9.66 9.66 9.66 9.66 9.66 9.66 9.66 9.66 9.67 9.67 9.66 9.67 9.67 9.67 9.66 9.66 9.66 9.67 9.67 9.67 9.67 9.66 9 8.88 8.72 8.72 8.72 8.72 8.72 8.88 8.88 8.88 8.72 8.88 8.88 8.88 8.72 8.88 8.88 5.83 5.83 5.83 5.83 5.83 5.83 5.83 5.83 5.83 5.83 5.83 5.83 5.83 5.83 5.8 5.8 5.8 5.8 5.8 5.8 5.8 5.8 5.8 5.8 5.8 5.8 5.8 5.8 5.8 5.8 5.8 5.8 5.8 5.8 5.8 5.8 5.8 5.8 5.8 5.8 5.8 5.8 5.8 5.8 5.5 5.18 5.18 5.18 5.18 5.18 5.18 5.18 5.18 5.18 5.18 7 7 8.72 8.72 8.72 8.72 8.72 8.72 8.72 8.72 7.52 7.52 7.52 7.52 7.52 7.52 7.52 7.52 7.52 7.52 7.52 7.52 7.52 7.52 7.52 7.52 7.52 7.52 7.52 7.52 7.52 7.52 7.52 7.52 7.52 7.52 7.52 7.52 7.52 7.52 7.52 7.52 7.52 7.52 7.52 4.88 4.88 5.26 5.26 4 5.26 5.26 5.26 5.26 5.26 5.26 5.26 5.26 | |||||||||||||||||||||||||||||||||||||||||
Tables (Output of Computation) | |||||||||||||||||||||||||||||||||||||||||
| |||||||||||||||||||||||||||||||||||||||||
Figures (Output of Computation) | |||||||||||||||||||||||||||||||||||||||||
Input Parameters & R Code | |||||||||||||||||||||||||||||||||||||||||
| Parameters (Session): | |||||||||||||||||||||||||||||||||||||||||
| par1 = Apollo Oil Corp. ; par3 = Time series of Xycoon Stock Exchange ; par4 = No season ; | |||||||||||||||||||||||||||||||||||||||||
| Parameters (R input): | |||||||||||||||||||||||||||||||||||||||||
| par1 = Flash ; par2 = ; par3 = Time series of Xycoon Stock Exchange ; par4 = No season ; | |||||||||||||||||||||||||||||||||||||||||
| R code (references can be found in the software module): | |||||||||||||||||||||||||||||||||||||||||
if (par4 != 'No season') { | |||||||||||||||||||||||||||||||||||||||||