| Multiple Linear Regression - Estimated Regression Equation |
| Huurprijs[t] = + 261.559850248446 + 27.9706524613068Slaapkamers[t] + 2.24357262516708Bewoonbareopp[t] + 69.8338996357666Terras[t] + 1.16761510821164Garage[t] + 95.1289869483621Nieuwbouw[t] + e[t] |
| Multiple Linear Regression - Ordinary Least Squares | |||||
| Variable | Parameter | S.D. | T-STAT H0: parameter = 0 | 2-tail p-value | 1-tail p-value |
| (Intercept) | 261.559850248446 | 51.839747 | 5.0455 | 9e-06 | 4e-06 |
| Slaapkamers | 27.9706524613068 | 25.349965 | 1.1034 | 0.275999 | 0.137999 |
| Bewoonbareopp | 2.24357262516708 | 0.512831 | 4.3749 | 7.6e-05 | 3.8e-05 |
| Terras | 69.8338996357666 | 29.723355 | 2.3495 | 0.023463 | 0.011731 |
| Garage | 1.16761510821164 | 14.477635 | 0.0806 | 0.936095 | 0.468047 |
| Nieuwbouw | 95.1289869483621 | 24.493785 | 3.8838 | 0.00035 | 0.000175 |
| Multiple Linear Regression - Regression Statistics | |
| Multiple R | 0.790226051322629 |
| R-squared | 0.624457212188954 |
| Adjusted R-squared | 0.580789446164414 |
| F-TEST (value) | 14.3001868205949 |
| F-TEST (DF numerator) | 5 |
| F-TEST (DF denominator) | 43 |
| p-value | 3.0025185782101e-08 |
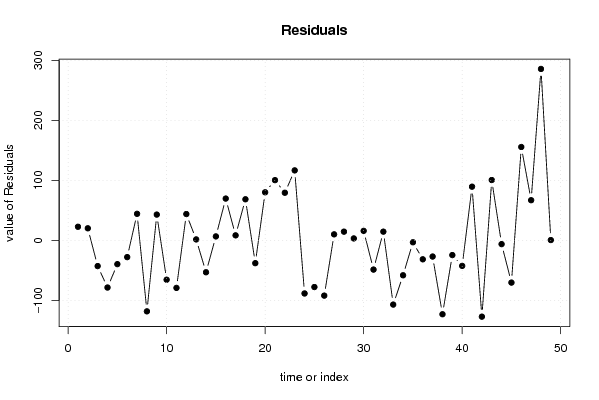
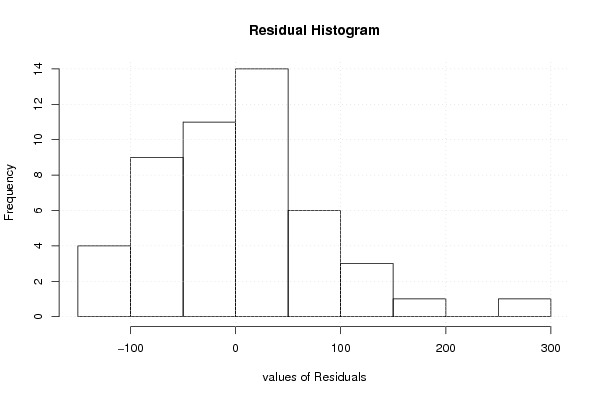
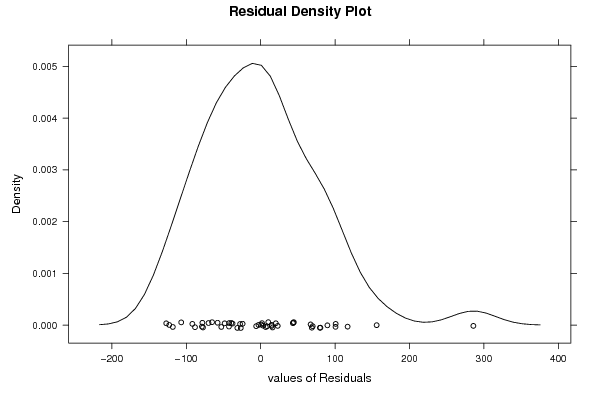
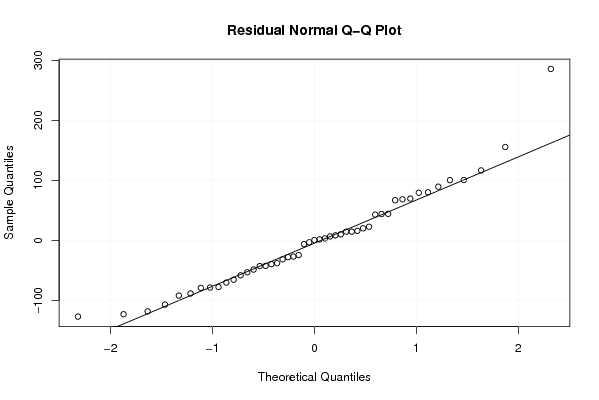
| Multiple Linear Regression - Residual Statistics | |
| Residual Standard Deviation | 83.6759928581479 |
| Sum Squared Residuals | 301071.886574263 |
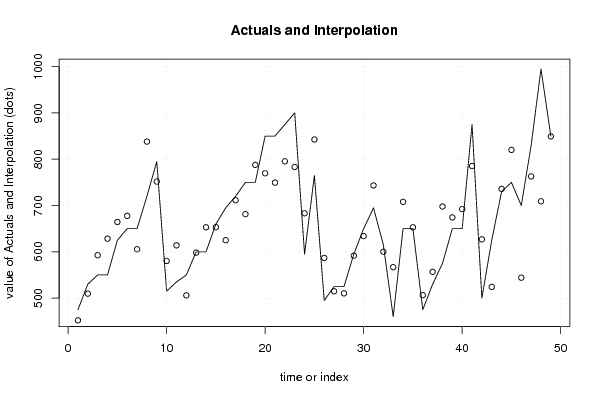
| Multiple Linear Regression - Actuals, Interpolation, and Residuals | |||
| Time or Index | Actuals | Interpolation Forecast | Residuals Prediction Error |
| 1 | 475 | 452.115512681085 | 22.8844873189153 |
| 2 | 530 | 509.683768231714 | 20.3162317682862 |
| 3 | 550 | 592.667778805242 | -42.6677788052421 |
| 4 | 550 | 628.401626701238 | -78.401626701238 |
| 5 | 625 | 664.433926252935 | -39.433926252935 |
| 6 | 650 | 677.74651773598 | -27.7465177359805 |
| 7 | 650 | 605.577387883791 | 44.4226121162094 |
| 8 | 720 | 838.087955082145 | -118.087955082145 |
| 9 | 795 | 751.841601043195 | 43.1583989568052 |
| 10 | 515 | 580.373958162451 | -65.3739581624513 |
| 11 | 535 | 614.027547539957 | -79.0275475399574 |
| 12 | 550 | 505.961255685094 | 44.0387443149056 |
| 13 | 600 | 598.230881572532 | 1.76911842746825 |
| 14 | 600 | 652.961091429166 | -52.9610914291661 |
| 15 | 660 | 653.2160631271 | 6.78393687290036 |
| 16 | 695 | 625.153753074537 | 69.8462469254633 |
| 17 | 720 | 711.457293790187 | 8.54270620981256 |
| 18 | 750 | 681.33472629497 | 68.6652737050302 |
| 19 | 750 | 787.830420637124 | -37.8304206371243 |
| 20 | 850 | 769.73299536783 | 80.2670046321694 |
| 21 | 850 | 749.449184150071 | 100.550815849929 |
| 22 | 875 | 795.46007520397 | 79.5399247960297 |
| 23 | 900 | 783.194431118833 | 116.805568881167 |
| 24 | 595 | 683.30962050327 | -88.30962050327 |
| 25 | 765 | 842.575100332479 | -77.575100332479 |
| 26 | 495 | 586.864174178739 | -91.8641741787393 |
| 27 | 525 | 514.786701917806 | 10.2132980821943 |
| 28 | 525 | 510.299556667472 | 14.7004433325284 |
| 29 | 595 | 591.591821288287 | 3.40817871171328 |
| 30 | 650 | 633.979199307248 | 16.0208006927520 |
| 31 | 695 | 743.483098978284 | -48.4830989782842 |
| 32 | 615 | 600.282963533368 | 14.7170364666322 |
| 33 | 460 | 566.820864820193 | -106.820864820193 |
| 34 | 650 | 707.988919380108 | -57.9889193801079 |
| 35 | 650 | 652.975561267886 | -2.97556126788644 |
| 36 | 475 | 506.364238089591 | -31.3642380895913 |
| 37 | 530 | 556.770616802569 | -26.7706168025689 |
| 38 | 575 | 697.938671362484 | -122.938671362484 |
| 39 | 650 | 674.335330002602 | -24.3353300026018 |
| 40 | 650 | 692.312087561592 | -42.312087561592 |
| 41 | 875 | 785.346346152744 | 89.653653847256 |
| 42 | 500 | 626.937156618506 | -126.937156618506 |
| 43 | 625 | 524.284642533274 | 100.715357466726 |
| 44 | 730 | 736.079405990325 | -6.07940599032447 |
| 45 | 750 | 820.167550638462 | -70.1675506384617 |
| 46 | 700 | 544.193647904191 | 155.806352095809 |
| 47 | 830 | 762.910619901073 | 67.0893800989268 |
| 48 | 995 | 709.15653448832 | 285.843465511680 |
| 49 | 850 | 849.30581820798 | 0.694181792019827 |
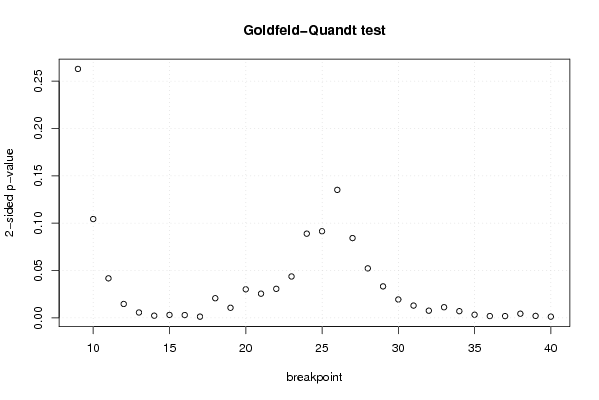
| Goldfeld-Quandt test for Heteroskedasticity | |||
| p-values | Alternative Hypothesis | ||
| breakpoint index | greater | 2-sided | less |
| 9 | 0.131432074879718 | 0.262864149759436 | 0.868567925120282 |
| 10 | 0.0521740857375943 | 0.104348171475189 | 0.947825914262406 |
| 11 | 0.0208800143619188 | 0.0417600287238375 | 0.979119985638081 |
| 12 | 0.00733680272421671 | 0.0146736054484334 | 0.992663197275783 |
| 13 | 0.00283641095428756 | 0.00567282190857512 | 0.997163589045712 |
| 14 | 0.00114805137833208 | 0.00229610275666416 | 0.998851948621668 |
| 15 | 0.00155697540681490 | 0.00311395081362981 | 0.998443024593185 |
| 16 | 0.00147040304668746 | 0.00294080609337492 | 0.998529596953313 |
| 17 | 0.000639813896820544 | 0.00127962779364109 | 0.99936018610318 |
| 18 | 0.0103591788863154 | 0.0207183577726309 | 0.989640821113685 |
| 19 | 0.00533349104647573 | 0.0106669820929515 | 0.994666508953524 |
| 20 | 0.0150825845346670 | 0.0301651690693339 | 0.984917415465333 |
| 21 | 0.0127619546247978 | 0.0255239092495955 | 0.987238045375202 |
| 22 | 0.0153245802942793 | 0.0306491605885586 | 0.98467541970572 |
| 23 | 0.0218508899372730 | 0.0437017798745461 | 0.978149110062727 |
| 24 | 0.0444581455244869 | 0.0889162910489738 | 0.955541854475513 |
| 25 | 0.0457435139772128 | 0.0914870279544257 | 0.954256486022787 |
| 26 | 0.0675847334125728 | 0.135169466825146 | 0.932415266587427 |
| 27 | 0.0421303234220369 | 0.0842606468440738 | 0.957869676577963 |
| 28 | 0.0261464375575538 | 0.0522928751151075 | 0.973853562442446 |
| 29 | 0.0166182163848120 | 0.0332364327696241 | 0.983381783615188 |
| 30 | 0.00970412988469023 | 0.0194082597693805 | 0.99029587011531 |
| 31 | 0.00649212736514192 | 0.0129842547302838 | 0.993507872634858 |
| 32 | 0.00378867915355951 | 0.00757735830711903 | 0.99621132084644 |
| 33 | 0.00561275891055144 | 0.0112255178211029 | 0.994387241089449 |
| 34 | 0.00353252501914917 | 0.00706505003829833 | 0.99646747498085 |
| 35 | 0.00164803558313975 | 0.00329607116627949 | 0.99835196441686 |
| 36 | 0.00095994076767919 | 0.00191988153535838 | 0.99904005923232 |
| 37 | 0.000923891192377077 | 0.00184778238475415 | 0.999076108807623 |
| 38 | 0.00219216225424300 | 0.00438432450848601 | 0.997807837745757 |
| 39 | 0.00103804287466656 | 0.00207608574933312 | 0.998961957125333 |
| 40 | 0.000646847648267537 | 0.00129369529653507 | 0.999353152351732 |
| Meta Analysis of Goldfeld-Quandt test for Heteroskedasticity | |||
| Description | # significant tests | % significant tests | OK/NOK |
| 1% type I error level | 13 | 0.40625 | NOK |
| 5% type I error level | 25 | 0.78125 | NOK |
| 10% type I error level | 29 | 0.90625 | NOK |