Free Statistics

of Irreproducible Research!

Author's title

Author*Unverified author*
R Software Modulerwasp_autocorrelation.wasp
Title produced by software(Partial) Autocorrelation Function
Date of computationTue, 23 Nov 2010 15:47:34 +0000
Cite this page as followsStatistical Computations at FreeStatistics.org, Office for Research Development and Education, URL https://freestatistics.org/blog/index.php?v=date/2010/Nov/23/t1290527161bhzfp6qiwsgdmns.htm/, Retrieved Fri, 26 Apr 2024 09:38:00 +0000
Statistical Computations at FreeStatistics.org, Office for Research Development and Education, URL https://freestatistics.org/blog/index.php?pk=99315, Retrieved Fri, 26 Apr 2024 09:38:00 +0000
QR Codes:

Original text written by user:
IsPrivate?No (this computation is public)
User-defined keywordsKDGP2W12
Estimated Impact104
Family? (F = Feedback message, R = changed R code, M = changed R Module, P = changed Parameters, D = changed Data)
-       [(Partial) Autocorrelation Function] [] [2010-11-23 15:47:34] [9c46b2659272a99de8fec46bf5966107] [Current]
Feedback Forum

Post a new message
Dataseries X:
98,6
100,1
98,8
98,3
102,8
103,6
105,2
100,1
98,2
98,4
97,4
98,4
100,3
101,1
104,1
107,3
110,1
112,6
114,3
115,3
109,9
108,2
103,2
101,8
105,6
108,2
109,8
114,6
117,2
116,5
116,1
112,1
106,8
106,9
104,5
103
105,9
107,7
107,1
112,5
114,5
114,6
113,1
112,8
111,9
112
112,4
110
112,3
109,6
111,9
110,8
110,4
110,8
114
108,4
110,5
105,1
102,3
104,3
103,4
102,4
104,5
107,3
110,1
111,8
111,8
105,7
106
106,4
107,1
111,5


Summary of computational transaction
Raw Inputview raw input (R code)
Raw Outputview raw output of R engine
Computing time1 seconds
R Server'Gwilym Jenkins' @ 72.249.127.135

\begin{tabular}{lllllllll}
\hline
Summary of computational transaction \tabularnewline
Raw Input & view raw input (R code)  \tabularnewline
Raw Output & view raw output of R engine  \tabularnewline
Computing time & 1 seconds \tabularnewline
R Server & 'Gwilym Jenkins' @ 72.249.127.135 \tabularnewline
\hline
\end{tabular}
%Source: https://freestatistics.org/blog/index.php?pk=99315&T=0

[TABLE]
[ROW][C]Summary of computational transaction[/C][/ROW]
[ROW][C]Raw Input[/C][C]view raw input (R code) [/C][/ROW]
[ROW][C]Raw Output[/C][C]view raw output of R engine [/C][/ROW]
[ROW][C]Computing time[/C][C]1 seconds[/C][/ROW]
[ROW][C]R Server[/C][C]'Gwilym Jenkins' @ 72.249.127.135[/C][/ROW]
[/TABLE]
Source: https://freestatistics.org/blog/index.php?pk=99315&T=0

Globally Unique Identifier (entire table): ba.freestatistics.org/blog/index.php?pk=99315&T=0

As an alternative you can also use a QR Code:  

The GUIDs for individual cells are displayed in the table below:

Summary of computational transaction
Raw Inputview raw input (R code)
Raw Outputview raw output of R engine
Computing time1 seconds
R Server'Gwilym Jenkins' @ 72.249.127.135


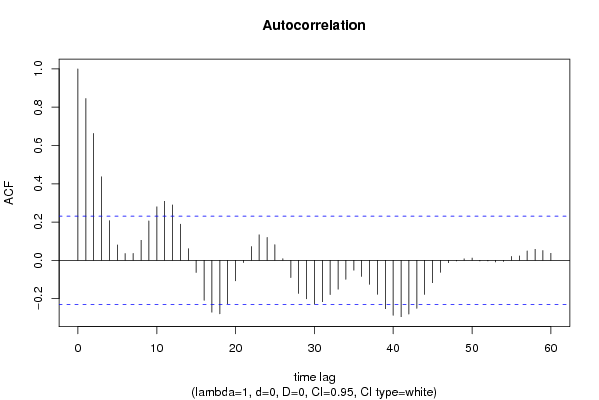
Autocorrelation Function
Time lag kACF(k)T-STATP-value
10.8453717.17320
20.6631965.62740
30.4364423.70330.000207
40.2067461.75430.041817
50.0804640.68280.248476
60.0354880.30110.382094
70.0357450.30330.381265
80.1041550.88380.189878
90.2058391.74660.042485
100.2794562.37130.010203
110.3085832.61840.005382
120.2894912.45640.008223
130.1887441.60150.056818
140.060490.51330.304666
15-0.063412-0.53810.296094
16-0.20934-1.77630.039953
17-0.270849-2.29820.012228
18-0.279931-2.37530.0101
19-0.226501-1.92190.029287
20-0.107038-0.90820.183389
21-0.011537-0.09790.461145
220.0720680.61150.271392
230.1332441.13060.130985
240.1197821.01640.156425
250.081640.69270.245351
260.0086580.07350.470821
27-0.09037-0.76680.222849
28-0.17352-1.47240.07264
29-0.201106-1.70640.046118
30-0.229348-1.94610.027774
31-0.216316-1.83550.035281
32-0.178799-1.51720.066802
33-0.151175-1.28280.101844
34-0.09963-0.84540.200347
35-0.051527-0.43720.33163
36-0.084467-0.71670.237931
37-0.125747-1.0670.144768
38-0.17754-1.50650.06816
39-0.253204-2.14850.017519
40-0.287299-2.43780.008623
41-0.294489-2.49880.007372
42-0.280965-2.38410.00988
43-0.250681-2.12710.018419
44-0.178371-1.51350.067262
45-0.117339-0.99570.161376
46-0.062494-0.53030.298776
47-0.012283-0.10420.458639
48-0.003181-0.0270.489269
490.0076610.0650.474174
500.0119950.10180.459608
51-0.003565-0.03020.487976
52-0.003283-0.02790.488927
53-0.00888-0.07540.470072
54-0.005932-0.05030.479997
550.020230.17170.432094
560.0230650.19570.422693
570.0489810.41560.339463
580.0573690.48680.313941
590.0509160.4320.333502
600.0364140.3090.379115

\begin{tabular}{lllllllll}
\hline
Autocorrelation Function \tabularnewline
Time lag k & ACF(k) & T-STAT & P-value \tabularnewline
1 & 0.845371 & 7.1732 & 0 \tabularnewline
2 & 0.663196 & 5.6274 & 0 \tabularnewline
3 & 0.436442 & 3.7033 & 0.000207 \tabularnewline
4 & 0.206746 & 1.7543 & 0.041817 \tabularnewline
5 & 0.080464 & 0.6828 & 0.248476 \tabularnewline
6 & 0.035488 & 0.3011 & 0.382094 \tabularnewline
7 & 0.035745 & 0.3033 & 0.381265 \tabularnewline
8 & 0.104155 & 0.8838 & 0.189878 \tabularnewline
9 & 0.205839 & 1.7466 & 0.042485 \tabularnewline
10 & 0.279456 & 2.3713 & 0.010203 \tabularnewline
11 & 0.308583 & 2.6184 & 0.005382 \tabularnewline
12 & 0.289491 & 2.4564 & 0.008223 \tabularnewline
13 & 0.188744 & 1.6015 & 0.056818 \tabularnewline
14 & 0.06049 & 0.5133 & 0.304666 \tabularnewline
15 & -0.063412 & -0.5381 & 0.296094 \tabularnewline
16 & -0.20934 & -1.7763 & 0.039953 \tabularnewline
17 & -0.270849 & -2.2982 & 0.012228 \tabularnewline
18 & -0.279931 & -2.3753 & 0.0101 \tabularnewline
19 & -0.226501 & -1.9219 & 0.029287 \tabularnewline
20 & -0.107038 & -0.9082 & 0.183389 \tabularnewline
21 & -0.011537 & -0.0979 & 0.461145 \tabularnewline
22 & 0.072068 & 0.6115 & 0.271392 \tabularnewline
23 & 0.133244 & 1.1306 & 0.130985 \tabularnewline
24 & 0.119782 & 1.0164 & 0.156425 \tabularnewline
25 & 0.08164 & 0.6927 & 0.245351 \tabularnewline
26 & 0.008658 & 0.0735 & 0.470821 \tabularnewline
27 & -0.09037 & -0.7668 & 0.222849 \tabularnewline
28 & -0.17352 & -1.4724 & 0.07264 \tabularnewline
29 & -0.201106 & -1.7064 & 0.046118 \tabularnewline
30 & -0.229348 & -1.9461 & 0.027774 \tabularnewline
31 & -0.216316 & -1.8355 & 0.035281 \tabularnewline
32 & -0.178799 & -1.5172 & 0.066802 \tabularnewline
33 & -0.151175 & -1.2828 & 0.101844 \tabularnewline
34 & -0.09963 & -0.8454 & 0.200347 \tabularnewline
35 & -0.051527 & -0.4372 & 0.33163 \tabularnewline
36 & -0.084467 & -0.7167 & 0.237931 \tabularnewline
37 & -0.125747 & -1.067 & 0.144768 \tabularnewline
38 & -0.17754 & -1.5065 & 0.06816 \tabularnewline
39 & -0.253204 & -2.1485 & 0.017519 \tabularnewline
40 & -0.287299 & -2.4378 & 0.008623 \tabularnewline
41 & -0.294489 & -2.4988 & 0.007372 \tabularnewline
42 & -0.280965 & -2.3841 & 0.00988 \tabularnewline
43 & -0.250681 & -2.1271 & 0.018419 \tabularnewline
44 & -0.178371 & -1.5135 & 0.067262 \tabularnewline
45 & -0.117339 & -0.9957 & 0.161376 \tabularnewline
46 & -0.062494 & -0.5303 & 0.298776 \tabularnewline
47 & -0.012283 & -0.1042 & 0.458639 \tabularnewline
48 & -0.003181 & -0.027 & 0.489269 \tabularnewline
49 & 0.007661 & 0.065 & 0.474174 \tabularnewline
50 & 0.011995 & 0.1018 & 0.459608 \tabularnewline
51 & -0.003565 & -0.0302 & 0.487976 \tabularnewline
52 & -0.003283 & -0.0279 & 0.488927 \tabularnewline
53 & -0.00888 & -0.0754 & 0.470072 \tabularnewline
54 & -0.005932 & -0.0503 & 0.479997 \tabularnewline
55 & 0.02023 & 0.1717 & 0.432094 \tabularnewline
56 & 0.023065 & 0.1957 & 0.422693 \tabularnewline
57 & 0.048981 & 0.4156 & 0.339463 \tabularnewline
58 & 0.057369 & 0.4868 & 0.313941 \tabularnewline
59 & 0.050916 & 0.432 & 0.333502 \tabularnewline
60 & 0.036414 & 0.309 & 0.379115 \tabularnewline
\hline
\end{tabular}
%Source: https://freestatistics.org/blog/index.php?pk=99315&T=1

[TABLE]
[ROW][C]Autocorrelation Function[/C][/ROW]
[ROW][C]Time lag k[/C][C]ACF(k)[/C][C]T-STAT[/C][C]P-value[/C][/ROW]
[ROW][C]1[/C][C]0.845371[/C][C]7.1732[/C][C]0[/C][/ROW]
[ROW][C]2[/C][C]0.663196[/C][C]5.6274[/C][C]0[/C][/ROW]
[ROW][C]3[/C][C]0.436442[/C][C]3.7033[/C][C]0.000207[/C][/ROW]
[ROW][C]4[/C][C]0.206746[/C][C]1.7543[/C][C]0.041817[/C][/ROW]
[ROW][C]5[/C][C]0.080464[/C][C]0.6828[/C][C]0.248476[/C][/ROW]
[ROW][C]6[/C][C]0.035488[/C][C]0.3011[/C][C]0.382094[/C][/ROW]
[ROW][C]7[/C][C]0.035745[/C][C]0.3033[/C][C]0.381265[/C][/ROW]
[ROW][C]8[/C][C]0.104155[/C][C]0.8838[/C][C]0.189878[/C][/ROW]
[ROW][C]9[/C][C]0.205839[/C][C]1.7466[/C][C]0.042485[/C][/ROW]
[ROW][C]10[/C][C]0.279456[/C][C]2.3713[/C][C]0.010203[/C][/ROW]
[ROW][C]11[/C][C]0.308583[/C][C]2.6184[/C][C]0.005382[/C][/ROW]
[ROW][C]12[/C][C]0.289491[/C][C]2.4564[/C][C]0.008223[/C][/ROW]
[ROW][C]13[/C][C]0.188744[/C][C]1.6015[/C][C]0.056818[/C][/ROW]
[ROW][C]14[/C][C]0.06049[/C][C]0.5133[/C][C]0.304666[/C][/ROW]
[ROW][C]15[/C][C]-0.063412[/C][C]-0.5381[/C][C]0.296094[/C][/ROW]
[ROW][C]16[/C][C]-0.20934[/C][C]-1.7763[/C][C]0.039953[/C][/ROW]
[ROW][C]17[/C][C]-0.270849[/C][C]-2.2982[/C][C]0.012228[/C][/ROW]
[ROW][C]18[/C][C]-0.279931[/C][C]-2.3753[/C][C]0.0101[/C][/ROW]
[ROW][C]19[/C][C]-0.226501[/C][C]-1.9219[/C][C]0.029287[/C][/ROW]
[ROW][C]20[/C][C]-0.107038[/C][C]-0.9082[/C][C]0.183389[/C][/ROW]
[ROW][C]21[/C][C]-0.011537[/C][C]-0.0979[/C][C]0.461145[/C][/ROW]
[ROW][C]22[/C][C]0.072068[/C][C]0.6115[/C][C]0.271392[/C][/ROW]
[ROW][C]23[/C][C]0.133244[/C][C]1.1306[/C][C]0.130985[/C][/ROW]
[ROW][C]24[/C][C]0.119782[/C][C]1.0164[/C][C]0.156425[/C][/ROW]
[ROW][C]25[/C][C]0.08164[/C][C]0.6927[/C][C]0.245351[/C][/ROW]
[ROW][C]26[/C][C]0.008658[/C][C]0.0735[/C][C]0.470821[/C][/ROW]
[ROW][C]27[/C][C]-0.09037[/C][C]-0.7668[/C][C]0.222849[/C][/ROW]
[ROW][C]28[/C][C]-0.17352[/C][C]-1.4724[/C][C]0.07264[/C][/ROW]
[ROW][C]29[/C][C]-0.201106[/C][C]-1.7064[/C][C]0.046118[/C][/ROW]
[ROW][C]30[/C][C]-0.229348[/C][C]-1.9461[/C][C]0.027774[/C][/ROW]
[ROW][C]31[/C][C]-0.216316[/C][C]-1.8355[/C][C]0.035281[/C][/ROW]
[ROW][C]32[/C][C]-0.178799[/C][C]-1.5172[/C][C]0.066802[/C][/ROW]
[ROW][C]33[/C][C]-0.151175[/C][C]-1.2828[/C][C]0.101844[/C][/ROW]
[ROW][C]34[/C][C]-0.09963[/C][C]-0.8454[/C][C]0.200347[/C][/ROW]
[ROW][C]35[/C][C]-0.051527[/C][C]-0.4372[/C][C]0.33163[/C][/ROW]
[ROW][C]36[/C][C]-0.084467[/C][C]-0.7167[/C][C]0.237931[/C][/ROW]
[ROW][C]37[/C][C]-0.125747[/C][C]-1.067[/C][C]0.144768[/C][/ROW]
[ROW][C]38[/C][C]-0.17754[/C][C]-1.5065[/C][C]0.06816[/C][/ROW]
[ROW][C]39[/C][C]-0.253204[/C][C]-2.1485[/C][C]0.017519[/C][/ROW]
[ROW][C]40[/C][C]-0.287299[/C][C]-2.4378[/C][C]0.008623[/C][/ROW]
[ROW][C]41[/C][C]-0.294489[/C][C]-2.4988[/C][C]0.007372[/C][/ROW]
[ROW][C]42[/C][C]-0.280965[/C][C]-2.3841[/C][C]0.00988[/C][/ROW]
[ROW][C]43[/C][C]-0.250681[/C][C]-2.1271[/C][C]0.018419[/C][/ROW]
[ROW][C]44[/C][C]-0.178371[/C][C]-1.5135[/C][C]0.067262[/C][/ROW]
[ROW][C]45[/C][C]-0.117339[/C][C]-0.9957[/C][C]0.161376[/C][/ROW]
[ROW][C]46[/C][C]-0.062494[/C][C]-0.5303[/C][C]0.298776[/C][/ROW]
[ROW][C]47[/C][C]-0.012283[/C][C]-0.1042[/C][C]0.458639[/C][/ROW]
[ROW][C]48[/C][C]-0.003181[/C][C]-0.027[/C][C]0.489269[/C][/ROW]
[ROW][C]49[/C][C]0.007661[/C][C]0.065[/C][C]0.474174[/C][/ROW]
[ROW][C]50[/C][C]0.011995[/C][C]0.1018[/C][C]0.459608[/C][/ROW]
[ROW][C]51[/C][C]-0.003565[/C][C]-0.0302[/C][C]0.487976[/C][/ROW]
[ROW][C]52[/C][C]-0.003283[/C][C]-0.0279[/C][C]0.488927[/C][/ROW]
[ROW][C]53[/C][C]-0.00888[/C][C]-0.0754[/C][C]0.470072[/C][/ROW]
[ROW][C]54[/C][C]-0.005932[/C][C]-0.0503[/C][C]0.479997[/C][/ROW]
[ROW][C]55[/C][C]0.02023[/C][C]0.1717[/C][C]0.432094[/C][/ROW]
[ROW][C]56[/C][C]0.023065[/C][C]0.1957[/C][C]0.422693[/C][/ROW]
[ROW][C]57[/C][C]0.048981[/C][C]0.4156[/C][C]0.339463[/C][/ROW]
[ROW][C]58[/C][C]0.057369[/C][C]0.4868[/C][C]0.313941[/C][/ROW]
[ROW][C]59[/C][C]0.050916[/C][C]0.432[/C][C]0.333502[/C][/ROW]
[ROW][C]60[/C][C]0.036414[/C][C]0.309[/C][C]0.379115[/C][/ROW]
[/TABLE]
Source: https://freestatistics.org/blog/index.php?pk=99315&T=1

Globally Unique Identifier (entire table): ba.freestatistics.org/blog/index.php?pk=99315&T=1

As an alternative you can also use a QR Code:  

The GUIDs for individual cells are displayed in the table below:

Autocorrelation Function
Time lag kACF(k)T-STATP-value
10.8453717.17320
20.6631965.62740
30.4364423.70330.000207
40.2067461.75430.041817
50.0804640.68280.248476
60.0354880.30110.382094
70.0357450.30330.381265
80.1041550.88380.189878
90.2058391.74660.042485
100.2794562.37130.010203
110.3085832.61840.005382
120.2894912.45640.008223
130.1887441.60150.056818
140.060490.51330.304666
15-0.063412-0.53810.296094
16-0.20934-1.77630.039953
17-0.270849-2.29820.012228
18-0.279931-2.37530.0101
19-0.226501-1.92190.029287
20-0.107038-0.90820.183389
21-0.011537-0.09790.461145
220.0720680.61150.271392
230.1332441.13060.130985
240.1197821.01640.156425
250.081640.69270.245351
260.0086580.07350.470821
27-0.09037-0.76680.222849
28-0.17352-1.47240.07264
29-0.201106-1.70640.046118
30-0.229348-1.94610.027774
31-0.216316-1.83550.035281
32-0.178799-1.51720.066802
33-0.151175-1.28280.101844
34-0.09963-0.84540.200347
35-0.051527-0.43720.33163
36-0.084467-0.71670.237931
37-0.125747-1.0670.144768
38-0.17754-1.50650.06816
39-0.253204-2.14850.017519
40-0.287299-2.43780.008623
41-0.294489-2.49880.007372
42-0.280965-2.38410.00988
43-0.250681-2.12710.018419
44-0.178371-1.51350.067262
45-0.117339-0.99570.161376
46-0.062494-0.53030.298776
47-0.012283-0.10420.458639
48-0.003181-0.0270.489269
490.0076610.0650.474174
500.0119950.10180.459608
51-0.003565-0.03020.487976
52-0.003283-0.02790.488927
53-0.00888-0.07540.470072
54-0.005932-0.05030.479997
550.020230.17170.432094
560.0230650.19570.422693
570.0489810.41560.339463
580.0573690.48680.313941
590.0509160.4320.333502
600.0364140.3090.379115


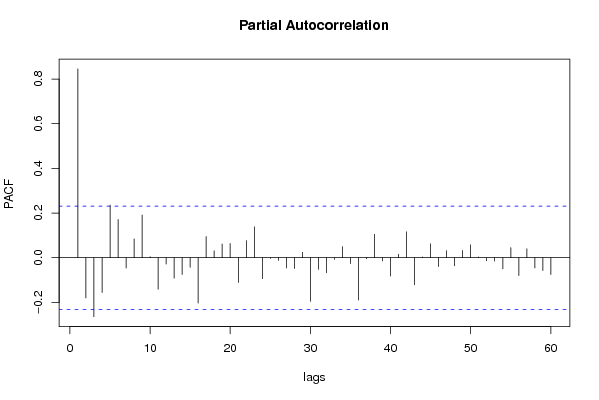
Partial Autocorrelation Function
Time lag kPACF(k)T-STATP-value
10.8453717.17320
2-0.180325-1.53010.065186
3-0.263926-2.23950.014107
4-0.15541-1.31870.095725
50.23582.00080.024591
60.1706891.44830.07593
7-0.046161-0.39170.348223
80.0840750.71340.238953
90.1912551.62290.054496
100.0047830.04060.48387
11-0.140689-1.19380.118241
12-0.028376-0.24080.405205
13-0.091738-0.77840.219435
14-0.074628-0.63320.264291
15-0.043132-0.3660.357723
16-0.203087-1.72330.044568
170.094510.80190.212612
180.030850.26180.397123
190.0610790.51830.302928
200.0635470.53920.2957
21-0.110816-0.94030.175103
220.0765840.64980.258932
230.1386921.17680.121567
24-0.093813-0.7960.214317
25-0.003201-0.02720.489205
26-0.012399-0.10520.458253
27-0.045734-0.38810.349555
28-0.048449-0.41110.341109
290.0240690.20420.419373
30-0.195003-1.65470.051174
31-0.051757-0.43920.330927
32-0.067391-0.57180.284609
33-0.00714-0.06060.475928
340.0491410.4170.33897
35-0.026167-0.2220.412458
36-0.189475-1.60780.056133
37-0.004694-0.03980.484171
380.1048250.88950.188357
39-0.014166-0.12020.452328
40-0.082109-0.69670.244111
410.0160370.13610.446069
420.1162940.98680.163527
43-0.12116-1.02810.153677
440.0036010.03060.487855
450.0621970.52780.299644
46-0.039574-0.33580.369001
470.0313250.26580.395574
48-0.036086-0.30620.380169
490.0328430.27870.390644
500.0579790.4920.312118
510.0032570.02760.489014
52-0.013872-0.11770.453313
53-0.014995-0.12720.449553
54-0.049816-0.42270.336885
550.0452420.38390.351095
56-0.079796-0.67710.250259
570.0397920.33770.368305
58-0.045505-0.38610.350272
59-0.057518-0.48810.313495
60-0.075502-0.64070.261891

\begin{tabular}{lllllllll}
\hline
Partial Autocorrelation Function \tabularnewline
Time lag k & PACF(k) & T-STAT & P-value \tabularnewline
1 & 0.845371 & 7.1732 & 0 \tabularnewline
2 & -0.180325 & -1.5301 & 0.065186 \tabularnewline
3 & -0.263926 & -2.2395 & 0.014107 \tabularnewline
4 & -0.15541 & -1.3187 & 0.095725 \tabularnewline
5 & 0.2358 & 2.0008 & 0.024591 \tabularnewline
6 & 0.170689 & 1.4483 & 0.07593 \tabularnewline
7 & -0.046161 & -0.3917 & 0.348223 \tabularnewline
8 & 0.084075 & 0.7134 & 0.238953 \tabularnewline
9 & 0.191255 & 1.6229 & 0.054496 \tabularnewline
10 & 0.004783 & 0.0406 & 0.48387 \tabularnewline
11 & -0.140689 & -1.1938 & 0.118241 \tabularnewline
12 & -0.028376 & -0.2408 & 0.405205 \tabularnewline
13 & -0.091738 & -0.7784 & 0.219435 \tabularnewline
14 & -0.074628 & -0.6332 & 0.264291 \tabularnewline
15 & -0.043132 & -0.366 & 0.357723 \tabularnewline
16 & -0.203087 & -1.7233 & 0.044568 \tabularnewline
17 & 0.09451 & 0.8019 & 0.212612 \tabularnewline
18 & 0.03085 & 0.2618 & 0.397123 \tabularnewline
19 & 0.061079 & 0.5183 & 0.302928 \tabularnewline
20 & 0.063547 & 0.5392 & 0.2957 \tabularnewline
21 & -0.110816 & -0.9403 & 0.175103 \tabularnewline
22 & 0.076584 & 0.6498 & 0.258932 \tabularnewline
23 & 0.138692 & 1.1768 & 0.121567 \tabularnewline
24 & -0.093813 & -0.796 & 0.214317 \tabularnewline
25 & -0.003201 & -0.0272 & 0.489205 \tabularnewline
26 & -0.012399 & -0.1052 & 0.458253 \tabularnewline
27 & -0.045734 & -0.3881 & 0.349555 \tabularnewline
28 & -0.048449 & -0.4111 & 0.341109 \tabularnewline
29 & 0.024069 & 0.2042 & 0.419373 \tabularnewline
30 & -0.195003 & -1.6547 & 0.051174 \tabularnewline
31 & -0.051757 & -0.4392 & 0.330927 \tabularnewline
32 & -0.067391 & -0.5718 & 0.284609 \tabularnewline
33 & -0.00714 & -0.0606 & 0.475928 \tabularnewline
34 & 0.049141 & 0.417 & 0.33897 \tabularnewline
35 & -0.026167 & -0.222 & 0.412458 \tabularnewline
36 & -0.189475 & -1.6078 & 0.056133 \tabularnewline
37 & -0.004694 & -0.0398 & 0.484171 \tabularnewline
38 & 0.104825 & 0.8895 & 0.188357 \tabularnewline
39 & -0.014166 & -0.1202 & 0.452328 \tabularnewline
40 & -0.082109 & -0.6967 & 0.244111 \tabularnewline
41 & 0.016037 & 0.1361 & 0.446069 \tabularnewline
42 & 0.116294 & 0.9868 & 0.163527 \tabularnewline
43 & -0.12116 & -1.0281 & 0.153677 \tabularnewline
44 & 0.003601 & 0.0306 & 0.487855 \tabularnewline
45 & 0.062197 & 0.5278 & 0.299644 \tabularnewline
46 & -0.039574 & -0.3358 & 0.369001 \tabularnewline
47 & 0.031325 & 0.2658 & 0.395574 \tabularnewline
48 & -0.036086 & -0.3062 & 0.380169 \tabularnewline
49 & 0.032843 & 0.2787 & 0.390644 \tabularnewline
50 & 0.057979 & 0.492 & 0.312118 \tabularnewline
51 & 0.003257 & 0.0276 & 0.489014 \tabularnewline
52 & -0.013872 & -0.1177 & 0.453313 \tabularnewline
53 & -0.014995 & -0.1272 & 0.449553 \tabularnewline
54 & -0.049816 & -0.4227 & 0.336885 \tabularnewline
55 & 0.045242 & 0.3839 & 0.351095 \tabularnewline
56 & -0.079796 & -0.6771 & 0.250259 \tabularnewline
57 & 0.039792 & 0.3377 & 0.368305 \tabularnewline
58 & -0.045505 & -0.3861 & 0.350272 \tabularnewline
59 & -0.057518 & -0.4881 & 0.313495 \tabularnewline
60 & -0.075502 & -0.6407 & 0.261891 \tabularnewline
\hline
\end{tabular}
%Source: https://freestatistics.org/blog/index.php?pk=99315&T=2

[TABLE]
[ROW][C]Partial Autocorrelation Function[/C][/ROW]
[ROW][C]Time lag k[/C][C]PACF(k)[/C][C]T-STAT[/C][C]P-value[/C][/ROW]
[ROW][C]1[/C][C]0.845371[/C][C]7.1732[/C][C]0[/C][/ROW]
[ROW][C]2[/C][C]-0.180325[/C][C]-1.5301[/C][C]0.065186[/C][/ROW]
[ROW][C]3[/C][C]-0.263926[/C][C]-2.2395[/C][C]0.014107[/C][/ROW]
[ROW][C]4[/C][C]-0.15541[/C][C]-1.3187[/C][C]0.095725[/C][/ROW]
[ROW][C]5[/C][C]0.2358[/C][C]2.0008[/C][C]0.024591[/C][/ROW]
[ROW][C]6[/C][C]0.170689[/C][C]1.4483[/C][C]0.07593[/C][/ROW]
[ROW][C]7[/C][C]-0.046161[/C][C]-0.3917[/C][C]0.348223[/C][/ROW]
[ROW][C]8[/C][C]0.084075[/C][C]0.7134[/C][C]0.238953[/C][/ROW]
[ROW][C]9[/C][C]0.191255[/C][C]1.6229[/C][C]0.054496[/C][/ROW]
[ROW][C]10[/C][C]0.004783[/C][C]0.0406[/C][C]0.48387[/C][/ROW]
[ROW][C]11[/C][C]-0.140689[/C][C]-1.1938[/C][C]0.118241[/C][/ROW]
[ROW][C]12[/C][C]-0.028376[/C][C]-0.2408[/C][C]0.405205[/C][/ROW]
[ROW][C]13[/C][C]-0.091738[/C][C]-0.7784[/C][C]0.219435[/C][/ROW]
[ROW][C]14[/C][C]-0.074628[/C][C]-0.6332[/C][C]0.264291[/C][/ROW]
[ROW][C]15[/C][C]-0.043132[/C][C]-0.366[/C][C]0.357723[/C][/ROW]
[ROW][C]16[/C][C]-0.203087[/C][C]-1.7233[/C][C]0.044568[/C][/ROW]
[ROW][C]17[/C][C]0.09451[/C][C]0.8019[/C][C]0.212612[/C][/ROW]
[ROW][C]18[/C][C]0.03085[/C][C]0.2618[/C][C]0.397123[/C][/ROW]
[ROW][C]19[/C][C]0.061079[/C][C]0.5183[/C][C]0.302928[/C][/ROW]
[ROW][C]20[/C][C]0.063547[/C][C]0.5392[/C][C]0.2957[/C][/ROW]
[ROW][C]21[/C][C]-0.110816[/C][C]-0.9403[/C][C]0.175103[/C][/ROW]
[ROW][C]22[/C][C]0.076584[/C][C]0.6498[/C][C]0.258932[/C][/ROW]
[ROW][C]23[/C][C]0.138692[/C][C]1.1768[/C][C]0.121567[/C][/ROW]
[ROW][C]24[/C][C]-0.093813[/C][C]-0.796[/C][C]0.214317[/C][/ROW]
[ROW][C]25[/C][C]-0.003201[/C][C]-0.0272[/C][C]0.489205[/C][/ROW]
[ROW][C]26[/C][C]-0.012399[/C][C]-0.1052[/C][C]0.458253[/C][/ROW]
[ROW][C]27[/C][C]-0.045734[/C][C]-0.3881[/C][C]0.349555[/C][/ROW]
[ROW][C]28[/C][C]-0.048449[/C][C]-0.4111[/C][C]0.341109[/C][/ROW]
[ROW][C]29[/C][C]0.024069[/C][C]0.2042[/C][C]0.419373[/C][/ROW]
[ROW][C]30[/C][C]-0.195003[/C][C]-1.6547[/C][C]0.051174[/C][/ROW]
[ROW][C]31[/C][C]-0.051757[/C][C]-0.4392[/C][C]0.330927[/C][/ROW]
[ROW][C]32[/C][C]-0.067391[/C][C]-0.5718[/C][C]0.284609[/C][/ROW]
[ROW][C]33[/C][C]-0.00714[/C][C]-0.0606[/C][C]0.475928[/C][/ROW]
[ROW][C]34[/C][C]0.049141[/C][C]0.417[/C][C]0.33897[/C][/ROW]
[ROW][C]35[/C][C]-0.026167[/C][C]-0.222[/C][C]0.412458[/C][/ROW]
[ROW][C]36[/C][C]-0.189475[/C][C]-1.6078[/C][C]0.056133[/C][/ROW]
[ROW][C]37[/C][C]-0.004694[/C][C]-0.0398[/C][C]0.484171[/C][/ROW]
[ROW][C]38[/C][C]0.104825[/C][C]0.8895[/C][C]0.188357[/C][/ROW]
[ROW][C]39[/C][C]-0.014166[/C][C]-0.1202[/C][C]0.452328[/C][/ROW]
[ROW][C]40[/C][C]-0.082109[/C][C]-0.6967[/C][C]0.244111[/C][/ROW]
[ROW][C]41[/C][C]0.016037[/C][C]0.1361[/C][C]0.446069[/C][/ROW]
[ROW][C]42[/C][C]0.116294[/C][C]0.9868[/C][C]0.163527[/C][/ROW]
[ROW][C]43[/C][C]-0.12116[/C][C]-1.0281[/C][C]0.153677[/C][/ROW]
[ROW][C]44[/C][C]0.003601[/C][C]0.0306[/C][C]0.487855[/C][/ROW]
[ROW][C]45[/C][C]0.062197[/C][C]0.5278[/C][C]0.299644[/C][/ROW]
[ROW][C]46[/C][C]-0.039574[/C][C]-0.3358[/C][C]0.369001[/C][/ROW]
[ROW][C]47[/C][C]0.031325[/C][C]0.2658[/C][C]0.395574[/C][/ROW]
[ROW][C]48[/C][C]-0.036086[/C][C]-0.3062[/C][C]0.380169[/C][/ROW]
[ROW][C]49[/C][C]0.032843[/C][C]0.2787[/C][C]0.390644[/C][/ROW]
[ROW][C]50[/C][C]0.057979[/C][C]0.492[/C][C]0.312118[/C][/ROW]
[ROW][C]51[/C][C]0.003257[/C][C]0.0276[/C][C]0.489014[/C][/ROW]
[ROW][C]52[/C][C]-0.013872[/C][C]-0.1177[/C][C]0.453313[/C][/ROW]
[ROW][C]53[/C][C]-0.014995[/C][C]-0.1272[/C][C]0.449553[/C][/ROW]
[ROW][C]54[/C][C]-0.049816[/C][C]-0.4227[/C][C]0.336885[/C][/ROW]
[ROW][C]55[/C][C]0.045242[/C][C]0.3839[/C][C]0.351095[/C][/ROW]
[ROW][C]56[/C][C]-0.079796[/C][C]-0.6771[/C][C]0.250259[/C][/ROW]
[ROW][C]57[/C][C]0.039792[/C][C]0.3377[/C][C]0.368305[/C][/ROW]
[ROW][C]58[/C][C]-0.045505[/C][C]-0.3861[/C][C]0.350272[/C][/ROW]
[ROW][C]59[/C][C]-0.057518[/C][C]-0.4881[/C][C]0.313495[/C][/ROW]
[ROW][C]60[/C][C]-0.075502[/C][C]-0.6407[/C][C]0.261891[/C][/ROW]
[/TABLE]
Source: https://freestatistics.org/blog/index.php?pk=99315&T=2

Globally Unique Identifier (entire table): ba.freestatistics.org/blog/index.php?pk=99315&T=2

As an alternative you can also use a QR Code:  

The GUIDs for individual cells are displayed in the table below:

Partial Autocorrelation Function
Time lag kPACF(k)T-STATP-value
10.8453717.17320
2-0.180325-1.53010.065186
3-0.263926-2.23950.014107
4-0.15541-1.31870.095725
50.23582.00080.024591
60.1706891.44830.07593
7-0.046161-0.39170.348223
80.0840750.71340.238953
90.1912551.62290.054496
100.0047830.04060.48387
11-0.140689-1.19380.118241
12-0.028376-0.24080.405205
13-0.091738-0.77840.219435
14-0.074628-0.63320.264291
15-0.043132-0.3660.357723
16-0.203087-1.72330.044568
170.094510.80190.212612
180.030850.26180.397123
190.0610790.51830.302928
200.0635470.53920.2957
21-0.110816-0.94030.175103
220.0765840.64980.258932
230.1386921.17680.121567
24-0.093813-0.7960.214317
25-0.003201-0.02720.489205
26-0.012399-0.10520.458253
27-0.045734-0.38810.349555
28-0.048449-0.41110.341109
290.0240690.20420.419373
30-0.195003-1.65470.051174
31-0.051757-0.43920.330927
32-0.067391-0.57180.284609
33-0.00714-0.06060.475928
340.0491410.4170.33897
35-0.026167-0.2220.412458
36-0.189475-1.60780.056133
37-0.004694-0.03980.484171
380.1048250.88950.188357
39-0.014166-0.12020.452328
40-0.082109-0.69670.244111
410.0160370.13610.446069
420.1162940.98680.163527
43-0.12116-1.02810.153677
440.0036010.03060.487855
450.0621970.52780.299644
46-0.039574-0.33580.369001
470.0313250.26580.395574
48-0.036086-0.30620.380169
490.0328430.27870.390644
500.0579790.4920.312118
510.0032570.02760.489014
52-0.013872-0.11770.453313
53-0.014995-0.12720.449553
54-0.049816-0.42270.336885
550.0452420.38390.351095
56-0.079796-0.67710.250259
570.0397920.33770.368305
58-0.045505-0.38610.350272
59-0.057518-0.48810.313495
60-0.075502-0.64070.261891


Parameters (Session):
par1 = 60 ; par2 = 1 ; par3 = 0 ; par4 = 0 ; par5 = 12 ; par6 = White Noise ; par7 = 0.95 ;
Parameters (R input):
par1 = 60 ; par2 = 1 ; par3 = 0 ; par4 = 0 ; par5 = 12 ; par6 = White Noise ; par7 = 0.95 ;
R code (references can be found in the software module):
if (par1 == 'Default') {
par1 = 10*log10(length(x))
} else {
par1 <- as.numeric(par1)
}
par2 <- as.numeric(par2)
par3 <- as.numeric(par3)
par4 <- as.numeric(par4)
par5 <- as.numeric(par5)
if (par6 == 'White Noise') par6 <- 'white' else par6 <- 'ma'
par7 <- as.numeric(par7)
if (par2 == 0) {
x <- log(x)
} else {
x <- (x ^ par2 - 1) / par2
}
if (par3 > 0) x <- diff(x,lag=1,difference=par3)
if (par4 > 0) x <- diff(x,lag=par5,difference=par4)
bitmap(file='pic1.png')
racf <- acf(x, par1, main='Autocorrelation', xlab='time lag', ylab='ACF', ci.type=par6, ci=par7, sub=paste('(lambda=',par2,', d=',par3,', D=',par4,', CI=', par7, ', CI type=',par6,')',sep=''))
dev.off()
bitmap(file='pic2.png')
rpacf <- pacf(x,par1,main='Partial Autocorrelation',xlab='lags',ylab='PACF')
dev.off()
(myacf <- c(racf$acf))
(mypacf <- c(rpacf$acf))
lengthx <- length(x)
sqrtn <- sqrt(lengthx)
load(file='createtable')
a<-table.start()
a<-table.row.start(a)
a<-table.element(a,'Autocorrelation Function',4,TRUE)
a<-table.row.end(a)
a<-table.row.start(a)
a<-table.element(a,'Time lag k',header=TRUE)
a<-table.element(a,hyperlink('basics.htm','ACF(k)','click here for more information about the Autocorrelation Function'),header=TRUE)
a<-table.element(a,'T-STAT',header=TRUE)
a<-table.element(a,'P-value',header=TRUE)
a<-table.row.end(a)
for (i in 2:(par1+1)) {
a<-table.row.start(a)
a<-table.element(a,i-1,header=TRUE)
a<-table.element(a,round(myacf[i],6))
mytstat <- myacf[i]*sqrtn
a<-table.element(a,round(mytstat,4))
a<-table.element(a,round(1-pt(abs(mytstat),lengthx),6))
a<-table.row.end(a)
}
a<-table.end(a)
table.save(a,file='mytable.tab')
a<-table.start()
a<-table.row.start(a)
a<-table.element(a,'Partial Autocorrelation Function',4,TRUE)
a<-table.row.end(a)
a<-table.row.start(a)
a<-table.element(a,'Time lag k',header=TRUE)
a<-table.element(a,hyperlink('basics.htm','PACF(k)','click here for more information about the Partial Autocorrelation Function'),header=TRUE)
a<-table.element(a,'T-STAT',header=TRUE)
a<-table.element(a,'P-value',header=TRUE)
a<-table.row.end(a)
for (i in 1:par1) {
a<-table.row.start(a)
a<-table.element(a,i,header=TRUE)
a<-table.element(a,round(mypacf[i],6))
mytstat <- mypacf[i]*sqrtn
a<-table.element(a,round(mytstat,4))
a<-table.element(a,round(1-pt(abs(mytstat),lengthx),6))
a<-table.row.end(a)
}
a<-table.end(a)
table.save(a,file='mytable1.tab')