| Multiple Linear Regression - Estimated Regression Equation |
| Bewoonbareopp[t] = -5.67046259550761 + 0.137285102691268Huurprijs[t] + 14.8450455533362Slaapkamers[t] -12.2215844419713Terras[t] + 3.47547927851639Garage[t] -8.17900748560341Nieuwbouw[t] + e[t] |
| Multiple Linear Regression - Ordinary Least Squares | |||||
| Variable | Parameter | S.D. | T-STAT H0: parameter = 0 | 2-tail p-value | 1-tail p-value |
| (Intercept) | -5.67046259550761 | 16.156965 | -0.351 | 0.727331 | 0.363666 |
| Huurprijs | 0.137285102691268 | 0.03138 | 4.3749 | 7.6e-05 | 3.8e-05 |
| Slaapkamers | 14.8450455533362 | 5.942266 | 2.4982 | 0.016385 | 0.008192 |
| Terras | -12.2215844419713 | 7.584623 | -1.6114 | 0.114418 | 0.057209 |
| Garage | 3.47547927851639 | 3.542126 | 0.9812 | 0.33199 | 0.165995 |
| Nieuwbouw | -8.17900748560341 | 6.93058 | -1.1801 | 0.244435 | 0.122217 |
| Multiple Linear Regression - Regression Statistics | |
| Multiple R | 0.754739307243435 |
| R-squared | 0.5696314218983 |
| Adjusted R-squared | 0.519588563979497 |
| F-TEST (value) | 11.3828715143040 |
| F-TEST (DF numerator) | 5 |
| F-TEST (DF denominator) | 43 |
| p-value | 4.94771190018284e-07 |
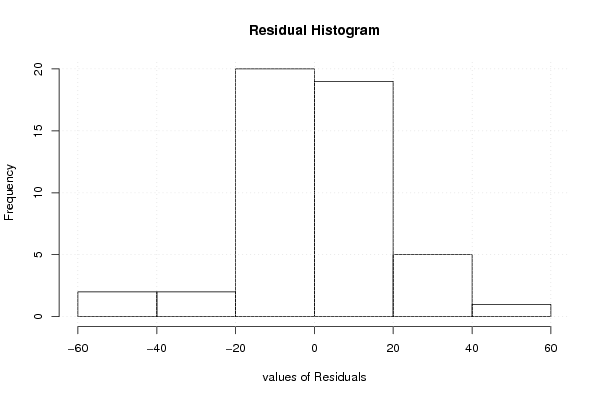
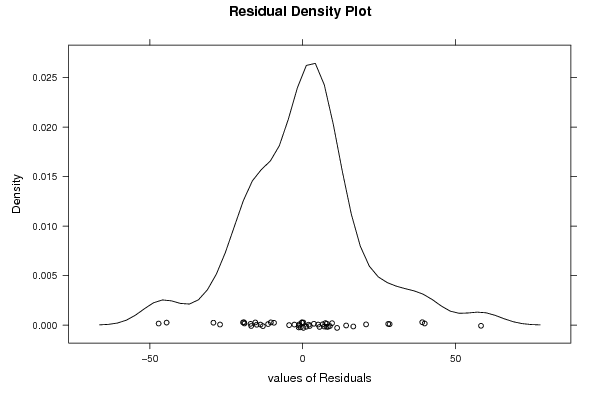
| Multiple Linear Regression - Residual Statistics | |
| Residual Standard Deviation | 20.6986735197444 |
| Sum Squared Residuals | 18422.7086755096 |
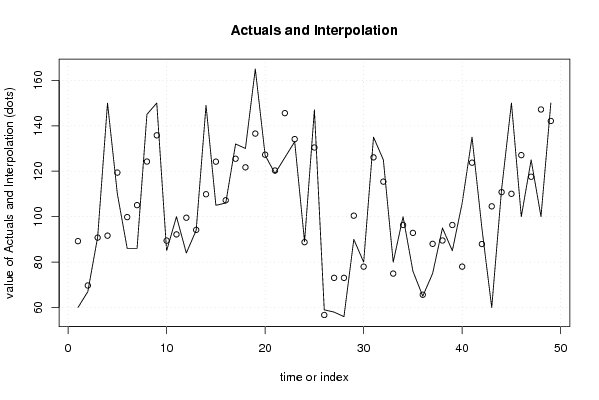
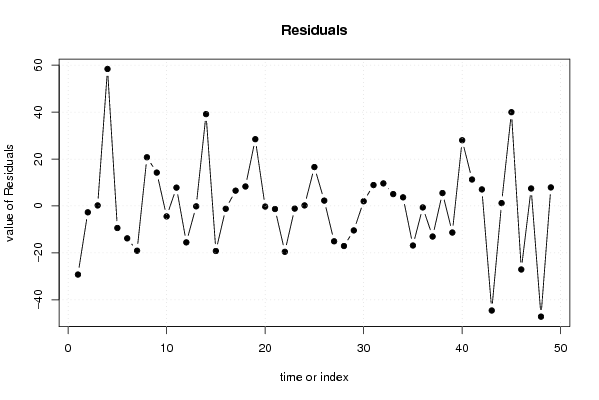
| Multiple Linear Regression - Actuals, Interpolation, and Residuals | |||
| Time or Index | Actuals | Interpolation Forecast | Residuals Prediction Error |
| 1 | 60 | 89.230052289517 | -29.2300522895171 |
| 2 | 67 | 69.7141029422292 | -2.71410294222919 |
| 3 | 91 | 90.7803298279072 | 0.219670172092798 |
| 4 | 150 | 91.6323479950587 | 58.3676520049413 |
| 5 | 110 | 119.397237361605 | -9.39723736160492 |
| 6 | 86 | 99.805311889947 | -13.8053118899470 |
| 7 | 86 | 105.075937774886 | -19.0759377748855 |
| 8 | 145 | 124.260314631672 | 20.7396853683281 |
| 9 | 150 | 135.784746262088 | 14.2152537379124 |
| 10 | 85 | 89.4508305122292 | -4.45083051222923 |
| 11 | 100 | 92.1965325660546 | 7.80346743394542 |
| 12 | 84 | 99.5264349913622 | -15.5264349913622 |
| 13 | 94 | 94.1691056839542 | -0.169105683954195 |
| 14 | 149 | 109.866169404442 | 39.1338305955581 |
| 15 | 105 | 124.202215955799 | -19.2022159557993 |
| 16 | 106 | 107.211190439625 | -1.21119043962463 |
| 17 | 132 | 125.488363560243 | 6.51163643975744 |
| 18 | 130 | 121.712829644677 | 8.28717035532286 |
| 19 | 165 | 136.557875198013 | 28.4421248019866 |
| 20 | 127 | 127.262332428201 | -0.262332428200508 |
| 21 | 119 | 120.311373871168 | -1.31137387116772 |
| 22 | 126 | 145.539505548818 | -19.5395055488184 |
| 23 | 133 | 134.126587562764 | -1.12658756276389 |
| 24 | 89 | 88.7791519634108 | 0.220848036589164 |
| 25 | 147 | 130.438144252779 | 16.5618557472210 |
| 26 | 59 | 56.7301168624314 | 2.26988313756857 |
| 27 | 58 | 73.0702543851408 | -15.0702543851408 |
| 28 | 56 | 73.0702543851408 | -17.0702543851408 |
| 29 | 90 | 100.433638727531 | -10.4336387275306 |
| 30 | 80 | 78.009307779578 | 1.99069222042207 |
| 31 | 135 | 126.098812949329 | 8.9011870506712 |
| 32 | 125 | 115.400925223327 | 9.59907477667266 |
| 33 | 80 | 74.9491913071767 | 5.05080869282329 |
| 34 | 100 | 96.3298326114306 | 3.67016738856944 |
| 35 | 76 | 92.8543533329142 | -16.8543533329142 |
| 36 | 65 | 65.6389015727259 | -0.638901572725882 |
| 37 | 75 | 88.0346277740819 | -13.0346277740818 |
| 38 | 95 | 89.5089291881019 | 5.49107081189812 |
| 39 | 85 | 96.3298326114306 | -11.3298326114306 |
| 40 | 106 | 78.009307779578 | 27.9906922204221 |
| 41 | 135 | 123.743501438449 | 11.2564985615506 |
| 42 | 95 | 87.9586516497118 | 7.04134835028825 |
| 43 | 60 | 104.552191808269 | -44.5521918082687 |
| 44 | 112 | 110.788120105248 | 1.21187989475162 |
| 45 | 150 | 110.058342880557 | 39.9416571194427 |
| 46 | 100 | 127.070158952085 | -27.0701589520851 |
| 47 | 125 | 117.565671817342 | 7.43432818265764 |
| 48 | 100 | 147.168672318434 | -47.1686723184343 |
| 49 | 150 | 142.107377981537 | 7.89262201846325 |
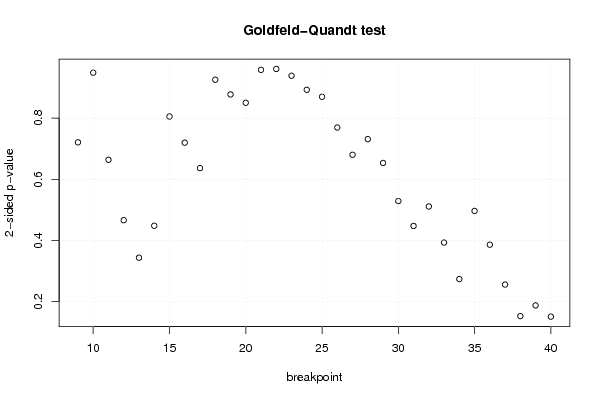
| Goldfeld-Quandt test for Heteroskedasticity | |||
| p-values | Alternative Hypothesis | ||
| breakpoint index | greater | 2-sided | less |
| 9 | 0.639535037189642 | 0.720929925620715 | 0.360464962810358 |
| 10 | 0.474228592317122 | 0.948457184634245 | 0.525771407682878 |
| 11 | 0.331811638300985 | 0.66362327660197 | 0.668188361699015 |
| 12 | 0.233113406242643 | 0.466226812485286 | 0.766886593757357 |
| 13 | 0.171811973172700 | 0.343623946345399 | 0.8281880268273 |
| 14 | 0.224010923430696 | 0.448021846861392 | 0.775989076569304 |
| 15 | 0.402728859975848 | 0.805457719951696 | 0.597271140024152 |
| 16 | 0.359892870990939 | 0.719785741981879 | 0.64010712900906 |
| 17 | 0.318309037612756 | 0.636618075225511 | 0.681690962387244 |
| 18 | 0.537139972264797 | 0.925720055470406 | 0.462860027735203 |
| 19 | 0.561220914260816 | 0.877558171478368 | 0.438779085739184 |
| 20 | 0.574893436376837 | 0.850213127246327 | 0.425106563623163 |
| 21 | 0.478909801339613 | 0.957819602679225 | 0.521090198660387 |
| 22 | 0.519563805267091 | 0.960872389465817 | 0.480436194732909 |
| 23 | 0.469372237362704 | 0.938744474725407 | 0.530627762637296 |
| 24 | 0.446340514906215 | 0.89268102981243 | 0.553659485093785 |
| 25 | 0.43492805224124 | 0.86985610448248 | 0.56507194775876 |
| 26 | 0.38468841895092 | 0.76937683790184 | 0.61531158104908 |
| 27 | 0.340132760039722 | 0.680265520079444 | 0.659867239960278 |
| 28 | 0.365629758179990 | 0.731259516359981 | 0.63437024182001 |
| 29 | 0.326731306170856 | 0.653462612341713 | 0.673268693829144 |
| 30 | 0.264478655734893 | 0.528957311469786 | 0.735521344265107 |
| 31 | 0.223720927750334 | 0.447441855500668 | 0.776279072249666 |
| 32 | 0.255562683872338 | 0.511125367744676 | 0.744437316127662 |
| 33 | 0.196534413706365 | 0.393068827412729 | 0.803465586293635 |
| 34 | 0.136840424489702 | 0.273680848979404 | 0.863159575510298 |
| 35 | 0.248296841172924 | 0.496593682345847 | 0.751703158827076 |
| 36 | 0.193029806407509 | 0.386059612815017 | 0.806970193592491 |
| 37 | 0.127909954367605 | 0.255819908735211 | 0.872090045632395 |
| 38 | 0.0762628874026975 | 0.152525774805395 | 0.923737112597303 |
| 39 | 0.093774190466938 | 0.187548380933876 | 0.906225809533062 |
| 40 | 0.075430086530888 | 0.150860173061776 | 0.924569913469112 |
| Meta Analysis of Goldfeld-Quandt test for Heteroskedasticity | |||
| Description | # significant tests | % significant tests | OK/NOK |
| 1% type I error level | 0 | 0 | OK |
| 5% type I error level | 0 | 0 | OK |
| 10% type I error level | 0 | 0 | OK |