Free Statistics
of Irreproducible Research!
Description of Statistical Computation | |||||||||||||||||||||||||||||||||||||||||
|---|---|---|---|---|---|---|---|---|---|---|---|---|---|---|---|---|---|---|---|---|---|---|---|---|---|---|---|---|---|---|---|---|---|---|---|---|---|---|---|---|---|
| Author's title | |||||||||||||||||||||||||||||||||||||||||
| Author | *The author of this computation has been verified* | ||||||||||||||||||||||||||||||||||||||||
| R Software Module | rwasp_univariatedataseries.wasp | ||||||||||||||||||||||||||||||||||||||||
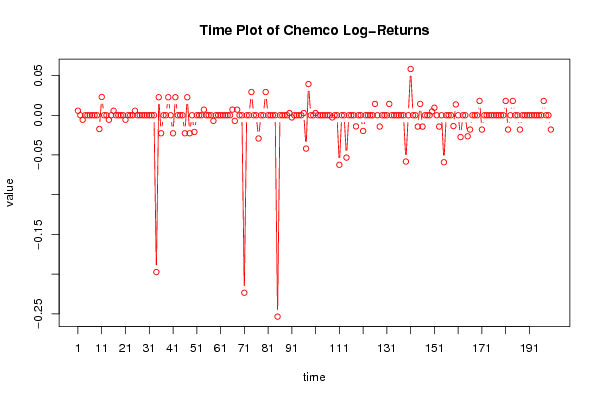
| Title produced by software | Univariate Data Series | ||||||||||||||||||||||||||||||||||||||||
| Date of computation | Tue, 23 Nov 2010 15:39:27 +0000 | ||||||||||||||||||||||||||||||||||||||||
| Cite this page as follows | Statistical Computations at FreeStatistics.org, Office for Research Development and Education, URL https://freestatistics.org/blog/index.php?v=date/2010/Nov/23/t1290526678zgsvx9wm7a31w1s.htm/, Retrieved Sat, 20 Apr 2024 08:32:12 +0000 | ||||||||||||||||||||||||||||||||||||||||
| Statistical Computations at FreeStatistics.org, Office for Research Development and Education, URL https://freestatistics.org/blog/index.php?pk=99298, Retrieved Sat, 20 Apr 2024 08:32:12 +0000 | |||||||||||||||||||||||||||||||||||||||||
| QR Codes: | |||||||||||||||||||||||||||||||||||||||||
|
| |||||||||||||||||||||||||||||||||||||||||
| Original text written by user: | |||||||||||||||||||||||||||||||||||||||||
| IsPrivate? | No (this computation is public) | ||||||||||||||||||||||||||||||||||||||||
| User-defined keywords | |||||||||||||||||||||||||||||||||||||||||
| Estimated Impact | 108 | ||||||||||||||||||||||||||||||||||||||||
Tree of Dependent Computations | |||||||||||||||||||||||||||||||||||||||||
| Family? (F = Feedback message, R = changed R code, M = changed R Module, P = changed Parameters, D = changed Data) | |||||||||||||||||||||||||||||||||||||||||
| - [Univariate Data Series] [CHE time plot] [2010-11-23 15:39:27] [f76239c595e4d455b3b05a43389f68d5] [Current] | |||||||||||||||||||||||||||||||||||||||||
| Feedback Forum | |||||||||||||||||||||||||||||||||||||||||
Post a new message | |||||||||||||||||||||||||||||||||||||||||
Dataset | |||||||||||||||||||||||||||||||||||||||||
| Dataseries X: | |||||||||||||||||||||||||||||||||||||||||
0.0057020824488649 -4.3076653355456E-14 -0.0057020824489431 -3.5083047578155E-14 -3.5083047578155E-14 -3.5083047578155E-14 -3.5083047578155E-14 -3.5083047578155E-14 -3.5083047578155E-14 -0.017303964564835 0.023006047013674 -4.3076653355456E-14 -4.3076653355456E-14 -0.0057020824489431 -3.5083047578155E-14 0.0057020824488649 -4.3076653355456E-14 -4.3076653355456E-14 -4.3076653355456E-14 -4.3076653355456E-14 -0.0057020824489431 -3.5083047578155E-14 -3.5083047578155E-14 -3.5083047578155E-14 0.0057020824488649 -4.3076653355456E-14 -4.3076653355456E-14 -4.3076653355456E-14 -4.3076653355456E-14 -4.3076653355456E-14 -4.3076653355456E-14 -4.3076653355456E-14 -4.3076653355456E-14 -0.19735943415854 0.022684473671052 -0.022684473671116 -4.7961634663807E-14 -4.7961634663807E-14 0.022684473671052 -1.6431300764452E-14 -0.022684473671116 0.022684473671052 -1.6431300764452E-14 -1.6431300764452E-14 -1.6431300764452E-14 -0.022684473671116 0.022684473671052 -0.022684473671116 -4.7961634663807E-14 -0.020998146839748 2.5313084961454E-14 2.5313084961454E-14 2.5313084961454E-14 0.0070484873310255 -3.5971225997855E-14 -3.5971225997855E-14 -3.5971225997855E-14 -0.0070484873310361 2.5313084961454E-14 2.5313084961454E-14 2.5313084961454E-14 2.5313084961454E-14 2.5313084961454E-14 2.5313084961454E-14 2.5313084961454E-14 0.0070484873310255 -0.0070484873310361 0.0070484873310255 -3.5971225997855E-14 -3.5971225997855E-14 -0.22336306618724 -1.2434497875802E-14 -1.2434497875802E-14 0.029207051746288 2.1316282072803E-14 2.1316282072803E-14 -0.029207051746279 -1.2434497875802E-14 -1.2434497875802E-14 0.029207051746288 2.1316282072803E-14 2.1316282072803E-14 2.1316282072803E-14 2.1316282072803E-14 -0.25344890080958 -3.9968028886506E-14 -3.9968028886506E-14 -3.9968028886506E-14 -3.9968028886506E-14 0.0027434859457602 -0.0027434859457909 -3.9968028886506E-14 -3.9968028886506E-14 -3.9968028886506E-14 -3.9968028886506E-14 0.0027434859457602 -0.041964199098991 0.039220713153242 -3.9968028886506E-14 -3.9968028886506E-14 0.0027434859457602 9.3258734068513E-15 9.3258734068513E-15 9.3258734068513E-15 9.3258734068513E-15 9.3258734068513E-15 9.3258734068513E-15 -0.0027434859457909 -3.9968028886506E-14 -3.9968028886506E-14 -0.06234313057414 -3.9968028886506E-15 -3.9968028886506E-15 -0.053295913866004 4.7517545453957E-14 4.7517545453957E-14 4.7517545453957E-14 -0.013975382737553 4.8849813083507E-14 4.8849813083507E-14 -0.019740080385951 2.5313084961454E-14 2.5313084961454E-14 2.5313084961454E-14 2.5313084961454E-14 0.014252022707225 2.3980817331903E-14 -0.014252022707176 2.5313084961454E-14 2.5313084961454E-14 2.5313084961454E-14 0.014252022707225 2.3980817331903E-14 2.3980817331903E-14 2.3980817331903E-14 2.3980817331903E-14 2.3980817331903E-14 2.3980817331903E-14 -0.058268908123976 -4.4408920985006E-16 0.058268908124 2.3980817331903E-14 2.3980817331903E-14 -0.014252022707176 0.014252022707225 -0.014252022707176 2.5313084961454E-14 2.5313084961454E-14 2.5313084961454E-14 0.0047732787526256 0.0094787439545678 2.3980817331903E-14 -0.014252022707176 2.5313084961454E-14 -0.059130523226774 4.7961634663807E-14 4.7961634663807E-14 4.7961634663807E-14 -0.013628831055652 0.013628831055654 4.7961634663807E-14 -0.027445976608752 -4.4408920985006E-15 -4.4408920985006E-15 -0.026433257068204 -0.018018505502649 2.9309887850104E-14 2.9309887850104E-14 2.9309887850104E-14 0.018018505502629 -0.018018505502649 2.9309887850104E-14 2.9309887850104E-14 2.9309887850104E-14 2.9309887850104E-14 2.9309887850104E-14 2.9309887850104E-14 2.9309887850104E-14 2.9309887850104E-14 2.9309887850104E-14 0.018018505502629 -0.018018505502649 2.9309887850104E-14 0.018018505502629 -4.8849813083507E-14 -4.8849813083507E-14 -0.018018505502649 2.9309887850104E-14 2.9309887850104E-14 2.9309887850104E-14 2.9309887850104E-14 2.9309887850104E-14 2.9309887850104E-14 2.9309887850104E-14 2.9309887850104E-14 2.9309887850104E-14 0.018018505502629 -4.8849813083507E-14 -4.8849813083507E-14 -0.018018505502649 | |||||||||||||||||||||||||||||||||||||||||
Tables (Output of Computation) | |||||||||||||||||||||||||||||||||||||||||
| |||||||||||||||||||||||||||||||||||||||||
Figures (Output of Computation) | |||||||||||||||||||||||||||||||||||||||||
Input Parameters & R Code | |||||||||||||||||||||||||||||||||||||||||
| Parameters (Session): | |||||||||||||||||||||||||||||||||||||||||
| par1 = Apollo Oil Corp. ; par3 = Time series of Xycoon Stock Exchange ; par4 = No season ; | |||||||||||||||||||||||||||||||||||||||||
| Parameters (R input): | |||||||||||||||||||||||||||||||||||||||||
| par1 = Chemco ; par2 = ; par3 = Time series of Xycoon Stock Exchange ; par4 = No season ; | |||||||||||||||||||||||||||||||||||||||||
| R code (references can be found in the software module): | |||||||||||||||||||||||||||||||||||||||||
if (par4 != 'No season') { | |||||||||||||||||||||||||||||||||||||||||