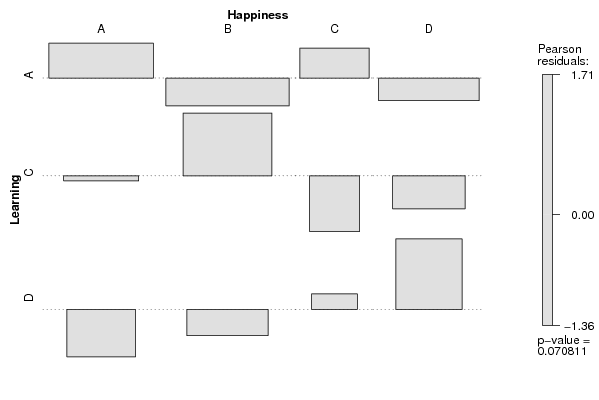
| Tabulation of Results | ||||
| Learning x Happiness | ||||
| A | B | C | D | A | 26 | 27 | 12 | 18 | C | 11 | 22 | 2 | 8 | D | 6 | 11 | 5 | 14 |
| Tabulation of Expected Results | ||||
| Learning x Happiness | ||||
| A | B | C | D | A | 22.03 | 30.74 | 9.73 | 20.49 | C | 11.41 | 15.93 | 5.04 | 10.62 | D | 9.56 | 13.33 | 4.22 | 8.89 |
| Statistical Results | |
| Pearson's Chi-squared test with simulated p-value (based on 2000 replicates) | |
| Chi Square Statistic | 11.63 |
| P value | 0.07 |