Free Statistics

of Irreproducible Research!

Author's title

Author*The author of this computation has been verified*
R Software Modulerwasp_multipleregression.wasp
Title produced by softwareMultiple Regression
Date of computationTue, 23 Nov 2010 15:19:28 +0000
Cite this page as followsStatistical Computations at FreeStatistics.org, Office for Research Development and Education, URL https://freestatistics.org/blog/index.php?v=date/2010/Nov/23/t1290526055pj18hzb2jub05qi.htm/, Retrieved Tue, 23 Apr 2024 14:51:56 +0000
Statistical Computations at FreeStatistics.org, Office for Research Development and Education, URL https://freestatistics.org/blog/index.php?pk=99274, Retrieved Tue, 23 Apr 2024 14:51:56 +0000
QR Codes:

Original text written by user:
IsPrivate?No (this computation is public)
User-defined keywords
Estimated Impact131
Family? (F = Feedback message, R = changed R code, M = changed R Module, P = changed Parameters, D = changed Data)
-     [Multiple Regression] [Competence to learn] [2010-11-17 07:43:53] [b98453cac15ba1066b407e146608df68]
-   PD  [Multiple Regression] [ws7] [2010-11-23 12:18:38] [f4dc4aa51d65be851b8508203d9f6001]
-    D      [Multiple Regression] [ws7 Crime] [2010-11-23 15:19:28] [7a87ed98a7b21a29d6a45388a9b7b229] [Current]
Feedback Forum

Post a new message
Dataseries X:
184	74	11	31	20
213	72	11	43	18
347	70	18	16	16
565	71	11	25	19
327	72	9	29	24
260	68	8	32	15
325	68	12	24	14
102	62	13	28	11
38	69	7	25	12
226	66	9	58	15
137	60	13	21	9
369	81	4	77	36
109	66	9	37	12
809	67	11	37	16
29	65	12	35	11
245	64	10	42	14
118	64	12	21	10
148	62	7	81	27
387	59	15	31	16
98	56	15	50	15
608	46	22	24	8
218	54	14	27	13
254	54	20	22	11
697	45	26	18	8
827	57	12	23	11
693	57	9	60	18
448	61	19	14	12
942	52	17	31	10
1017	44	21	24	9
216	43	18	23	8
673	48	19	22	10
989	57	14	25	12
630	47	19	25	9
404	50	19	21	9
692	48	16	32	11
1517	49	13	31	14
879	72	13	13	22
631	59	14	21	13
1375	49	9	46	13
1139	54	13	27	12
3545	62	22	18	15
706	47	17	39	11
451	45	34	15	10
433	48	26	23	12
601	69	23	7	12
1024	42	23	23	11
457	49	18	30	12
1441	57	15	35	13
1022	72	22	15	16
1244	67	26	18	16


Summary of computational transaction
Raw Inputview raw input (R code)
Raw Outputview raw output of R engine
Computing time6 seconds
R Server'Gwilym Jenkins' @ 72.249.127.135

\begin{tabular}{lllllllll}
\hline
Summary of computational transaction \tabularnewline
Raw Input & view raw input (R code)  \tabularnewline
Raw Output & view raw output of R engine  \tabularnewline
Computing time & 6 seconds \tabularnewline
R Server & 'Gwilym Jenkins' @ 72.249.127.135 \tabularnewline
\hline
\end{tabular}
%Source: https://freestatistics.org/blog/index.php?pk=99274&T=0

[TABLE]
[ROW][C]Summary of computational transaction[/C][/ROW]
[ROW][C]Raw Input[/C][C]view raw input (R code) [/C][/ROW]
[ROW][C]Raw Output[/C][C]view raw output of R engine [/C][/ROW]
[ROW][C]Computing time[/C][C]6 seconds[/C][/ROW]
[ROW][C]R Server[/C][C]'Gwilym Jenkins' @ 72.249.127.135[/C][/ROW]
[/TABLE]
Source: https://freestatistics.org/blog/index.php?pk=99274&T=0

Globally Unique Identifier (entire table): ba.freestatistics.org/blog/index.php?pk=99274&T=0

As an alternative you can also use a QR Code:  

The GUIDs for individual cells are displayed in the table below:

Summary of computational transaction
Raw Inputview raw input (R code)
Raw Outputview raw output of R engine
Computing time6 seconds
R Server'Gwilym Jenkins' @ 72.249.127.135


Multiple Linear Regression - Estimated Regression Equation
Crimerate[t] = + 1395.25905402689 -22.0239243392042`25+HSgraduate`[t] + 11.3564365152109`Dropouts16-19`[t] -13.0018979457832`CollegeStudents18-24`[t] + 52.8071869293045`25+CollegeGrads`[t] + e[t]

\begin{tabular}{lllllllll}
\hline
Multiple Linear Regression - Estimated Regression Equation \tabularnewline
Crimerate[t] =  +  1395.25905402689 -22.0239243392042`25+HSgraduate`[t] +  11.3564365152109`Dropouts16-19`[t] -13.0018979457832`CollegeStudents18-24`[t] +  52.8071869293045`25+CollegeGrads`[t]  + e[t] \tabularnewline
\hline
\end{tabular}
%Source: https://freestatistics.org/blog/index.php?pk=99274&T=1

[TABLE]
[ROW][C]Multiple Linear Regression - Estimated Regression Equation[/C][/ROW]
[ROW][C]Crimerate[t] =  +  1395.25905402689 -22.0239243392042`25+HSgraduate`[t] +  11.3564365152109`Dropouts16-19`[t] -13.0018979457832`CollegeStudents18-24`[t] +  52.8071869293045`25+CollegeGrads`[t]  + e[t][/C][/ROW]
[/TABLE]
Source: https://freestatistics.org/blog/index.php?pk=99274&T=1

Globally Unique Identifier (entire table): ba.freestatistics.org/blog/index.php?pk=99274&T=1

As an alternative you can also use a QR Code:  

The GUIDs for individual cells are displayed in the table below:

Multiple Linear Regression - Estimated Regression Equation
Crimerate[t] = + 1395.25905402689 -22.0239243392042`25+HSgraduate`[t] + 11.3564365152109`Dropouts16-19`[t] -13.0018979457832`CollegeStudents18-24`[t] + 52.8071869293045`25+CollegeGrads`[t] + e[t]


Multiple Linear Regression - Ordinary Least Squares
VariableParameterS.D.T-STATH0: parameter = 02-tail p-value1-tail p-value
(Intercept)1395.259054026891026.9460181.35860.181030.090515
`25+HSgraduate`-22.023924339204214.248002-1.54580.1291680.064584
`Dropouts16-19`11.356436515210921.1028390.53810.5931270.296564
`CollegeStudents18-24`-13.00189794578329.404988-1.38240.1736580.086829
`25+CollegeGrads`52.807186929304528.7522151.83660.0728750.036438

\begin{tabular}{lllllllll}
\hline
Multiple Linear Regression - Ordinary Least Squares \tabularnewline
Variable & Parameter & S.D. & T-STATH0: parameter = 0 & 2-tail p-value & 1-tail p-value \tabularnewline
(Intercept) & 1395.25905402689 & 1026.946018 & 1.3586 & 0.18103 & 0.090515 \tabularnewline
`25+HSgraduate` & -22.0239243392042 & 14.248002 & -1.5458 & 0.129168 & 0.064584 \tabularnewline
`Dropouts16-19` & 11.3564365152109 & 21.102839 & 0.5381 & 0.593127 & 0.296564 \tabularnewline
`CollegeStudents18-24` & -13.0018979457832 & 9.404988 & -1.3824 & 0.173658 & 0.086829 \tabularnewline
`25+CollegeGrads` & 52.8071869293045 & 28.752215 & 1.8366 & 0.072875 & 0.036438 \tabularnewline
\hline
\end{tabular}
%Source: https://freestatistics.org/blog/index.php?pk=99274&T=2

[TABLE]
[ROW][C]Multiple Linear Regression - Ordinary Least Squares[/C][/ROW]
[ROW][C]Variable[/C][C]Parameter[/C][C]S.D.[/C][C]T-STATH0: parameter = 0[/C][C]2-tail p-value[/C][C]1-tail p-value[/C][/ROW]
[ROW][C](Intercept)[/C][C]1395.25905402689[/C][C]1026.946018[/C][C]1.3586[/C][C]0.18103[/C][C]0.090515[/C][/ROW]
[ROW][C]`25+HSgraduate`[/C][C]-22.0239243392042[/C][C]14.248002[/C][C]-1.5458[/C][C]0.129168[/C][C]0.064584[/C][/ROW]
[ROW][C]`Dropouts16-19`[/C][C]11.3564365152109[/C][C]21.102839[/C][C]0.5381[/C][C]0.593127[/C][C]0.296564[/C][/ROW]
[ROW][C]`CollegeStudents18-24`[/C][C]-13.0018979457832[/C][C]9.404988[/C][C]-1.3824[/C][C]0.173658[/C][C]0.086829[/C][/ROW]
[ROW][C]`25+CollegeGrads`[/C][C]52.8071869293045[/C][C]28.752215[/C][C]1.8366[/C][C]0.072875[/C][C]0.036438[/C][/ROW]
[/TABLE]
Source: https://freestatistics.org/blog/index.php?pk=99274&T=2

Globally Unique Identifier (entire table): ba.freestatistics.org/blog/index.php?pk=99274&T=2

As an alternative you can also use a QR Code:  

The GUIDs for individual cells are displayed in the table below:

Multiple Linear Regression - Ordinary Least Squares
VariableParameterS.D.T-STATH0: parameter = 02-tail p-value1-tail p-value
(Intercept)1395.259054026891026.9460181.35860.181030.090515
`25+HSgraduate`-22.023924339204214.248002-1.54580.1291680.064584
`Dropouts16-19`11.356436515210921.1028390.53810.5931270.296564
`CollegeStudents18-24`-13.00189794578329.404988-1.38240.1736580.086829
`25+CollegeGrads`52.807186929304528.7522151.83660.0728750.036438


Multiple Linear Regression - Regression Statistics
Multiple R0.387809301531643
R-squared0.150396054354461
Adjusted R-squared0.0748757036304126
F-TEST (value)1.99146392876285
F-TEST (DF numerator)4
F-TEST (DF denominator)45
p-value0.112003982595635
Multiple Linear Regression - Residual Statistics
Residual Standard Deviation551.841741660512
Sum Squared Residuals13703818.8527508

\begin{tabular}{lllllllll}
\hline
Multiple Linear Regression - Regression Statistics \tabularnewline
Multiple R & 0.387809301531643 \tabularnewline
R-squared & 0.150396054354461 \tabularnewline
Adjusted R-squared & 0.0748757036304126 \tabularnewline
F-TEST (value) & 1.99146392876285 \tabularnewline
F-TEST (DF numerator) & 4 \tabularnewline
F-TEST (DF denominator) & 45 \tabularnewline
p-value & 0.112003982595635 \tabularnewline
Multiple Linear Regression - Residual Statistics \tabularnewline
Residual Standard Deviation & 551.841741660512 \tabularnewline
Sum Squared Residuals & 13703818.8527508 \tabularnewline
\hline
\end{tabular}
%Source: https://freestatistics.org/blog/index.php?pk=99274&T=3

[TABLE]
[ROW][C]Multiple Linear Regression - Regression Statistics[/C][/ROW]
[ROW][C]Multiple R[/C][C]0.387809301531643[/C][/ROW]
[ROW][C]R-squared[/C][C]0.150396054354461[/C][/ROW]
[ROW][C]Adjusted R-squared[/C][C]0.0748757036304126[/C][/ROW]
[ROW][C]F-TEST (value)[/C][C]1.99146392876285[/C][/ROW]
[ROW][C]F-TEST (DF numerator)[/C][C]4[/C][/ROW]
[ROW][C]F-TEST (DF denominator)[/C][C]45[/C][/ROW]
[ROW][C]p-value[/C][C]0.112003982595635[/C][/ROW]
[ROW][C]Multiple Linear Regression - Residual Statistics[/C][/ROW]
[ROW][C]Residual Standard Deviation[/C][C]551.841741660512[/C][/ROW]
[ROW][C]Sum Squared Residuals[/C][C]13703818.8527508[/C][/ROW]
[/TABLE]
Source: https://freestatistics.org/blog/index.php?pk=99274&T=3

Globally Unique Identifier (entire table): ba.freestatistics.org/blog/index.php?pk=99274&T=3

As an alternative you can also use a QR Code:  

The GUIDs for individual cells are displayed in the table below:

Multiple Linear Regression - Regression Statistics
Multiple R0.387809301531643
R-squared0.150396054354461
Adjusted R-squared0.0748757036304126
F-TEST (value)1.99146392876285
F-TEST (DF numerator)4
F-TEST (DF denominator)45
p-value0.112003982595635
Multiple Linear Regression - Residual Statistics
Residual Standard Deviation551.841741660512
Sum Squared Residuals13703818.8527508


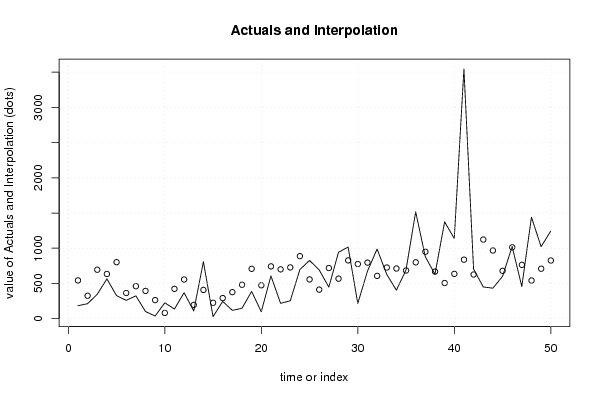
Multiple Linear Regression - Actuals, Interpolation, and Residuals
Time or IndexActualsInterpolationForecastResidualsPrediction Error
1184543.494356859904-359.494356859904
2213325.905056330308-112.905056330308
3347694.884831292732-347.884831292732
4565634.770330622917-69.7703306229168
5327802.06187611668-475.061876116680
6260364.530760757196-104.530760757196
7325461.164503455000-136.164503455000
8102394.23533343439-292.23533343439
938263.742124735350-225.742124735350
1022681.885699360451144.114300639549
11137423.682093874672-286.682093874672
12369556.659516241847-187.659516241847
13109196.503995433985-87.5039954339852
14809408.421691842421400.578308157579
1529225.793838281084-196.793838281084
16245292.513164757297-47.5131647572974
17118377.037146931949-259.037146931949
18148481.911114085486-333.911114085486
19387708.050220291597-321.050220291597
2098474.278745410024-376.278745410024
21608742.412082493774-134.412082493774
22218700.399436467627-482.399436467627
23254727.933171429199-473.933171429199
24697887.873140568521-190.873140568521
25827558.008008344116268.991991655884
26693412.518783309636280.481216690364
27448719.231635035129-271.231635035129
28942568.087442120621373.912557879379
291017827.910681586276189.089318413724
30216776.060007396327-560.060007396327
31673795.913094019909-122.913094019909
32989607.524272412276381.475727587724
33630726.124137592459-96.1241375924588
34404712.059956357979-308.059956357979
35692684.6319919457487.36800805425159
361517799.962216794608717.037783205392
37879949.903615451446-70.9036154514464
38631668.291202446305-37.2912024463051
391375506.700814617712868.299185382288
401139636.235813023111502.764186976889
413545837.6909892463382707.30901075366
42706626.99906717968179.0009328203192
434511123.34470038617-672.344700386167
44433968.02062553921-535.020625539211
45601679.479272002822-78.4792720028218
4610241013.2876750995010.7123249005013
47457764.131923457837-307.131923457837
481441541.668916398959899.331083601041
491022709.26462662095312.735373379049
501244825.804300540465418.195699459535

\begin{tabular}{lllllllll}
\hline
Multiple Linear Regression - Actuals, Interpolation, and Residuals \tabularnewline
Time or Index & Actuals & InterpolationForecast & ResidualsPrediction Error \tabularnewline
1 & 184 & 543.494356859904 & -359.494356859904 \tabularnewline
2 & 213 & 325.905056330308 & -112.905056330308 \tabularnewline
3 & 347 & 694.884831292732 & -347.884831292732 \tabularnewline
4 & 565 & 634.770330622917 & -69.7703306229168 \tabularnewline
5 & 327 & 802.06187611668 & -475.061876116680 \tabularnewline
6 & 260 & 364.530760757196 & -104.530760757196 \tabularnewline
7 & 325 & 461.164503455000 & -136.164503455000 \tabularnewline
8 & 102 & 394.23533343439 & -292.23533343439 \tabularnewline
9 & 38 & 263.742124735350 & -225.742124735350 \tabularnewline
10 & 226 & 81.885699360451 & 144.114300639549 \tabularnewline
11 & 137 & 423.682093874672 & -286.682093874672 \tabularnewline
12 & 369 & 556.659516241847 & -187.659516241847 \tabularnewline
13 & 109 & 196.503995433985 & -87.5039954339852 \tabularnewline
14 & 809 & 408.421691842421 & 400.578308157579 \tabularnewline
15 & 29 & 225.793838281084 & -196.793838281084 \tabularnewline
16 & 245 & 292.513164757297 & -47.5131647572974 \tabularnewline
17 & 118 & 377.037146931949 & -259.037146931949 \tabularnewline
18 & 148 & 481.911114085486 & -333.911114085486 \tabularnewline
19 & 387 & 708.050220291597 & -321.050220291597 \tabularnewline
20 & 98 & 474.278745410024 & -376.278745410024 \tabularnewline
21 & 608 & 742.412082493774 & -134.412082493774 \tabularnewline
22 & 218 & 700.399436467627 & -482.399436467627 \tabularnewline
23 & 254 & 727.933171429199 & -473.933171429199 \tabularnewline
24 & 697 & 887.873140568521 & -190.873140568521 \tabularnewline
25 & 827 & 558.008008344116 & 268.991991655884 \tabularnewline
26 & 693 & 412.518783309636 & 280.481216690364 \tabularnewline
27 & 448 & 719.231635035129 & -271.231635035129 \tabularnewline
28 & 942 & 568.087442120621 & 373.912557879379 \tabularnewline
29 & 1017 & 827.910681586276 & 189.089318413724 \tabularnewline
30 & 216 & 776.060007396327 & -560.060007396327 \tabularnewline
31 & 673 & 795.913094019909 & -122.913094019909 \tabularnewline
32 & 989 & 607.524272412276 & 381.475727587724 \tabularnewline
33 & 630 & 726.124137592459 & -96.1241375924588 \tabularnewline
34 & 404 & 712.059956357979 & -308.059956357979 \tabularnewline
35 & 692 & 684.631991945748 & 7.36800805425159 \tabularnewline
36 & 1517 & 799.962216794608 & 717.037783205392 \tabularnewline
37 & 879 & 949.903615451446 & -70.9036154514464 \tabularnewline
38 & 631 & 668.291202446305 & -37.2912024463051 \tabularnewline
39 & 1375 & 506.700814617712 & 868.299185382288 \tabularnewline
40 & 1139 & 636.235813023111 & 502.764186976889 \tabularnewline
41 & 3545 & 837.690989246338 & 2707.30901075366 \tabularnewline
42 & 706 & 626.999067179681 & 79.0009328203192 \tabularnewline
43 & 451 & 1123.34470038617 & -672.344700386167 \tabularnewline
44 & 433 & 968.02062553921 & -535.020625539211 \tabularnewline
45 & 601 & 679.479272002822 & -78.4792720028218 \tabularnewline
46 & 1024 & 1013.28767509950 & 10.7123249005013 \tabularnewline
47 & 457 & 764.131923457837 & -307.131923457837 \tabularnewline
48 & 1441 & 541.668916398959 & 899.331083601041 \tabularnewline
49 & 1022 & 709.26462662095 & 312.735373379049 \tabularnewline
50 & 1244 & 825.804300540465 & 418.195699459535 \tabularnewline
\hline
\end{tabular}
%Source: https://freestatistics.org/blog/index.php?pk=99274&T=4

[TABLE]
[ROW][C]Multiple Linear Regression - Actuals, Interpolation, and Residuals[/C][/ROW]
[ROW][C]Time or Index[/C][C]Actuals[/C][C]InterpolationForecast[/C][C]ResidualsPrediction Error[/C][/ROW]
[ROW][C]1[/C][C]184[/C][C]543.494356859904[/C][C]-359.494356859904[/C][/ROW]
[ROW][C]2[/C][C]213[/C][C]325.905056330308[/C][C]-112.905056330308[/C][/ROW]
[ROW][C]3[/C][C]347[/C][C]694.884831292732[/C][C]-347.884831292732[/C][/ROW]
[ROW][C]4[/C][C]565[/C][C]634.770330622917[/C][C]-69.7703306229168[/C][/ROW]
[ROW][C]5[/C][C]327[/C][C]802.06187611668[/C][C]-475.061876116680[/C][/ROW]
[ROW][C]6[/C][C]260[/C][C]364.530760757196[/C][C]-104.530760757196[/C][/ROW]
[ROW][C]7[/C][C]325[/C][C]461.164503455000[/C][C]-136.164503455000[/C][/ROW]
[ROW][C]8[/C][C]102[/C][C]394.23533343439[/C][C]-292.23533343439[/C][/ROW]
[ROW][C]9[/C][C]38[/C][C]263.742124735350[/C][C]-225.742124735350[/C][/ROW]
[ROW][C]10[/C][C]226[/C][C]81.885699360451[/C][C]144.114300639549[/C][/ROW]
[ROW][C]11[/C][C]137[/C][C]423.682093874672[/C][C]-286.682093874672[/C][/ROW]
[ROW][C]12[/C][C]369[/C][C]556.659516241847[/C][C]-187.659516241847[/C][/ROW]
[ROW][C]13[/C][C]109[/C][C]196.503995433985[/C][C]-87.5039954339852[/C][/ROW]
[ROW][C]14[/C][C]809[/C][C]408.421691842421[/C][C]400.578308157579[/C][/ROW]
[ROW][C]15[/C][C]29[/C][C]225.793838281084[/C][C]-196.793838281084[/C][/ROW]
[ROW][C]16[/C][C]245[/C][C]292.513164757297[/C][C]-47.5131647572974[/C][/ROW]
[ROW][C]17[/C][C]118[/C][C]377.037146931949[/C][C]-259.037146931949[/C][/ROW]
[ROW][C]18[/C][C]148[/C][C]481.911114085486[/C][C]-333.911114085486[/C][/ROW]
[ROW][C]19[/C][C]387[/C][C]708.050220291597[/C][C]-321.050220291597[/C][/ROW]
[ROW][C]20[/C][C]98[/C][C]474.278745410024[/C][C]-376.278745410024[/C][/ROW]
[ROW][C]21[/C][C]608[/C][C]742.412082493774[/C][C]-134.412082493774[/C][/ROW]
[ROW][C]22[/C][C]218[/C][C]700.399436467627[/C][C]-482.399436467627[/C][/ROW]
[ROW][C]23[/C][C]254[/C][C]727.933171429199[/C][C]-473.933171429199[/C][/ROW]
[ROW][C]24[/C][C]697[/C][C]887.873140568521[/C][C]-190.873140568521[/C][/ROW]
[ROW][C]25[/C][C]827[/C][C]558.008008344116[/C][C]268.991991655884[/C][/ROW]
[ROW][C]26[/C][C]693[/C][C]412.518783309636[/C][C]280.481216690364[/C][/ROW]
[ROW][C]27[/C][C]448[/C][C]719.231635035129[/C][C]-271.231635035129[/C][/ROW]
[ROW][C]28[/C][C]942[/C][C]568.087442120621[/C][C]373.912557879379[/C][/ROW]
[ROW][C]29[/C][C]1017[/C][C]827.910681586276[/C][C]189.089318413724[/C][/ROW]
[ROW][C]30[/C][C]216[/C][C]776.060007396327[/C][C]-560.060007396327[/C][/ROW]
[ROW][C]31[/C][C]673[/C][C]795.913094019909[/C][C]-122.913094019909[/C][/ROW]
[ROW][C]32[/C][C]989[/C][C]607.524272412276[/C][C]381.475727587724[/C][/ROW]
[ROW][C]33[/C][C]630[/C][C]726.124137592459[/C][C]-96.1241375924588[/C][/ROW]
[ROW][C]34[/C][C]404[/C][C]712.059956357979[/C][C]-308.059956357979[/C][/ROW]
[ROW][C]35[/C][C]692[/C][C]684.631991945748[/C][C]7.36800805425159[/C][/ROW]
[ROW][C]36[/C][C]1517[/C][C]799.962216794608[/C][C]717.037783205392[/C][/ROW]
[ROW][C]37[/C][C]879[/C][C]949.903615451446[/C][C]-70.9036154514464[/C][/ROW]
[ROW][C]38[/C][C]631[/C][C]668.291202446305[/C][C]-37.2912024463051[/C][/ROW]
[ROW][C]39[/C][C]1375[/C][C]506.700814617712[/C][C]868.299185382288[/C][/ROW]
[ROW][C]40[/C][C]1139[/C][C]636.235813023111[/C][C]502.764186976889[/C][/ROW]
[ROW][C]41[/C][C]3545[/C][C]837.690989246338[/C][C]2707.30901075366[/C][/ROW]
[ROW][C]42[/C][C]706[/C][C]626.999067179681[/C][C]79.0009328203192[/C][/ROW]
[ROW][C]43[/C][C]451[/C][C]1123.34470038617[/C][C]-672.344700386167[/C][/ROW]
[ROW][C]44[/C][C]433[/C][C]968.02062553921[/C][C]-535.020625539211[/C][/ROW]
[ROW][C]45[/C][C]601[/C][C]679.479272002822[/C][C]-78.4792720028218[/C][/ROW]
[ROW][C]46[/C][C]1024[/C][C]1013.28767509950[/C][C]10.7123249005013[/C][/ROW]
[ROW][C]47[/C][C]457[/C][C]764.131923457837[/C][C]-307.131923457837[/C][/ROW]
[ROW][C]48[/C][C]1441[/C][C]541.668916398959[/C][C]899.331083601041[/C][/ROW]
[ROW][C]49[/C][C]1022[/C][C]709.26462662095[/C][C]312.735373379049[/C][/ROW]
[ROW][C]50[/C][C]1244[/C][C]825.804300540465[/C][C]418.195699459535[/C][/ROW]
[/TABLE]
Source: https://freestatistics.org/blog/index.php?pk=99274&T=4

Globally Unique Identifier (entire table): ba.freestatistics.org/blog/index.php?pk=99274&T=4

As an alternative you can also use a QR Code:  

The GUIDs for individual cells are displayed in the table below:

Multiple Linear Regression - Actuals, Interpolation, and Residuals
Time or IndexActualsInterpolationForecastResidualsPrediction Error
1184543.494356859904-359.494356859904
2213325.905056330308-112.905056330308
3347694.884831292732-347.884831292732
4565634.770330622917-69.7703306229168
5327802.06187611668-475.061876116680
6260364.530760757196-104.530760757196
7325461.164503455000-136.164503455000
8102394.23533343439-292.23533343439
938263.742124735350-225.742124735350
1022681.885699360451144.114300639549
11137423.682093874672-286.682093874672
12369556.659516241847-187.659516241847
13109196.503995433985-87.5039954339852
14809408.421691842421400.578308157579
1529225.793838281084-196.793838281084
16245292.513164757297-47.5131647572974
17118377.037146931949-259.037146931949
18148481.911114085486-333.911114085486
19387708.050220291597-321.050220291597
2098474.278745410024-376.278745410024
21608742.412082493774-134.412082493774
22218700.399436467627-482.399436467627
23254727.933171429199-473.933171429199
24697887.873140568521-190.873140568521
25827558.008008344116268.991991655884
26693412.518783309636280.481216690364
27448719.231635035129-271.231635035129
28942568.087442120621373.912557879379
291017827.910681586276189.089318413724
30216776.060007396327-560.060007396327
31673795.913094019909-122.913094019909
32989607.524272412276381.475727587724
33630726.124137592459-96.1241375924588
34404712.059956357979-308.059956357979
35692684.6319919457487.36800805425159
361517799.962216794608717.037783205392
37879949.903615451446-70.9036154514464
38631668.291202446305-37.2912024463051
391375506.700814617712868.299185382288
401139636.235813023111502.764186976889
413545837.6909892463382707.30901075366
42706626.99906717968179.0009328203192
434511123.34470038617-672.344700386167
44433968.02062553921-535.020625539211
45601679.479272002822-78.4792720028218
4610241013.2876750995010.7123249005013
47457764.131923457837-307.131923457837
481441541.668916398959899.331083601041
491022709.26462662095312.735373379049
501244825.804300540465418.195699459535


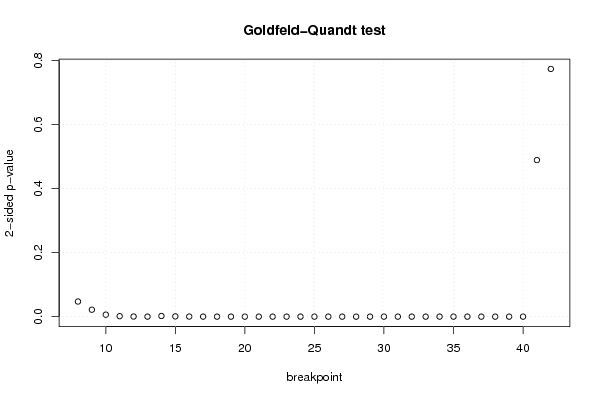
Goldfeld-Quandt test for Heteroskedasticity
p-valuesAlternative Hypothesis
breakpoint indexgreater2-sidedless
80.02359927888810260.04719855777620510.976400721111897
90.0108353616803890.0216707233607780.98916463831961
100.003084017056648720.006168034113297440.996915982943351
110.0007305534985232770.001461106997046550.999269446501477
120.0001852466805271090.0003704933610542180.999814753319473
133.70348016458373e-057.40696032916746e-050.999962965198354
140.001068663126377410.002137326252754820.998931336873623
150.0004573275673211230.0009146551346422460.999542672432679
160.0001421066412829600.0002842132825659210.999857893358717
175.29282624427728e-050.0001058565248855460.999947071737557
183.12630951783484e-056.25261903566969e-050.999968736904822
191.15185336732675e-052.30370673465350e-050.999988481466327
206.65435070634497e-061.33087014126899e-050.999993345649294
214.24253734655200e-068.48507469310399e-060.999995757462653
221.97423567481337e-063.94847134962674e-060.999998025764325
239.317249313127e-071.8634498626254e-060.999999068275069
244.01861598763344e-078.03723197526689e-070.9999995981384
252.28966121671521e-064.57932243343042e-060.999997710338783
266.91088999824635e-061.38217799964927e-050.999993089110002
272.51679391435658e-065.03358782871317e-060.999997483206086
285.5137934224229e-061.10275868448458e-050.999994486206578
294.68568667059819e-069.37137334119638e-060.99999531431333
305.43244389242611e-061.08648877848522e-050.999994567556107
311.87138506344722e-063.74277012689444e-060.999998128614937
322.9610561616965e-065.922112323393e-060.999997038943838
339.49798478653584e-071.89959695730717e-060.999999050201521
343.34355683850764e-076.68711367701528e-070.999999665644316
351.09660379377435e-072.19320758754870e-070.99999989033962
366.65310942433421e-071.33062188486684e-060.999999334689058
375.25495056954094e-061.05099011390819e-050.99999474504943
385.56385739546331e-061.11277147909266e-050.999994436142605
395.66393268194933e-061.13278653638987e-050.999994336067318
403.03525818234719e-066.07051636469439e-060.999996964741818
410.7556588694353750.488682261129250.244341130564625
420.6135466634613660.7729066730772690.386453336538634

\begin{tabular}{lllllllll}
\hline
Goldfeld-Quandt test for Heteroskedasticity \tabularnewline
p-values & Alternative Hypothesis \tabularnewline
breakpoint index & greater & 2-sided & less \tabularnewline
8 & 0.0235992788881026 & 0.0471985577762051 & 0.976400721111897 \tabularnewline
9 & 0.010835361680389 & 0.021670723360778 & 0.98916463831961 \tabularnewline
10 & 0.00308401705664872 & 0.00616803411329744 & 0.996915982943351 \tabularnewline
11 & 0.000730553498523277 & 0.00146110699704655 & 0.999269446501477 \tabularnewline
12 & 0.000185246680527109 & 0.000370493361054218 & 0.999814753319473 \tabularnewline
13 & 3.70348016458373e-05 & 7.40696032916746e-05 & 0.999962965198354 \tabularnewline
14 & 0.00106866312637741 & 0.00213732625275482 & 0.998931336873623 \tabularnewline
15 & 0.000457327567321123 & 0.000914655134642246 & 0.999542672432679 \tabularnewline
16 & 0.000142106641282960 & 0.000284213282565921 & 0.999857893358717 \tabularnewline
17 & 5.29282624427728e-05 & 0.000105856524885546 & 0.999947071737557 \tabularnewline
18 & 3.12630951783484e-05 & 6.25261903566969e-05 & 0.999968736904822 \tabularnewline
19 & 1.15185336732675e-05 & 2.30370673465350e-05 & 0.999988481466327 \tabularnewline
20 & 6.65435070634497e-06 & 1.33087014126899e-05 & 0.999993345649294 \tabularnewline
21 & 4.24253734655200e-06 & 8.48507469310399e-06 & 0.999995757462653 \tabularnewline
22 & 1.97423567481337e-06 & 3.94847134962674e-06 & 0.999998025764325 \tabularnewline
23 & 9.317249313127e-07 & 1.8634498626254e-06 & 0.999999068275069 \tabularnewline
24 & 4.01861598763344e-07 & 8.03723197526689e-07 & 0.9999995981384 \tabularnewline
25 & 2.28966121671521e-06 & 4.57932243343042e-06 & 0.999997710338783 \tabularnewline
26 & 6.91088999824635e-06 & 1.38217799964927e-05 & 0.999993089110002 \tabularnewline
27 & 2.51679391435658e-06 & 5.03358782871317e-06 & 0.999997483206086 \tabularnewline
28 & 5.5137934224229e-06 & 1.10275868448458e-05 & 0.999994486206578 \tabularnewline
29 & 4.68568667059819e-06 & 9.37137334119638e-06 & 0.99999531431333 \tabularnewline
30 & 5.43244389242611e-06 & 1.08648877848522e-05 & 0.999994567556107 \tabularnewline
31 & 1.87138506344722e-06 & 3.74277012689444e-06 & 0.999998128614937 \tabularnewline
32 & 2.9610561616965e-06 & 5.922112323393e-06 & 0.999997038943838 \tabularnewline
33 & 9.49798478653584e-07 & 1.89959695730717e-06 & 0.999999050201521 \tabularnewline
34 & 3.34355683850764e-07 & 6.68711367701528e-07 & 0.999999665644316 \tabularnewline
35 & 1.09660379377435e-07 & 2.19320758754870e-07 & 0.99999989033962 \tabularnewline
36 & 6.65310942433421e-07 & 1.33062188486684e-06 & 0.999999334689058 \tabularnewline
37 & 5.25495056954094e-06 & 1.05099011390819e-05 & 0.99999474504943 \tabularnewline
38 & 5.56385739546331e-06 & 1.11277147909266e-05 & 0.999994436142605 \tabularnewline
39 & 5.66393268194933e-06 & 1.13278653638987e-05 & 0.999994336067318 \tabularnewline
40 & 3.03525818234719e-06 & 6.07051636469439e-06 & 0.999996964741818 \tabularnewline
41 & 0.755658869435375 & 0.48868226112925 & 0.244341130564625 \tabularnewline
42 & 0.613546663461366 & 0.772906673077269 & 0.386453336538634 \tabularnewline
\hline
\end{tabular}
%Source: https://freestatistics.org/blog/index.php?pk=99274&T=5

[TABLE]
[ROW][C]Goldfeld-Quandt test for Heteroskedasticity[/C][/ROW]
[ROW][C]p-values[/C][C]Alternative Hypothesis[/C][/ROW]
[ROW][C]breakpoint index[/C][C]greater[/C][C]2-sided[/C][C]less[/C][/ROW]
[ROW][C]8[/C][C]0.0235992788881026[/C][C]0.0471985577762051[/C][C]0.976400721111897[/C][/ROW]
[ROW][C]9[/C][C]0.010835361680389[/C][C]0.021670723360778[/C][C]0.98916463831961[/C][/ROW]
[ROW][C]10[/C][C]0.00308401705664872[/C][C]0.00616803411329744[/C][C]0.996915982943351[/C][/ROW]
[ROW][C]11[/C][C]0.000730553498523277[/C][C]0.00146110699704655[/C][C]0.999269446501477[/C][/ROW]
[ROW][C]12[/C][C]0.000185246680527109[/C][C]0.000370493361054218[/C][C]0.999814753319473[/C][/ROW]
[ROW][C]13[/C][C]3.70348016458373e-05[/C][C]7.40696032916746e-05[/C][C]0.999962965198354[/C][/ROW]
[ROW][C]14[/C][C]0.00106866312637741[/C][C]0.00213732625275482[/C][C]0.998931336873623[/C][/ROW]
[ROW][C]15[/C][C]0.000457327567321123[/C][C]0.000914655134642246[/C][C]0.999542672432679[/C][/ROW]
[ROW][C]16[/C][C]0.000142106641282960[/C][C]0.000284213282565921[/C][C]0.999857893358717[/C][/ROW]
[ROW][C]17[/C][C]5.29282624427728e-05[/C][C]0.000105856524885546[/C][C]0.999947071737557[/C][/ROW]
[ROW][C]18[/C][C]3.12630951783484e-05[/C][C]6.25261903566969e-05[/C][C]0.999968736904822[/C][/ROW]
[ROW][C]19[/C][C]1.15185336732675e-05[/C][C]2.30370673465350e-05[/C][C]0.999988481466327[/C][/ROW]
[ROW][C]20[/C][C]6.65435070634497e-06[/C][C]1.33087014126899e-05[/C][C]0.999993345649294[/C][/ROW]
[ROW][C]21[/C][C]4.24253734655200e-06[/C][C]8.48507469310399e-06[/C][C]0.999995757462653[/C][/ROW]
[ROW][C]22[/C][C]1.97423567481337e-06[/C][C]3.94847134962674e-06[/C][C]0.999998025764325[/C][/ROW]
[ROW][C]23[/C][C]9.317249313127e-07[/C][C]1.8634498626254e-06[/C][C]0.999999068275069[/C][/ROW]
[ROW][C]24[/C][C]4.01861598763344e-07[/C][C]8.03723197526689e-07[/C][C]0.9999995981384[/C][/ROW]
[ROW][C]25[/C][C]2.28966121671521e-06[/C][C]4.57932243343042e-06[/C][C]0.999997710338783[/C][/ROW]
[ROW][C]26[/C][C]6.91088999824635e-06[/C][C]1.38217799964927e-05[/C][C]0.999993089110002[/C][/ROW]
[ROW][C]27[/C][C]2.51679391435658e-06[/C][C]5.03358782871317e-06[/C][C]0.999997483206086[/C][/ROW]
[ROW][C]28[/C][C]5.5137934224229e-06[/C][C]1.10275868448458e-05[/C][C]0.999994486206578[/C][/ROW]
[ROW][C]29[/C][C]4.68568667059819e-06[/C][C]9.37137334119638e-06[/C][C]0.99999531431333[/C][/ROW]
[ROW][C]30[/C][C]5.43244389242611e-06[/C][C]1.08648877848522e-05[/C][C]0.999994567556107[/C][/ROW]
[ROW][C]31[/C][C]1.87138506344722e-06[/C][C]3.74277012689444e-06[/C][C]0.999998128614937[/C][/ROW]
[ROW][C]32[/C][C]2.9610561616965e-06[/C][C]5.922112323393e-06[/C][C]0.999997038943838[/C][/ROW]
[ROW][C]33[/C][C]9.49798478653584e-07[/C][C]1.89959695730717e-06[/C][C]0.999999050201521[/C][/ROW]
[ROW][C]34[/C][C]3.34355683850764e-07[/C][C]6.68711367701528e-07[/C][C]0.999999665644316[/C][/ROW]
[ROW][C]35[/C][C]1.09660379377435e-07[/C][C]2.19320758754870e-07[/C][C]0.99999989033962[/C][/ROW]
[ROW][C]36[/C][C]6.65310942433421e-07[/C][C]1.33062188486684e-06[/C][C]0.999999334689058[/C][/ROW]
[ROW][C]37[/C][C]5.25495056954094e-06[/C][C]1.05099011390819e-05[/C][C]0.99999474504943[/C][/ROW]
[ROW][C]38[/C][C]5.56385739546331e-06[/C][C]1.11277147909266e-05[/C][C]0.999994436142605[/C][/ROW]
[ROW][C]39[/C][C]5.66393268194933e-06[/C][C]1.13278653638987e-05[/C][C]0.999994336067318[/C][/ROW]
[ROW][C]40[/C][C]3.03525818234719e-06[/C][C]6.07051636469439e-06[/C][C]0.999996964741818[/C][/ROW]
[ROW][C]41[/C][C]0.755658869435375[/C][C]0.48868226112925[/C][C]0.244341130564625[/C][/ROW]
[ROW][C]42[/C][C]0.613546663461366[/C][C]0.772906673077269[/C][C]0.386453336538634[/C][/ROW]
[/TABLE]
Source: https://freestatistics.org/blog/index.php?pk=99274&T=5

Globally Unique Identifier (entire table): ba.freestatistics.org/blog/index.php?pk=99274&T=5

As an alternative you can also use a QR Code:  

The GUIDs for individual cells are displayed in the table below:

Goldfeld-Quandt test for Heteroskedasticity
p-valuesAlternative Hypothesis
breakpoint indexgreater2-sidedless
80.02359927888810260.04719855777620510.976400721111897
90.0108353616803890.0216707233607780.98916463831961
100.003084017056648720.006168034113297440.996915982943351
110.0007305534985232770.001461106997046550.999269446501477
120.0001852466805271090.0003704933610542180.999814753319473
133.70348016458373e-057.40696032916746e-050.999962965198354
140.001068663126377410.002137326252754820.998931336873623
150.0004573275673211230.0009146551346422460.999542672432679
160.0001421066412829600.0002842132825659210.999857893358717
175.29282624427728e-050.0001058565248855460.999947071737557
183.12630951783484e-056.25261903566969e-050.999968736904822
191.15185336732675e-052.30370673465350e-050.999988481466327
206.65435070634497e-061.33087014126899e-050.999993345649294
214.24253734655200e-068.48507469310399e-060.999995757462653
221.97423567481337e-063.94847134962674e-060.999998025764325
239.317249313127e-071.8634498626254e-060.999999068275069
244.01861598763344e-078.03723197526689e-070.9999995981384
252.28966121671521e-064.57932243343042e-060.999997710338783
266.91088999824635e-061.38217799964927e-050.999993089110002
272.51679391435658e-065.03358782871317e-060.999997483206086
285.5137934224229e-061.10275868448458e-050.999994486206578
294.68568667059819e-069.37137334119638e-060.99999531431333
305.43244389242611e-061.08648877848522e-050.999994567556107
311.87138506344722e-063.74277012689444e-060.999998128614937
322.9610561616965e-065.922112323393e-060.999997038943838
339.49798478653584e-071.89959695730717e-060.999999050201521
343.34355683850764e-076.68711367701528e-070.999999665644316
351.09660379377435e-072.19320758754870e-070.99999989033962
366.65310942433421e-071.33062188486684e-060.999999334689058
375.25495056954094e-061.05099011390819e-050.99999474504943
385.56385739546331e-061.11277147909266e-050.999994436142605
395.66393268194933e-061.13278653638987e-050.999994336067318
403.03525818234719e-066.07051636469439e-060.999996964741818
410.7556588694353750.488682261129250.244341130564625
420.6135466634613660.7729066730772690.386453336538634


Meta Analysis of Goldfeld-Quandt test for Heteroskedasticity
Description# significant tests% significant testsOK/NOK
1% type I error level310.885714285714286NOK
5% type I error level330.942857142857143NOK
10% type I error level330.942857142857143NOK

\begin{tabular}{lllllllll}
\hline
Meta Analysis of Goldfeld-Quandt test for Heteroskedasticity \tabularnewline
Description & # significant tests & % significant tests & OK/NOK \tabularnewline
1% type I error level & 31 & 0.885714285714286 & NOK \tabularnewline
5% type I error level & 33 & 0.942857142857143 & NOK \tabularnewline
10% type I error level & 33 & 0.942857142857143 & NOK \tabularnewline
\hline
\end{tabular}
%Source: https://freestatistics.org/blog/index.php?pk=99274&T=6

[TABLE]
[ROW][C]Meta Analysis of Goldfeld-Quandt test for Heteroskedasticity[/C][/ROW]
[ROW][C]Description[/C][C]# significant tests[/C][C]% significant tests[/C][C]OK/NOK[/C][/ROW]
[ROW][C]1% type I error level[/C][C]31[/C][C]0.885714285714286[/C][C]NOK[/C][/ROW]
[ROW][C]5% type I error level[/C][C]33[/C][C]0.942857142857143[/C][C]NOK[/C][/ROW]
[ROW][C]10% type I error level[/C][C]33[/C][C]0.942857142857143[/C][C]NOK[/C][/ROW]
[/TABLE]
Source: https://freestatistics.org/blog/index.php?pk=99274&T=6

Globally Unique Identifier (entire table): ba.freestatistics.org/blog/index.php?pk=99274&T=6

As an alternative you can also use a QR Code:  

The GUIDs for individual cells are displayed in the table below:

Meta Analysis of Goldfeld-Quandt test for Heteroskedasticity
Description# significant tests% significant testsOK/NOK
1% type I error level310.885714285714286NOK
5% type I error level330.942857142857143NOK
10% type I error level330.942857142857143NOK


Parameters (Session):
par1 = 1 ; par2 = Do not include Seasonal Dummies ; par3 = No Linear Trend ;
Parameters (R input):
par1 = 1 ; par2 = Do not include Seasonal Dummies ; par3 = No Linear Trend ;
R code (references can be found in the software module):
library(lattice)
library(lmtest)
n25 <- 25 #minimum number of obs. for Goldfeld-Quandt test
par1 <- as.numeric(par1)
x <- t(y)
k <- length(x[1,])
n <- length(x[,1])
x1 <- cbind(x[,par1], x[,1:k!=par1])
mycolnames <- c(colnames(x)[par1], colnames(x)[1:k!=par1])
colnames(x1) <- mycolnames #colnames(x)[par1]
x <- x1
if (par3 == 'First Differences'){
x2 <- array(0, dim=c(n-1,k), dimnames=list(1:(n-1), paste('(1-B)',colnames(x),sep='')))
for (i in 1:n-1) {
for (j in 1:k) {
x2[i,j] <- x[i+1,j] - x[i,j]
}
}
x <- x2
}
if (par2 == 'Include Monthly Dummies'){
x2 <- array(0, dim=c(n,11), dimnames=list(1:n, paste('M', seq(1:11), sep ='')))
for (i in 1:11){
x2[seq(i,n,12),i] <- 1
}
x <- cbind(x, x2)
}
if (par2 == 'Include Quarterly Dummies'){
x2 <- array(0, dim=c(n,3), dimnames=list(1:n, paste('Q', seq(1:3), sep ='')))
for (i in 1:3){
x2[seq(i,n,4),i] <- 1
}
x <- cbind(x, x2)
}
k <- length(x[1,])
if (par3 == 'Linear Trend'){
x <- cbind(x, c(1:n))
colnames(x)[k+1] <- 't'
}
x
k <- length(x[1,])
df <- as.data.frame(x)
(mylm <- lm(df))
(mysum <- summary(mylm))
if (n > n25) {
kp3 <- k + 3
nmkm3 <- n - k - 3
gqarr <- array(NA, dim=c(nmkm3-kp3+1,3))
numgqtests <- 0
numsignificant1 <- 0
numsignificant5 <- 0
numsignificant10 <- 0
for (mypoint in kp3:nmkm3) {
j <- 0
numgqtests <- numgqtests + 1
for (myalt in c('greater', 'two.sided', 'less')) {
j <- j + 1
gqarr[mypoint-kp3+1,j] <- gqtest(mylm, point=mypoint, alternative=myalt)$p.value
}
if (gqarr[mypoint-kp3+1,2] < 0.01) numsignificant1 <- numsignificant1 + 1
if (gqarr[mypoint-kp3+1,2] < 0.05) numsignificant5 <- numsignificant5 + 1
if (gqarr[mypoint-kp3+1,2] < 0.10) numsignificant10 <- numsignificant10 + 1
}
gqarr
}
bitmap(file='test0.png')
plot(x[,1], type='l', main='Actuals and Interpolation', ylab='value of Actuals and Interpolation (dots)', xlab='time or index')
points(x[,1]-mysum$resid)
grid()
dev.off()
bitmap(file='test1.png')
plot(mysum$resid, type='b', pch=19, main='Residuals', ylab='value of Residuals', xlab='time or index')
grid()
dev.off()
bitmap(file='test2.png')
hist(mysum$resid, main='Residual Histogram', xlab='values of Residuals')
grid()
dev.off()
bitmap(file='test3.png')
densityplot(~mysum$resid,col='black',main='Residual Density Plot', xlab='values of Residuals')
dev.off()
bitmap(file='test4.png')
qqnorm(mysum$resid, main='Residual Normal Q-Q Plot')
qqline(mysum$resid)
grid()
dev.off()
(myerror <- as.ts(mysum$resid))
bitmap(file='test5.png')
dum <- cbind(lag(myerror,k=1),myerror)
dum
dum1 <- dum[2:length(myerror),]
dum1
z <- as.data.frame(dum1)
z
plot(z,main=paste('Residual Lag plot, lowess, and regression line'), ylab='values of Residuals', xlab='lagged values of Residuals')
lines(lowess(z))
abline(lm(z))
grid()
dev.off()
bitmap(file='test6.png')
acf(mysum$resid, lag.max=length(mysum$resid)/2, main='Residual Autocorrelation Function')
grid()
dev.off()
bitmap(file='test7.png')
pacf(mysum$resid, lag.max=length(mysum$resid)/2, main='Residual Partial Autocorrelation Function')
grid()
dev.off()
bitmap(file='test8.png')
opar <- par(mfrow = c(2,2), oma = c(0, 0, 1.1, 0))
plot(mylm, las = 1, sub='Residual Diagnostics')
par(opar)
dev.off()
if (n > n25) {
bitmap(file='test9.png')
plot(kp3:nmkm3,gqarr[,2], main='Goldfeld-Quandt test',ylab='2-sided p-value',xlab='breakpoint')
grid()
dev.off()
}
load(file='createtable')
a<-table.start()
a<-table.row.start(a)
a<-table.element(a, 'Multiple Linear Regression - Estimated Regression Equation', 1, TRUE)
a<-table.row.end(a)
myeq <- colnames(x)[1]
myeq <- paste(myeq, '[t] = ', sep='')
for (i in 1:k){
if (mysum$coefficients[i,1] > 0) myeq <- paste(myeq, '+', '')
myeq <- paste(myeq, mysum$coefficients[i,1], sep=' ')
if (rownames(mysum$coefficients)[i] != '(Intercept)') {
myeq <- paste(myeq, rownames(mysum$coefficients)[i], sep='')
if (rownames(mysum$coefficients)[i] != 't') myeq <- paste(myeq, '[t]', sep='')
}
}
myeq <- paste(myeq, ' + e[t]')
a<-table.row.start(a)
a<-table.element(a, myeq)
a<-table.row.end(a)
a<-table.end(a)
table.save(a,file='mytable1.tab')
a<-table.start()
a<-table.row.start(a)
a<-table.element(a,hyperlink('ols1.htm','Multiple Linear Regression - Ordinary Least Squares',''), 6, TRUE)
a<-table.row.end(a)
a<-table.row.start(a)
a<-table.element(a,'Variable',header=TRUE)
a<-table.element(a,'Parameter',header=TRUE)
a<-table.element(a,'S.D.',header=TRUE)
a<-table.element(a,'T-STAT
H0: parameter = 0',header=TRUE)
a<-table.element(a,'2-tail p-value',header=TRUE)
a<-table.element(a,'1-tail p-value',header=TRUE)
a<-table.row.end(a)
for (i in 1:k){
a<-table.row.start(a)
a<-table.element(a,rownames(mysum$coefficients)[i],header=TRUE)
a<-table.element(a,mysum$coefficients[i,1])
a<-table.element(a, round(mysum$coefficients[i,2],6))
a<-table.element(a, round(mysum$coefficients[i,3],4))
a<-table.element(a, round(mysum$coefficients[i,4],6))
a<-table.element(a, round(mysum$coefficients[i,4]/2,6))
a<-table.row.end(a)
}
a<-table.end(a)
table.save(a,file='mytable2.tab')
a<-table.start()
a<-table.row.start(a)
a<-table.element(a, 'Multiple Linear Regression - Regression Statistics', 2, TRUE)
a<-table.row.end(a)
a<-table.row.start(a)
a<-table.element(a, 'Multiple R',1,TRUE)
a<-table.element(a, sqrt(mysum$r.squared))
a<-table.row.end(a)
a<-table.row.start(a)
a<-table.element(a, 'R-squared',1,TRUE)
a<-table.element(a, mysum$r.squared)
a<-table.row.end(a)
a<-table.row.start(a)
a<-table.element(a, 'Adjusted R-squared',1,TRUE)
a<-table.element(a, mysum$adj.r.squared)
a<-table.row.end(a)
a<-table.row.start(a)
a<-table.element(a, 'F-TEST (value)',1,TRUE)
a<-table.element(a, mysum$fstatistic[1])
a<-table.row.end(a)
a<-table.row.start(a)
a<-table.element(a, 'F-TEST (DF numerator)',1,TRUE)
a<-table.element(a, mysum$fstatistic[2])
a<-table.row.end(a)
a<-table.row.start(a)
a<-table.element(a, 'F-TEST (DF denominator)',1,TRUE)
a<-table.element(a, mysum$fstatistic[3])
a<-table.row.end(a)
a<-table.row.start(a)
a<-table.element(a, 'p-value',1,TRUE)
a<-table.element(a, 1-pf(mysum$fstatistic[1],mysum$fstatistic[2],mysum$fstatistic[3]))
a<-table.row.end(a)
a<-table.row.start(a)
a<-table.element(a, 'Multiple Linear Regression - Residual Statistics', 2, TRUE)
a<-table.row.end(a)
a<-table.row.start(a)
a<-table.element(a, 'Residual Standard Deviation',1,TRUE)
a<-table.element(a, mysum$sigma)
a<-table.row.end(a)
a<-table.row.start(a)
a<-table.element(a, 'Sum Squared Residuals',1,TRUE)
a<-table.element(a, sum(myerror*myerror))
a<-table.row.end(a)
a<-table.end(a)
table.save(a,file='mytable3.tab')
a<-table.start()
a<-table.row.start(a)
a<-table.element(a, 'Multiple Linear Regression - Actuals, Interpolation, and Residuals', 4, TRUE)
a<-table.row.end(a)
a<-table.row.start(a)
a<-table.element(a, 'Time or Index', 1, TRUE)
a<-table.element(a, 'Actuals', 1, TRUE)
a<-table.element(a, 'Interpolation
Forecast', 1, TRUE)
a<-table.element(a, 'Residuals
Prediction Error', 1, TRUE)
a<-table.row.end(a)
for (i in 1:n) {
a<-table.row.start(a)
a<-table.element(a,i, 1, TRUE)
a<-table.element(a,x[i])
a<-table.element(a,x[i]-mysum$resid[i])
a<-table.element(a,mysum$resid[i])
a<-table.row.end(a)
}
a<-table.end(a)
table.save(a,file='mytable4.tab')
if (n > n25) {
a<-table.start()
a<-table.row.start(a)
a<-table.element(a,'Goldfeld-Quandt test for Heteroskedasticity',4,TRUE)
a<-table.row.end(a)
a<-table.row.start(a)
a<-table.element(a,'p-values',header=TRUE)
a<-table.element(a,'Alternative Hypothesis',3,header=TRUE)
a<-table.row.end(a)
a<-table.row.start(a)
a<-table.element(a,'breakpoint index',header=TRUE)
a<-table.element(a,'greater',header=TRUE)
a<-table.element(a,'2-sided',header=TRUE)
a<-table.element(a,'less',header=TRUE)
a<-table.row.end(a)
for (mypoint in kp3:nmkm3) {
a<-table.row.start(a)
a<-table.element(a,mypoint,header=TRUE)
a<-table.element(a,gqarr[mypoint-kp3+1,1])
a<-table.element(a,gqarr[mypoint-kp3+1,2])
a<-table.element(a,gqarr[mypoint-kp3+1,3])
a<-table.row.end(a)
}
a<-table.end(a)
table.save(a,file='mytable5.tab')
a<-table.start()
a<-table.row.start(a)
a<-table.element(a,'Meta Analysis of Goldfeld-Quandt test for Heteroskedasticity',4,TRUE)
a<-table.row.end(a)
a<-table.row.start(a)
a<-table.element(a,'Description',header=TRUE)
a<-table.element(a,'# significant tests',header=TRUE)
a<-table.element(a,'% significant tests',header=TRUE)
a<-table.element(a,'OK/NOK',header=TRUE)
a<-table.row.end(a)
a<-table.row.start(a)
a<-table.element(a,'1% type I error level',header=TRUE)
a<-table.element(a,numsignificant1)
a<-table.element(a,numsignificant1/numgqtests)
if (numsignificant1/numgqtests < 0.01) dum <- 'OK' else dum <- 'NOK'
a<-table.element(a,dum)
a<-table.row.end(a)
a<-table.row.start(a)
a<-table.element(a,'5% type I error level',header=TRUE)
a<-table.element(a,numsignificant5)
a<-table.element(a,numsignificant5/numgqtests)
if (numsignificant5/numgqtests < 0.05) dum <- 'OK' else dum <- 'NOK'
a<-table.element(a,dum)
a<-table.row.end(a)
a<-table.row.start(a)
a<-table.element(a,'10% type I error level',header=TRUE)
a<-table.element(a,numsignificant10)
a<-table.element(a,numsignificant10/numgqtests)
if (numsignificant10/numgqtests < 0.1) dum <- 'OK' else dum <- 'NOK'
a<-table.element(a,dum)
a<-table.row.end(a)
a<-table.end(a)
table.save(a,file='mytable6.tab')
}