| Multiple Linear Regression - Estimated Regression Equation |
| Yt[t] = -6.07613317665566 + 0.000351314085121308X1t[t] + 9.30390784089718e-06X2t[t] + 1.13154878529155X4t[t] + e[t] |
| Multiple Linear Regression - Ordinary Least Squares | |||||
| Variable | Parameter | S.D. | T-STAT H0: parameter = 0 | 2-tail p-value | 1-tail p-value |
| (Intercept) | -6.07613317665566 | 2.006939 | -3.0276 | 0.004679 | 0.002339 |
| X1t | 0.000351314085121308 | 0.001606 | 0.2187 | 0.828184 | 0.414092 |
| X2t | 9.30390784089718e-06 | 3.4e-05 | 0.2757 | 0.784452 | 0.392226 |
| X4t | 1.13154878529155 | 0.029538 | 38.308 | 0 | 0 |
| Multiple Linear Regression - Regression Statistics | |
| Multiple R | 0.993295841481829 |
| R-squared | 0.986636628705095 |
| Adjusted R-squared | 0.985457507708486 |
| F-TEST (value) | 836.7560509416 |
| F-TEST (DF numerator) | 3 |
| F-TEST (DF denominator) | 34 |
| p-value | 0 |
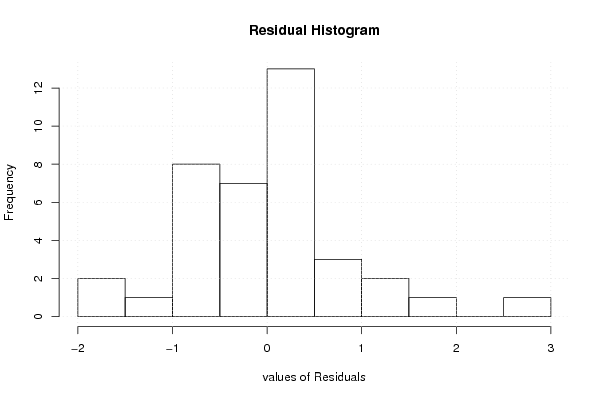
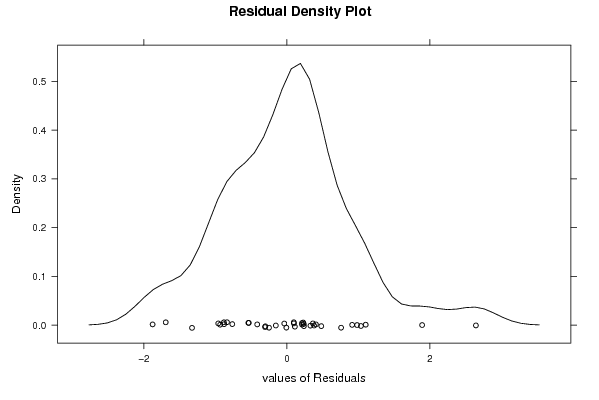
| Multiple Linear Regression - Residual Statistics | |
| Residual Standard Deviation | 0.940888746055703 |
| Sum Squared Residuals | 30.0992355034453 |
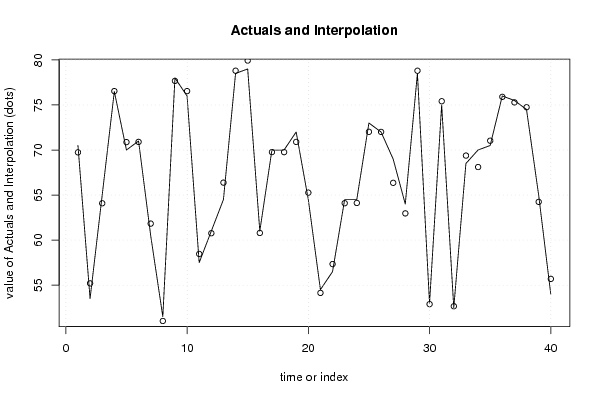
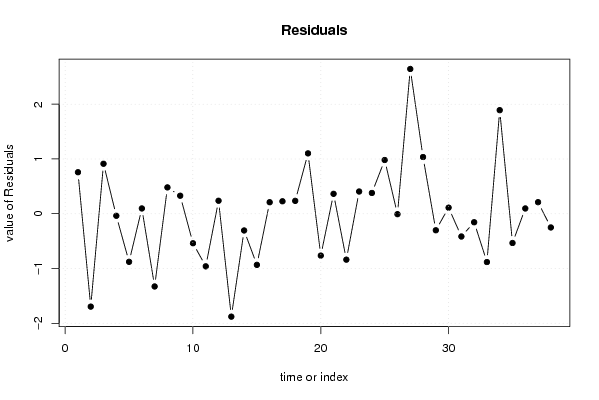
| Multiple Linear Regression - Actuals, Interpolation, and Residuals | |||
| Time or Index | Actuals | Interpolation Forecast | Residuals Prediction Error |
| 1 | 70.5 | 69.7424831401196 | 0.757516859880394 |
| 2 | 53.5 | 55.1955330616482 | -1.69553306164825 |
| 3 | 65 | 64.0876606407241 | 0.912339359275858 |
| 4 | 76.5 | 76.5370779436952 | -0.0370779436951658 |
| 5 | 70 | 70.8779771485924 | -0.877977148592454 |
| 6 | 71 | 70.9032881729978 | 0.0967118270021877 |
| 7 | 60.5 | 61.8277948593442 | -1.32779485934420 |
| 8 | 51.5 | 51.0190983341852 | 0.480901665814824 |
| 9 | 78 | 77.6713605759921 | 0.328639424007873 |
| 10 | 76 | 76.5392814679536 | -0.539281467953644 |
| 11 | 57.5 | 58.4605953609829 | -0.960595360982923 |
| 12 | 61 | 60.7627768171231 | 0.237223182876914 |
| 13 | 64.5 | 66.3789065982213 | -1.87890659822134 |
| 14 | 78.5 | 78.8055434659722 | -0.305543465972182 |
| 15 | 79 | 79.9335642389095 | -0.933564238909482 |
| 16 | 61 | 60.7898205659259 | 0.210179434074092 |
| 17 | 70 | 69.7726961514403 | 0.227303848559715 |
| 18 | 70 | 69.7647677938076 | 0.235232206192423 |
| 19 | 72 | 70.8979532974923 | 1.10204670250767 |
| 20 | 64.5 | 65.2641558354083 | -0.764155835408272 |
| 21 | 54.5 | 54.1363545010139 | 0.363645498986137 |
| 22 | 56.5 | 57.3382391660209 | -0.838239166020916 |
| 23 | 64.5 | 64.0942626789785 | 0.405737321021466 |
| 24 | 64.5 | 64.1206879010382 | 0.379312098961809 |
| 25 | 73 | 72.0189001335447 | 0.981099866455301 |
| 26 | 72 | 72.0080417774551 | -0.00804177745512728 |
| 27 | 69 | 66.3566408448583 | 2.64335915514174 |
| 28 | 64 | 62.964674417572 | 1.03532558242793 |
| 29 | 78.5 | 78.80171846108 | -0.301718461080044 |
| 30 | 53 | 52.889247925866 | 0.110752074133976 |
| 31 | 75 | 75.4155996861263 | -0.415599686126337 |
| 32 | 52.5 | 52.6553820895101 | -0.155382089510121 |
| 33 | 68.5 | 69.3820031400182 | -0.88200314001822 |
| 34 | 70 | 68.1092432780141 | 1.89075672198591 |
| 35 | 70.5 | 71.0336667795737 | -0.533666779573694 |
| 36 | 76 | 75.9037052262103 | 0.0962947737897103 |
| 37 | 75.5 | 75.2888632187276 | 0.211136781272411 |
| 38 | 74.5 | 74.750433303856 | -0.250433303855969 |
| 39 | 65 | NA | NA |
| 40 | 54 | NA | NA |
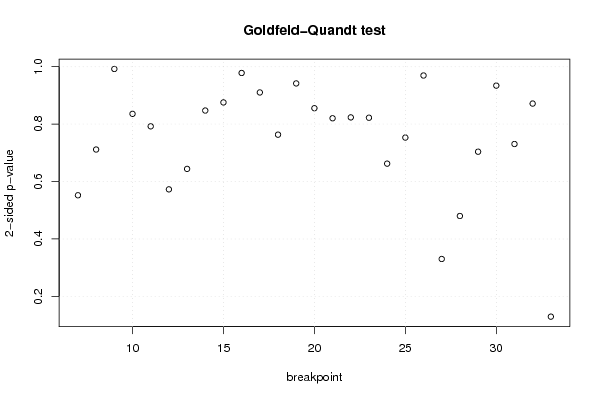
| Goldfeld-Quandt test for Heteroskedasticity | |||
| p-values | Alternative Hypothesis | ||
| breakpoint index | greater | 2-sided | less |
| 7 | 0.723923655479075 | 0.55215268904185 | 0.276076344520925 |
| 8 | 0.644282360229007 | 0.711435279541987 | 0.355717639770993 |
| 9 | 0.503938831106383 | 0.992122337787233 | 0.496061168893617 |
| 10 | 0.417883081985796 | 0.835766163971591 | 0.582116918014204 |
| 11 | 0.396169059124384 | 0.792338118248768 | 0.603830940875616 |
| 12 | 0.28635921699209 | 0.57271843398418 | 0.71364078300791 |
| 13 | 0.678009897267288 | 0.643980205465423 | 0.321990102732712 |
| 14 | 0.576366475035925 | 0.84726704992815 | 0.423633524964075 |
| 15 | 0.562239742354077 | 0.875520515291845 | 0.437760257645923 |
| 16 | 0.489038440258569 | 0.978076880517138 | 0.510961559741431 |
| 17 | 0.455154655383144 | 0.910309310766287 | 0.544845344616856 |
| 18 | 0.381628901129223 | 0.763257802258447 | 0.618371098870776 |
| 19 | 0.470848894319822 | 0.941697788639643 | 0.529151105680178 |
| 20 | 0.427676416151010 | 0.855352832302019 | 0.57232358384899 |
| 21 | 0.410179160310692 | 0.820358320621384 | 0.589820839689308 |
| 22 | 0.588297206513198 | 0.823405586973605 | 0.411702793486802 |
| 23 | 0.588915936880092 | 0.822168126239815 | 0.411084063119908 |
| 24 | 0.66885588290104 | 0.66228823419792 | 0.33114411709896 |
| 25 | 0.623441690058323 | 0.753116619883353 | 0.376558309941677 |
| 26 | 0.515338476602909 | 0.969323046794183 | 0.484661523397091 |
| 27 | 0.834901465502765 | 0.33019706899447 | 0.165098534497235 |
| 28 | 0.760017725856118 | 0.479964548287764 | 0.239982274143882 |
| 29 | 0.648071700852789 | 0.703856598294422 | 0.351928299147211 |
| 30 | 0.532950006106734 | 0.934099987786531 | 0.467049993893265 |
| 31 | 0.365334299712512 | 0.730668599425025 | 0.634665700287488 |
| 32 | 0.564239718199508 | 0.871520563600985 | 0.435760281800492 |
| 33 | 0.935328455671135 | 0.129343088657729 | 0.0646715443288645 |
| Meta Analysis of Goldfeld-Quandt test for Heteroskedasticity | |||
| Description | # significant tests | % significant tests | OK/NOK |
| 1% type I error level | 0 | 0 | OK |
| 5% type I error level | 0 | 0 | OK |
| 10% type I error level | 0 | 0 | OK |