Free Statistics

of Irreproducible Research!

Author's title

Author*The author of this computation has been verified*
R Software Modulerwasp_multipleregression.wasp
Title produced by softwareMultiple Regression
Date of computationTue, 23 Nov 2010 15:10:23 +0000
Cite this page as followsStatistical Computations at FreeStatistics.org, Office for Research Development and Education, URL https://freestatistics.org/blog/index.php?v=date/2010/Nov/23/t1290524951ru4djac155agwsf.htm/, Retrieved Fri, 26 Apr 2024 10:24:24 +0000
Statistical Computations at FreeStatistics.org, Office for Research Development and Education, URL https://freestatistics.org/blog/index.php?pk=99234, Retrieved Fri, 26 Apr 2024 10:24:24 +0000
QR Codes:

Original text written by user:
IsPrivate?No (this computation is public)
User-defined keywords
Estimated Impact127
Family? (F = Feedback message, R = changed R code, M = changed R Module, P = changed Parameters, D = changed Data)
-     [Multiple Regression] [Competence to learn] [2010-11-17 07:43:53] [b98453cac15ba1066b407e146608df68]
-   PD    [Multiple Regression] [Workshop 7 - regr...] [2010-11-23 15:10:23] [0605ea080d54454c99180f574351b8e4] [Current]
Feedback Forum

Post a new message
Dataseries X:
70,5	4	370	 67
53,5	315	6166	 54
65	4	684	 62
76,5	17	449	 73
70	8	643	 68
71	56	1551	 68
60,5	15	616	 60
51,5	503	36660 50
78	26	403	 74
76	26	346	 73
57,5	44	2471	 57
61	24	7427	 59
64,5	23	2992	 64
78,5	38	233	 75
79	18	609	 76
61	96	7615	 59
70	90	370	 67
70	49	1066	 67
72	66	600	 68
64,5	21	4873	 63
54,5	592	3485	 53
56,5	73	2364	 56
64,5	14	1016	 62
64,5	88	1062	 62
73	39	480	 69
72	6	559	 69
69	32	259	 64
64	11	1340	 61
78,5	26	275	 75
53	23	12550 52
75	32	965	 72
52,5	NA	25229 50
68,5	11	4883	 66
70	5	1189	 68
70,5	3	226	 66
76	3	611	 73
75,5	13	404	 72
74,5	56	576	 71
65	29	3096	 63
54	NA	23193 52


Summary of computational transaction
Raw Inputview raw input (R code)
Raw Outputview raw output of R engine
Computing time5 seconds
R Server'Gwilym Jenkins' @ 72.249.127.135

\begin{tabular}{lllllllll}
\hline
Summary of computational transaction \tabularnewline
Raw Input & view raw input (R code)  \tabularnewline
Raw Output & view raw output of R engine  \tabularnewline
Computing time & 5 seconds \tabularnewline
R Server & 'Gwilym Jenkins' @ 72.249.127.135 \tabularnewline
\hline
\end{tabular}
%Source: https://freestatistics.org/blog/index.php?pk=99234&T=0

[TABLE]
[ROW][C]Summary of computational transaction[/C][/ROW]
[ROW][C]Raw Input[/C][C]view raw input (R code) [/C][/ROW]
[ROW][C]Raw Output[/C][C]view raw output of R engine [/C][/ROW]
[ROW][C]Computing time[/C][C]5 seconds[/C][/ROW]
[ROW][C]R Server[/C][C]'Gwilym Jenkins' @ 72.249.127.135[/C][/ROW]
[/TABLE]
Source: https://freestatistics.org/blog/index.php?pk=99234&T=0

Globally Unique Identifier (entire table): ba.freestatistics.org/blog/index.php?pk=99234&T=0

As an alternative you can also use a QR Code:  

The GUIDs for individual cells are displayed in the table below:

Summary of computational transaction
Raw Inputview raw input (R code)
Raw Outputview raw output of R engine
Computing time5 seconds
R Server'Gwilym Jenkins' @ 72.249.127.135


Multiple Linear Regression - Estimated Regression Equation
Yt[t] = -6.07613317665566 + 0.000351314085121308X1t[t] + 9.30390784089718e-06X2t[t] + 1.13154878529155X4t[t] + e[t]

\begin{tabular}{lllllllll}
\hline
Multiple Linear Regression - Estimated Regression Equation \tabularnewline
Yt[t] =  -6.07613317665566 +  0.000351314085121308X1t[t] +  9.30390784089718e-06X2t[t] +  1.13154878529155X4t[t]  + e[t] \tabularnewline
\hline
\end{tabular}
%Source: https://freestatistics.org/blog/index.php?pk=99234&T=1

[TABLE]
[ROW][C]Multiple Linear Regression - Estimated Regression Equation[/C][/ROW]
[ROW][C]Yt[t] =  -6.07613317665566 +  0.000351314085121308X1t[t] +  9.30390784089718e-06X2t[t] +  1.13154878529155X4t[t]  + e[t][/C][/ROW]
[/TABLE]
Source: https://freestatistics.org/blog/index.php?pk=99234&T=1

Globally Unique Identifier (entire table): ba.freestatistics.org/blog/index.php?pk=99234&T=1

As an alternative you can also use a QR Code:  

The GUIDs for individual cells are displayed in the table below:

Multiple Linear Regression - Estimated Regression Equation
Yt[t] = -6.07613317665566 + 0.000351314085121308X1t[t] + 9.30390784089718e-06X2t[t] + 1.13154878529155X4t[t] + e[t]


Multiple Linear Regression - Ordinary Least Squares
VariableParameterS.D.T-STATH0: parameter = 02-tail p-value1-tail p-value
(Intercept)-6.076133176655662.006939-3.02760.0046790.002339
X1t0.0003513140851213080.0016060.21870.8281840.414092
X2t9.30390784089718e-063.4e-050.27570.7844520.392226
X4t1.131548785291550.02953838.30800

\begin{tabular}{lllllllll}
\hline
Multiple Linear Regression - Ordinary Least Squares \tabularnewline
Variable & Parameter & S.D. & T-STATH0: parameter = 0 & 2-tail p-value & 1-tail p-value \tabularnewline
(Intercept) & -6.07613317665566 & 2.006939 & -3.0276 & 0.004679 & 0.002339 \tabularnewline
X1t & 0.000351314085121308 & 0.001606 & 0.2187 & 0.828184 & 0.414092 \tabularnewline
X2t & 9.30390784089718e-06 & 3.4e-05 & 0.2757 & 0.784452 & 0.392226 \tabularnewline
X4t & 1.13154878529155 & 0.029538 & 38.308 & 0 & 0 \tabularnewline
\hline
\end{tabular}
%Source: https://freestatistics.org/blog/index.php?pk=99234&T=2

[TABLE]
[ROW][C]Multiple Linear Regression - Ordinary Least Squares[/C][/ROW]
[ROW][C]Variable[/C][C]Parameter[/C][C]S.D.[/C][C]T-STATH0: parameter = 0[/C][C]2-tail p-value[/C][C]1-tail p-value[/C][/ROW]
[ROW][C](Intercept)[/C][C]-6.07613317665566[/C][C]2.006939[/C][C]-3.0276[/C][C]0.004679[/C][C]0.002339[/C][/ROW]
[ROW][C]X1t[/C][C]0.000351314085121308[/C][C]0.001606[/C][C]0.2187[/C][C]0.828184[/C][C]0.414092[/C][/ROW]
[ROW][C]X2t[/C][C]9.30390784089718e-06[/C][C]3.4e-05[/C][C]0.2757[/C][C]0.784452[/C][C]0.392226[/C][/ROW]
[ROW][C]X4t[/C][C]1.13154878529155[/C][C]0.029538[/C][C]38.308[/C][C]0[/C][C]0[/C][/ROW]
[/TABLE]
Source: https://freestatistics.org/blog/index.php?pk=99234&T=2

Globally Unique Identifier (entire table): ba.freestatistics.org/blog/index.php?pk=99234&T=2

As an alternative you can also use a QR Code:  

The GUIDs for individual cells are displayed in the table below:

Multiple Linear Regression - Ordinary Least Squares
VariableParameterS.D.T-STATH0: parameter = 02-tail p-value1-tail p-value
(Intercept)-6.076133176655662.006939-3.02760.0046790.002339
X1t0.0003513140851213080.0016060.21870.8281840.414092
X2t9.30390784089718e-063.4e-050.27570.7844520.392226
X4t1.131548785291550.02953838.30800


Multiple Linear Regression - Regression Statistics
Multiple R0.993295841481829
R-squared0.986636628705095
Adjusted R-squared0.985457507708486
F-TEST (value)836.7560509416
F-TEST (DF numerator)3
F-TEST (DF denominator)34
p-value0
Multiple Linear Regression - Residual Statistics
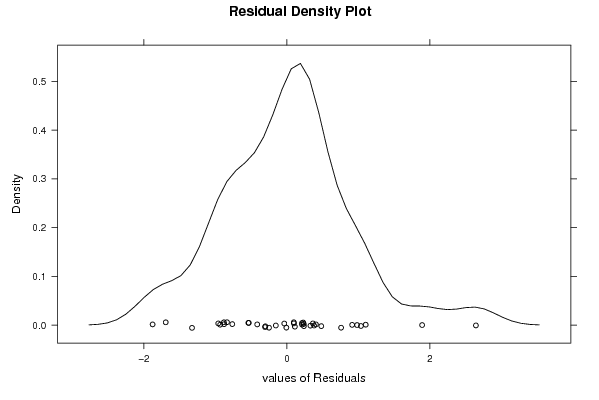
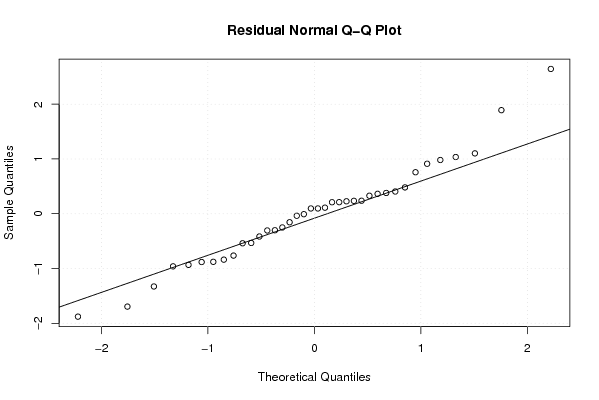
Residual Standard Deviation0.940888746055703
Sum Squared Residuals30.0992355034453

\begin{tabular}{lllllllll}
\hline
Multiple Linear Regression - Regression Statistics \tabularnewline
Multiple R & 0.993295841481829 \tabularnewline
R-squared & 0.986636628705095 \tabularnewline
Adjusted R-squared & 0.985457507708486 \tabularnewline
F-TEST (value) & 836.7560509416 \tabularnewline
F-TEST (DF numerator) & 3 \tabularnewline
F-TEST (DF denominator) & 34 \tabularnewline
p-value & 0 \tabularnewline
Multiple Linear Regression - Residual Statistics \tabularnewline
Residual Standard Deviation & 0.940888746055703 \tabularnewline
Sum Squared Residuals & 30.0992355034453 \tabularnewline
\hline
\end{tabular}
%Source: https://freestatistics.org/blog/index.php?pk=99234&T=3

[TABLE]
[ROW][C]Multiple Linear Regression - Regression Statistics[/C][/ROW]
[ROW][C]Multiple R[/C][C]0.993295841481829[/C][/ROW]
[ROW][C]R-squared[/C][C]0.986636628705095[/C][/ROW]
[ROW][C]Adjusted R-squared[/C][C]0.985457507708486[/C][/ROW]
[ROW][C]F-TEST (value)[/C][C]836.7560509416[/C][/ROW]
[ROW][C]F-TEST (DF numerator)[/C][C]3[/C][/ROW]
[ROW][C]F-TEST (DF denominator)[/C][C]34[/C][/ROW]
[ROW][C]p-value[/C][C]0[/C][/ROW]
[ROW][C]Multiple Linear Regression - Residual Statistics[/C][/ROW]
[ROW][C]Residual Standard Deviation[/C][C]0.940888746055703[/C][/ROW]
[ROW][C]Sum Squared Residuals[/C][C]30.0992355034453[/C][/ROW]
[/TABLE]
Source: https://freestatistics.org/blog/index.php?pk=99234&T=3

Globally Unique Identifier (entire table): ba.freestatistics.org/blog/index.php?pk=99234&T=3

As an alternative you can also use a QR Code:  

The GUIDs for individual cells are displayed in the table below:

Multiple Linear Regression - Regression Statistics
Multiple R0.993295841481829
R-squared0.986636628705095
Adjusted R-squared0.985457507708486
F-TEST (value)836.7560509416
F-TEST (DF numerator)3
F-TEST (DF denominator)34
p-value0
Multiple Linear Regression - Residual Statistics
Residual Standard Deviation0.940888746055703
Sum Squared Residuals30.0992355034453


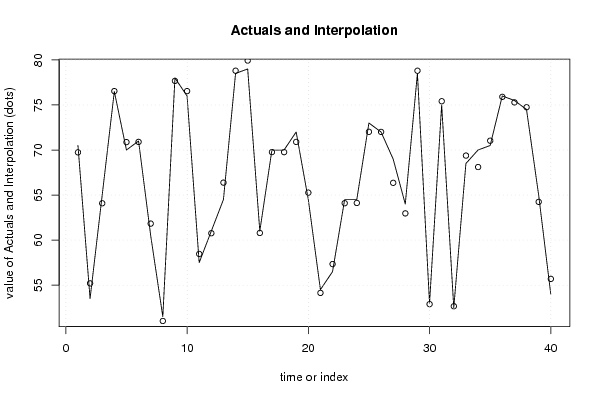
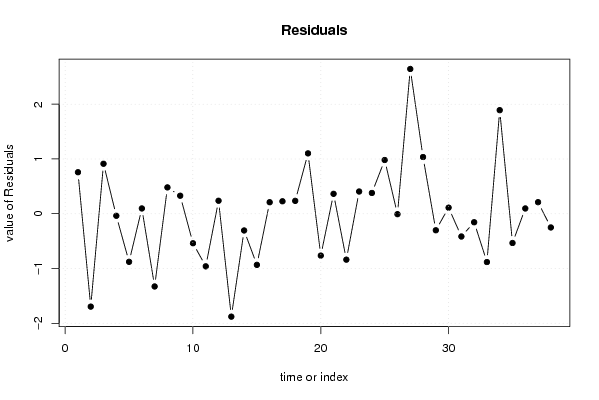
Multiple Linear Regression - Actuals, Interpolation, and Residuals
Time or IndexActualsInterpolationForecastResidualsPrediction Error
170.569.74248314011960.757516859880394
253.555.1955330616482-1.69553306164825
36564.08766064072410.912339359275858
476.576.5370779436952-0.0370779436951658
57070.8779771485924-0.877977148592454
67170.90328817299780.0967118270021877
760.561.8277948593442-1.32779485934420
851.551.01909833418520.480901665814824
97877.67136057599210.328639424007873
107676.5392814679536-0.539281467953644
1157.558.4605953609829-0.960595360982923
126160.76277681712310.237223182876914
1364.566.3789065982213-1.87890659822134
1478.578.8055434659722-0.305543465972182
157979.9335642389095-0.933564238909482
166160.78982056592590.210179434074092
177069.77269615144030.227303848559715
187069.76476779380760.235232206192423
197270.89795329749231.10204670250767
2064.565.2641558354083-0.764155835408272
2154.554.13635450101390.363645498986137
2256.557.3382391660209-0.838239166020916
2364.564.09426267897850.405737321021466
2464.564.12068790103820.379312098961809
257372.01890013354470.981099866455301
267272.0080417774551-0.00804177745512728
276966.35664084485832.64335915514174
286462.9646744175721.03532558242793
2978.578.80171846108-0.301718461080044
305352.8892479258660.110752074133976
317575.4155996861263-0.415599686126337
3252.552.6553820895101-0.155382089510121
3368.569.3820031400182-0.88200314001822
347068.10924327801411.89075672198591
3570.571.0336667795737-0.533666779573694
367675.90370522621030.0962947737897103
3775.575.28886321872760.211136781272411
3874.574.750433303856-0.250433303855969
3965NANA
4054NANA

\begin{tabular}{lllllllll}
\hline
Multiple Linear Regression - Actuals, Interpolation, and Residuals \tabularnewline
Time or Index & Actuals & InterpolationForecast & ResidualsPrediction Error \tabularnewline
1 & 70.5 & 69.7424831401196 & 0.757516859880394 \tabularnewline
2 & 53.5 & 55.1955330616482 & -1.69553306164825 \tabularnewline
3 & 65 & 64.0876606407241 & 0.912339359275858 \tabularnewline
4 & 76.5 & 76.5370779436952 & -0.0370779436951658 \tabularnewline
5 & 70 & 70.8779771485924 & -0.877977148592454 \tabularnewline
6 & 71 & 70.9032881729978 & 0.0967118270021877 \tabularnewline
7 & 60.5 & 61.8277948593442 & -1.32779485934420 \tabularnewline
8 & 51.5 & 51.0190983341852 & 0.480901665814824 \tabularnewline
9 & 78 & 77.6713605759921 & 0.328639424007873 \tabularnewline
10 & 76 & 76.5392814679536 & -0.539281467953644 \tabularnewline
11 & 57.5 & 58.4605953609829 & -0.960595360982923 \tabularnewline
12 & 61 & 60.7627768171231 & 0.237223182876914 \tabularnewline
13 & 64.5 & 66.3789065982213 & -1.87890659822134 \tabularnewline
14 & 78.5 & 78.8055434659722 & -0.305543465972182 \tabularnewline
15 & 79 & 79.9335642389095 & -0.933564238909482 \tabularnewline
16 & 61 & 60.7898205659259 & 0.210179434074092 \tabularnewline
17 & 70 & 69.7726961514403 & 0.227303848559715 \tabularnewline
18 & 70 & 69.7647677938076 & 0.235232206192423 \tabularnewline
19 & 72 & 70.8979532974923 & 1.10204670250767 \tabularnewline
20 & 64.5 & 65.2641558354083 & -0.764155835408272 \tabularnewline
21 & 54.5 & 54.1363545010139 & 0.363645498986137 \tabularnewline
22 & 56.5 & 57.3382391660209 & -0.838239166020916 \tabularnewline
23 & 64.5 & 64.0942626789785 & 0.405737321021466 \tabularnewline
24 & 64.5 & 64.1206879010382 & 0.379312098961809 \tabularnewline
25 & 73 & 72.0189001335447 & 0.981099866455301 \tabularnewline
26 & 72 & 72.0080417774551 & -0.00804177745512728 \tabularnewline
27 & 69 & 66.3566408448583 & 2.64335915514174 \tabularnewline
28 & 64 & 62.964674417572 & 1.03532558242793 \tabularnewline
29 & 78.5 & 78.80171846108 & -0.301718461080044 \tabularnewline
30 & 53 & 52.889247925866 & 0.110752074133976 \tabularnewline
31 & 75 & 75.4155996861263 & -0.415599686126337 \tabularnewline
32 & 52.5 & 52.6553820895101 & -0.155382089510121 \tabularnewline
33 & 68.5 & 69.3820031400182 & -0.88200314001822 \tabularnewline
34 & 70 & 68.1092432780141 & 1.89075672198591 \tabularnewline
35 & 70.5 & 71.0336667795737 & -0.533666779573694 \tabularnewline
36 & 76 & 75.9037052262103 & 0.0962947737897103 \tabularnewline
37 & 75.5 & 75.2888632187276 & 0.211136781272411 \tabularnewline
38 & 74.5 & 74.750433303856 & -0.250433303855969 \tabularnewline
39 & 65 & NA & NA \tabularnewline
40 & 54 & NA & NA \tabularnewline
\hline
\end{tabular}
%Source: https://freestatistics.org/blog/index.php?pk=99234&T=4

[TABLE]
[ROW][C]Multiple Linear Regression - Actuals, Interpolation, and Residuals[/C][/ROW]
[ROW][C]Time or Index[/C][C]Actuals[/C][C]InterpolationForecast[/C][C]ResidualsPrediction Error[/C][/ROW]
[ROW][C]1[/C][C]70.5[/C][C]69.7424831401196[/C][C]0.757516859880394[/C][/ROW]
[ROW][C]2[/C][C]53.5[/C][C]55.1955330616482[/C][C]-1.69553306164825[/C][/ROW]
[ROW][C]3[/C][C]65[/C][C]64.0876606407241[/C][C]0.912339359275858[/C][/ROW]
[ROW][C]4[/C][C]76.5[/C][C]76.5370779436952[/C][C]-0.0370779436951658[/C][/ROW]
[ROW][C]5[/C][C]70[/C][C]70.8779771485924[/C][C]-0.877977148592454[/C][/ROW]
[ROW][C]6[/C][C]71[/C][C]70.9032881729978[/C][C]0.0967118270021877[/C][/ROW]
[ROW][C]7[/C][C]60.5[/C][C]61.8277948593442[/C][C]-1.32779485934420[/C][/ROW]
[ROW][C]8[/C][C]51.5[/C][C]51.0190983341852[/C][C]0.480901665814824[/C][/ROW]
[ROW][C]9[/C][C]78[/C][C]77.6713605759921[/C][C]0.328639424007873[/C][/ROW]
[ROW][C]10[/C][C]76[/C][C]76.5392814679536[/C][C]-0.539281467953644[/C][/ROW]
[ROW][C]11[/C][C]57.5[/C][C]58.4605953609829[/C][C]-0.960595360982923[/C][/ROW]
[ROW][C]12[/C][C]61[/C][C]60.7627768171231[/C][C]0.237223182876914[/C][/ROW]
[ROW][C]13[/C][C]64.5[/C][C]66.3789065982213[/C][C]-1.87890659822134[/C][/ROW]
[ROW][C]14[/C][C]78.5[/C][C]78.8055434659722[/C][C]-0.305543465972182[/C][/ROW]
[ROW][C]15[/C][C]79[/C][C]79.9335642389095[/C][C]-0.933564238909482[/C][/ROW]
[ROW][C]16[/C][C]61[/C][C]60.7898205659259[/C][C]0.210179434074092[/C][/ROW]
[ROW][C]17[/C][C]70[/C][C]69.7726961514403[/C][C]0.227303848559715[/C][/ROW]
[ROW][C]18[/C][C]70[/C][C]69.7647677938076[/C][C]0.235232206192423[/C][/ROW]
[ROW][C]19[/C][C]72[/C][C]70.8979532974923[/C][C]1.10204670250767[/C][/ROW]
[ROW][C]20[/C][C]64.5[/C][C]65.2641558354083[/C][C]-0.764155835408272[/C][/ROW]
[ROW][C]21[/C][C]54.5[/C][C]54.1363545010139[/C][C]0.363645498986137[/C][/ROW]
[ROW][C]22[/C][C]56.5[/C][C]57.3382391660209[/C][C]-0.838239166020916[/C][/ROW]
[ROW][C]23[/C][C]64.5[/C][C]64.0942626789785[/C][C]0.405737321021466[/C][/ROW]
[ROW][C]24[/C][C]64.5[/C][C]64.1206879010382[/C][C]0.379312098961809[/C][/ROW]
[ROW][C]25[/C][C]73[/C][C]72.0189001335447[/C][C]0.981099866455301[/C][/ROW]
[ROW][C]26[/C][C]72[/C][C]72.0080417774551[/C][C]-0.00804177745512728[/C][/ROW]
[ROW][C]27[/C][C]69[/C][C]66.3566408448583[/C][C]2.64335915514174[/C][/ROW]
[ROW][C]28[/C][C]64[/C][C]62.964674417572[/C][C]1.03532558242793[/C][/ROW]
[ROW][C]29[/C][C]78.5[/C][C]78.80171846108[/C][C]-0.301718461080044[/C][/ROW]
[ROW][C]30[/C][C]53[/C][C]52.889247925866[/C][C]0.110752074133976[/C][/ROW]
[ROW][C]31[/C][C]75[/C][C]75.4155996861263[/C][C]-0.415599686126337[/C][/ROW]
[ROW][C]32[/C][C]52.5[/C][C]52.6553820895101[/C][C]-0.155382089510121[/C][/ROW]
[ROW][C]33[/C][C]68.5[/C][C]69.3820031400182[/C][C]-0.88200314001822[/C][/ROW]
[ROW][C]34[/C][C]70[/C][C]68.1092432780141[/C][C]1.89075672198591[/C][/ROW]
[ROW][C]35[/C][C]70.5[/C][C]71.0336667795737[/C][C]-0.533666779573694[/C][/ROW]
[ROW][C]36[/C][C]76[/C][C]75.9037052262103[/C][C]0.0962947737897103[/C][/ROW]
[ROW][C]37[/C][C]75.5[/C][C]75.2888632187276[/C][C]0.211136781272411[/C][/ROW]
[ROW][C]38[/C][C]74.5[/C][C]74.750433303856[/C][C]-0.250433303855969[/C][/ROW]
[ROW][C]39[/C][C]65[/C][C]NA[/C][C]NA[/C][/ROW]
[ROW][C]40[/C][C]54[/C][C]NA[/C][C]NA[/C][/ROW]
[/TABLE]
Source: https://freestatistics.org/blog/index.php?pk=99234&T=4

Globally Unique Identifier (entire table): ba.freestatistics.org/blog/index.php?pk=99234&T=4

As an alternative you can also use a QR Code:  

The GUIDs for individual cells are displayed in the table below:

Multiple Linear Regression - Actuals, Interpolation, and Residuals
Time or IndexActualsInterpolationForecastResidualsPrediction Error
170.569.74248314011960.757516859880394
253.555.1955330616482-1.69553306164825
36564.08766064072410.912339359275858
476.576.5370779436952-0.0370779436951658
57070.8779771485924-0.877977148592454
67170.90328817299780.0967118270021877
760.561.8277948593442-1.32779485934420
851.551.01909833418520.480901665814824
97877.67136057599210.328639424007873
107676.5392814679536-0.539281467953644
1157.558.4605953609829-0.960595360982923
126160.76277681712310.237223182876914
1364.566.3789065982213-1.87890659822134
1478.578.8055434659722-0.305543465972182
157979.9335642389095-0.933564238909482
166160.78982056592590.210179434074092
177069.77269615144030.227303848559715
187069.76476779380760.235232206192423
197270.89795329749231.10204670250767
2064.565.2641558354083-0.764155835408272
2154.554.13635450101390.363645498986137
2256.557.3382391660209-0.838239166020916
2364.564.09426267897850.405737321021466
2464.564.12068790103820.379312098961809
257372.01890013354470.981099866455301
267272.0080417774551-0.00804177745512728
276966.35664084485832.64335915514174
286462.9646744175721.03532558242793
2978.578.80171846108-0.301718461080044
305352.8892479258660.110752074133976
317575.4155996861263-0.415599686126337
3252.552.6553820895101-0.155382089510121
3368.569.3820031400182-0.88200314001822
347068.10924327801411.89075672198591
3570.571.0336667795737-0.533666779573694
367675.90370522621030.0962947737897103
3775.575.28886321872760.211136781272411
3874.574.750433303856-0.250433303855969
3965NANA
4054NANA


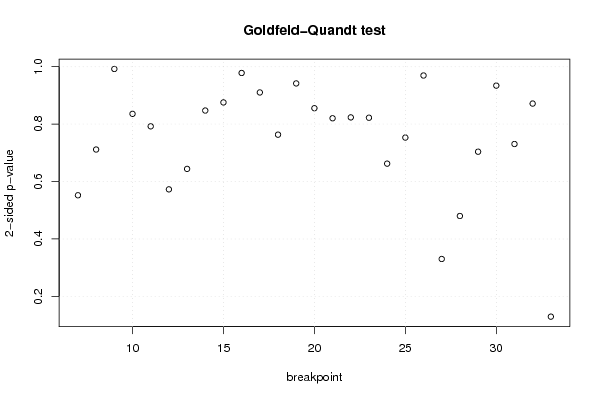
Goldfeld-Quandt test for Heteroskedasticity
p-valuesAlternative Hypothesis
breakpoint indexgreater2-sidedless
70.7239236554790750.552152689041850.276076344520925
80.6442823602290070.7114352795419870.355717639770993
90.5039388311063830.9921223377872330.496061168893617
100.4178830819857960.8357661639715910.582116918014204
110.3961690591243840.7923381182487680.603830940875616
120.286359216992090.572718433984180.71364078300791
130.6780098972672880.6439802054654230.321990102732712
140.5763664750359250.847267049928150.423633524964075
150.5622397423540770.8755205152918450.437760257645923
160.4890384402585690.9780768805171380.510961559741431
170.4551546553831440.9103093107662870.544845344616856
180.3816289011292230.7632578022584470.618371098870776
190.4708488943198220.9416977886396430.529151105680178
200.4276764161510100.8553528323020190.57232358384899
210.4101791603106920.8203583206213840.589820839689308
220.5882972065131980.8234055869736050.411702793486802
230.5889159368800920.8221681262398150.411084063119908
240.668855882901040.662288234197920.33114411709896
250.6234416900583230.7531166198833530.376558309941677
260.5153384766029090.9693230467941830.484661523397091
270.8349014655027650.330197068994470.165098534497235
280.7600177258561180.4799645482877640.239982274143882
290.6480717008527890.7038565982944220.351928299147211
300.5329500061067340.9340999877865310.467049993893265
310.3653342997125120.7306685994250250.634665700287488
320.5642397181995080.8715205636009850.435760281800492
330.9353284556711350.1293430886577290.0646715443288645

\begin{tabular}{lllllllll}
\hline
Goldfeld-Quandt test for Heteroskedasticity \tabularnewline
p-values & Alternative Hypothesis \tabularnewline
breakpoint index & greater & 2-sided & less \tabularnewline
7 & 0.723923655479075 & 0.55215268904185 & 0.276076344520925 \tabularnewline
8 & 0.644282360229007 & 0.711435279541987 & 0.355717639770993 \tabularnewline
9 & 0.503938831106383 & 0.992122337787233 & 0.496061168893617 \tabularnewline
10 & 0.417883081985796 & 0.835766163971591 & 0.582116918014204 \tabularnewline
11 & 0.396169059124384 & 0.792338118248768 & 0.603830940875616 \tabularnewline
12 & 0.28635921699209 & 0.57271843398418 & 0.71364078300791 \tabularnewline
13 & 0.678009897267288 & 0.643980205465423 & 0.321990102732712 \tabularnewline
14 & 0.576366475035925 & 0.84726704992815 & 0.423633524964075 \tabularnewline
15 & 0.562239742354077 & 0.875520515291845 & 0.437760257645923 \tabularnewline
16 & 0.489038440258569 & 0.978076880517138 & 0.510961559741431 \tabularnewline
17 & 0.455154655383144 & 0.910309310766287 & 0.544845344616856 \tabularnewline
18 & 0.381628901129223 & 0.763257802258447 & 0.618371098870776 \tabularnewline
19 & 0.470848894319822 & 0.941697788639643 & 0.529151105680178 \tabularnewline
20 & 0.427676416151010 & 0.855352832302019 & 0.57232358384899 \tabularnewline
21 & 0.410179160310692 & 0.820358320621384 & 0.589820839689308 \tabularnewline
22 & 0.588297206513198 & 0.823405586973605 & 0.411702793486802 \tabularnewline
23 & 0.588915936880092 & 0.822168126239815 & 0.411084063119908 \tabularnewline
24 & 0.66885588290104 & 0.66228823419792 & 0.33114411709896 \tabularnewline
25 & 0.623441690058323 & 0.753116619883353 & 0.376558309941677 \tabularnewline
26 & 0.515338476602909 & 0.969323046794183 & 0.484661523397091 \tabularnewline
27 & 0.834901465502765 & 0.33019706899447 & 0.165098534497235 \tabularnewline
28 & 0.760017725856118 & 0.479964548287764 & 0.239982274143882 \tabularnewline
29 & 0.648071700852789 & 0.703856598294422 & 0.351928299147211 \tabularnewline
30 & 0.532950006106734 & 0.934099987786531 & 0.467049993893265 \tabularnewline
31 & 0.365334299712512 & 0.730668599425025 & 0.634665700287488 \tabularnewline
32 & 0.564239718199508 & 0.871520563600985 & 0.435760281800492 \tabularnewline
33 & 0.935328455671135 & 0.129343088657729 & 0.0646715443288645 \tabularnewline
\hline
\end{tabular}
%Source: https://freestatistics.org/blog/index.php?pk=99234&T=5

[TABLE]
[ROW][C]Goldfeld-Quandt test for Heteroskedasticity[/C][/ROW]
[ROW][C]p-values[/C][C]Alternative Hypothesis[/C][/ROW]
[ROW][C]breakpoint index[/C][C]greater[/C][C]2-sided[/C][C]less[/C][/ROW]
[ROW][C]7[/C][C]0.723923655479075[/C][C]0.55215268904185[/C][C]0.276076344520925[/C][/ROW]
[ROW][C]8[/C][C]0.644282360229007[/C][C]0.711435279541987[/C][C]0.355717639770993[/C][/ROW]
[ROW][C]9[/C][C]0.503938831106383[/C][C]0.992122337787233[/C][C]0.496061168893617[/C][/ROW]
[ROW][C]10[/C][C]0.417883081985796[/C][C]0.835766163971591[/C][C]0.582116918014204[/C][/ROW]
[ROW][C]11[/C][C]0.396169059124384[/C][C]0.792338118248768[/C][C]0.603830940875616[/C][/ROW]
[ROW][C]12[/C][C]0.28635921699209[/C][C]0.57271843398418[/C][C]0.71364078300791[/C][/ROW]
[ROW][C]13[/C][C]0.678009897267288[/C][C]0.643980205465423[/C][C]0.321990102732712[/C][/ROW]
[ROW][C]14[/C][C]0.576366475035925[/C][C]0.84726704992815[/C][C]0.423633524964075[/C][/ROW]
[ROW][C]15[/C][C]0.562239742354077[/C][C]0.875520515291845[/C][C]0.437760257645923[/C][/ROW]
[ROW][C]16[/C][C]0.489038440258569[/C][C]0.978076880517138[/C][C]0.510961559741431[/C][/ROW]
[ROW][C]17[/C][C]0.455154655383144[/C][C]0.910309310766287[/C][C]0.544845344616856[/C][/ROW]
[ROW][C]18[/C][C]0.381628901129223[/C][C]0.763257802258447[/C][C]0.618371098870776[/C][/ROW]
[ROW][C]19[/C][C]0.470848894319822[/C][C]0.941697788639643[/C][C]0.529151105680178[/C][/ROW]
[ROW][C]20[/C][C]0.427676416151010[/C][C]0.855352832302019[/C][C]0.57232358384899[/C][/ROW]
[ROW][C]21[/C][C]0.410179160310692[/C][C]0.820358320621384[/C][C]0.589820839689308[/C][/ROW]
[ROW][C]22[/C][C]0.588297206513198[/C][C]0.823405586973605[/C][C]0.411702793486802[/C][/ROW]
[ROW][C]23[/C][C]0.588915936880092[/C][C]0.822168126239815[/C][C]0.411084063119908[/C][/ROW]
[ROW][C]24[/C][C]0.66885588290104[/C][C]0.66228823419792[/C][C]0.33114411709896[/C][/ROW]
[ROW][C]25[/C][C]0.623441690058323[/C][C]0.753116619883353[/C][C]0.376558309941677[/C][/ROW]
[ROW][C]26[/C][C]0.515338476602909[/C][C]0.969323046794183[/C][C]0.484661523397091[/C][/ROW]
[ROW][C]27[/C][C]0.834901465502765[/C][C]0.33019706899447[/C][C]0.165098534497235[/C][/ROW]
[ROW][C]28[/C][C]0.760017725856118[/C][C]0.479964548287764[/C][C]0.239982274143882[/C][/ROW]
[ROW][C]29[/C][C]0.648071700852789[/C][C]0.703856598294422[/C][C]0.351928299147211[/C][/ROW]
[ROW][C]30[/C][C]0.532950006106734[/C][C]0.934099987786531[/C][C]0.467049993893265[/C][/ROW]
[ROW][C]31[/C][C]0.365334299712512[/C][C]0.730668599425025[/C][C]0.634665700287488[/C][/ROW]
[ROW][C]32[/C][C]0.564239718199508[/C][C]0.871520563600985[/C][C]0.435760281800492[/C][/ROW]
[ROW][C]33[/C][C]0.935328455671135[/C][C]0.129343088657729[/C][C]0.0646715443288645[/C][/ROW]
[/TABLE]
Source: https://freestatistics.org/blog/index.php?pk=99234&T=5

Globally Unique Identifier (entire table): ba.freestatistics.org/blog/index.php?pk=99234&T=5

As an alternative you can also use a QR Code:  

The GUIDs for individual cells are displayed in the table below:

Goldfeld-Quandt test for Heteroskedasticity
p-valuesAlternative Hypothesis
breakpoint indexgreater2-sidedless
70.7239236554790750.552152689041850.276076344520925
80.6442823602290070.7114352795419870.355717639770993
90.5039388311063830.9921223377872330.496061168893617
100.4178830819857960.8357661639715910.582116918014204
110.3961690591243840.7923381182487680.603830940875616
120.286359216992090.572718433984180.71364078300791
130.6780098972672880.6439802054654230.321990102732712
140.5763664750359250.847267049928150.423633524964075
150.5622397423540770.8755205152918450.437760257645923
160.4890384402585690.9780768805171380.510961559741431
170.4551546553831440.9103093107662870.544845344616856
180.3816289011292230.7632578022584470.618371098870776
190.4708488943198220.9416977886396430.529151105680178
200.4276764161510100.8553528323020190.57232358384899
210.4101791603106920.8203583206213840.589820839689308
220.5882972065131980.8234055869736050.411702793486802
230.5889159368800920.8221681262398150.411084063119908
240.668855882901040.662288234197920.33114411709896
250.6234416900583230.7531166198833530.376558309941677
260.5153384766029090.9693230467941830.484661523397091
270.8349014655027650.330197068994470.165098534497235
280.7600177258561180.4799645482877640.239982274143882
290.6480717008527890.7038565982944220.351928299147211
300.5329500061067340.9340999877865310.467049993893265
310.3653342997125120.7306685994250250.634665700287488
320.5642397181995080.8715205636009850.435760281800492
330.9353284556711350.1293430886577290.0646715443288645


Meta Analysis of Goldfeld-Quandt test for Heteroskedasticity
Description# significant tests% significant testsOK/NOK
1% type I error level00OK
5% type I error level00OK
10% type I error level00OK

\begin{tabular}{lllllllll}
\hline
Meta Analysis of Goldfeld-Quandt test for Heteroskedasticity \tabularnewline
Description & # significant tests & % significant tests & OK/NOK \tabularnewline
1% type I error level & 0 & 0 & OK \tabularnewline
5% type I error level & 0 & 0 & OK \tabularnewline
10% type I error level & 0 & 0 & OK \tabularnewline
\hline
\end{tabular}
%Source: https://freestatistics.org/blog/index.php?pk=99234&T=6

[TABLE]
[ROW][C]Meta Analysis of Goldfeld-Quandt test for Heteroskedasticity[/C][/ROW]
[ROW][C]Description[/C][C]# significant tests[/C][C]% significant tests[/C][C]OK/NOK[/C][/ROW]
[ROW][C]1% type I error level[/C][C]0[/C][C]0[/C][C]OK[/C][/ROW]
[ROW][C]5% type I error level[/C][C]0[/C][C]0[/C][C]OK[/C][/ROW]
[ROW][C]10% type I error level[/C][C]0[/C][C]0[/C][C]OK[/C][/ROW]
[/TABLE]
Source: https://freestatistics.org/blog/index.php?pk=99234&T=6

Globally Unique Identifier (entire table): ba.freestatistics.org/blog/index.php?pk=99234&T=6

As an alternative you can also use a QR Code:  

The GUIDs for individual cells are displayed in the table below:

Meta Analysis of Goldfeld-Quandt test for Heteroskedasticity
Description# significant tests% significant testsOK/NOK
1% type I error level00OK
5% type I error level00OK
10% type I error level00OK


Parameters (Session):
par1 = 1 ; par2 = Do not include Seasonal Dummies ; par3 = No Linear Trend ;
Parameters (R input):
par1 = 1 ; par2 = Do not include Seasonal Dummies ; par3 = No Linear Trend ;
R code (references can be found in the software module):
library(lattice)
library(lmtest)
n25 <- 25 #minimum number of obs. for Goldfeld-Quandt test
par1 <- as.numeric(par1)
x <- t(y)
k <- length(x[1,])
n <- length(x[,1])
x1 <- cbind(x[,par1], x[,1:k!=par1])
mycolnames <- c(colnames(x)[par1], colnames(x)[1:k!=par1])
colnames(x1) <- mycolnames #colnames(x)[par1]
x <- x1
if (par3 == 'First Differences'){
x2 <- array(0, dim=c(n-1,k), dimnames=list(1:(n-1), paste('(1-B)',colnames(x),sep='')))
for (i in 1:n-1) {
for (j in 1:k) {
x2[i,j] <- x[i+1,j] - x[i,j]
}
}
x <- x2
}
if (par2 == 'Include Monthly Dummies'){
x2 <- array(0, dim=c(n,11), dimnames=list(1:n, paste('M', seq(1:11), sep ='')))
for (i in 1:11){
x2[seq(i,n,12),i] <- 1
}
x <- cbind(x, x2)
}
if (par2 == 'Include Quarterly Dummies'){
x2 <- array(0, dim=c(n,3), dimnames=list(1:n, paste('Q', seq(1:3), sep ='')))
for (i in 1:3){
x2[seq(i,n,4),i] <- 1
}
x <- cbind(x, x2)
}
k <- length(x[1,])
if (par3 == 'Linear Trend'){
x <- cbind(x, c(1:n))
colnames(x)[k+1] <- 't'
}
x
k <- length(x[1,])
df <- as.data.frame(x)
(mylm <- lm(df))
(mysum <- summary(mylm))
if (n > n25) {
kp3 <- k + 3
nmkm3 <- n - k - 3
gqarr <- array(NA, dim=c(nmkm3-kp3+1,3))
numgqtests <- 0
numsignificant1 <- 0
numsignificant5 <- 0
numsignificant10 <- 0
for (mypoint in kp3:nmkm3) {
j <- 0
numgqtests <- numgqtests + 1
for (myalt in c('greater', 'two.sided', 'less')) {
j <- j + 1
gqarr[mypoint-kp3+1,j] <- gqtest(mylm, point=mypoint, alternative=myalt)$p.value
}
if (gqarr[mypoint-kp3+1,2] < 0.01) numsignificant1 <- numsignificant1 + 1
if (gqarr[mypoint-kp3+1,2] < 0.05) numsignificant5 <- numsignificant5 + 1
if (gqarr[mypoint-kp3+1,2] < 0.10) numsignificant10 <- numsignificant10 + 1
}
gqarr
}
bitmap(file='test0.png')
plot(x[,1], type='l', main='Actuals and Interpolation', ylab='value of Actuals and Interpolation (dots)', xlab='time or index')
points(x[,1]-mysum$resid)
grid()
dev.off()
bitmap(file='test1.png')
plot(mysum$resid, type='b', pch=19, main='Residuals', ylab='value of Residuals', xlab='time or index')
grid()
dev.off()
bitmap(file='test2.png')
hist(mysum$resid, main='Residual Histogram', xlab='values of Residuals')
grid()
dev.off()
bitmap(file='test3.png')
densityplot(~mysum$resid,col='black',main='Residual Density Plot', xlab='values of Residuals')
dev.off()
bitmap(file='test4.png')
qqnorm(mysum$resid, main='Residual Normal Q-Q Plot')
qqline(mysum$resid)
grid()
dev.off()
(myerror <- as.ts(mysum$resid))
bitmap(file='test5.png')
dum <- cbind(lag(myerror,k=1),myerror)
dum
dum1 <- dum[2:length(myerror),]
dum1
z <- as.data.frame(dum1)
z
plot(z,main=paste('Residual Lag plot, lowess, and regression line'), ylab='values of Residuals', xlab='lagged values of Residuals')
lines(lowess(z))
abline(lm(z))
grid()
dev.off()
bitmap(file='test6.png')
acf(mysum$resid, lag.max=length(mysum$resid)/2, main='Residual Autocorrelation Function')
grid()
dev.off()
bitmap(file='test7.png')
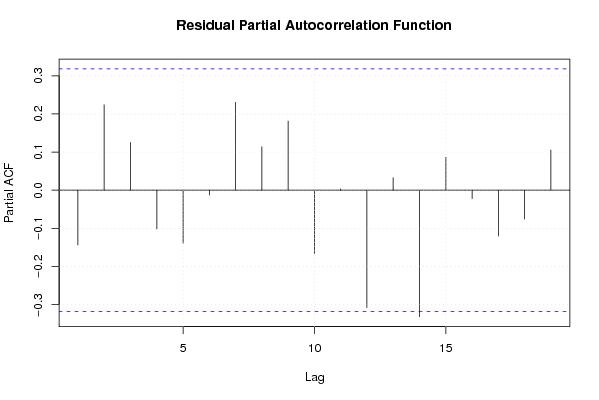
pacf(mysum$resid, lag.max=length(mysum$resid)/2, main='Residual Partial Autocorrelation Function')
grid()
dev.off()
bitmap(file='test8.png')
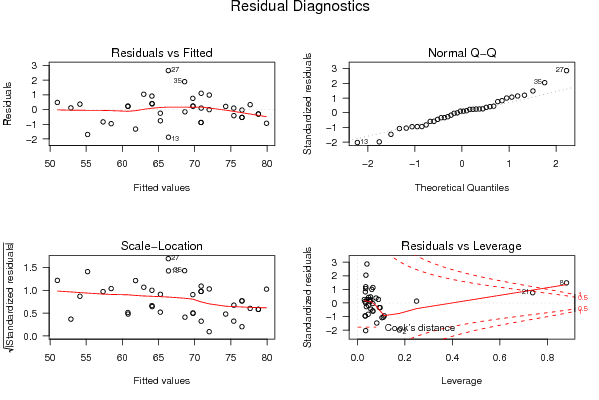
opar <- par(mfrow = c(2,2), oma = c(0, 0, 1.1, 0))
plot(mylm, las = 1, sub='Residual Diagnostics')
par(opar)
dev.off()
if (n > n25) {
bitmap(file='test9.png')
plot(kp3:nmkm3,gqarr[,2], main='Goldfeld-Quandt test',ylab='2-sided p-value',xlab='breakpoint')
grid()
dev.off()
}
load(file='createtable')
a<-table.start()
a<-table.row.start(a)
a<-table.element(a, 'Multiple Linear Regression - Estimated Regression Equation', 1, TRUE)
a<-table.row.end(a)
myeq <- colnames(x)[1]
myeq <- paste(myeq, '[t] = ', sep='')
for (i in 1:k){
if (mysum$coefficients[i,1] > 0) myeq <- paste(myeq, '+', '')
myeq <- paste(myeq, mysum$coefficients[i,1], sep=' ')
if (rownames(mysum$coefficients)[i] != '(Intercept)') {
myeq <- paste(myeq, rownames(mysum$coefficients)[i], sep='')
if (rownames(mysum$coefficients)[i] != 't') myeq <- paste(myeq, '[t]', sep='')
}
}
myeq <- paste(myeq, ' + e[t]')
a<-table.row.start(a)
a<-table.element(a, myeq)
a<-table.row.end(a)
a<-table.end(a)
table.save(a,file='mytable1.tab')
a<-table.start()
a<-table.row.start(a)
a<-table.element(a,hyperlink('ols1.htm','Multiple Linear Regression - Ordinary Least Squares',''), 6, TRUE)
a<-table.row.end(a)
a<-table.row.start(a)
a<-table.element(a,'Variable',header=TRUE)
a<-table.element(a,'Parameter',header=TRUE)
a<-table.element(a,'S.D.',header=TRUE)
a<-table.element(a,'T-STAT
H0: parameter = 0',header=TRUE)
a<-table.element(a,'2-tail p-value',header=TRUE)
a<-table.element(a,'1-tail p-value',header=TRUE)
a<-table.row.end(a)
for (i in 1:k){
a<-table.row.start(a)
a<-table.element(a,rownames(mysum$coefficients)[i],header=TRUE)
a<-table.element(a,mysum$coefficients[i,1])
a<-table.element(a, round(mysum$coefficients[i,2],6))
a<-table.element(a, round(mysum$coefficients[i,3],4))
a<-table.element(a, round(mysum$coefficients[i,4],6))
a<-table.element(a, round(mysum$coefficients[i,4]/2,6))
a<-table.row.end(a)
}
a<-table.end(a)
table.save(a,file='mytable2.tab')
a<-table.start()
a<-table.row.start(a)
a<-table.element(a, 'Multiple Linear Regression - Regression Statistics', 2, TRUE)
a<-table.row.end(a)
a<-table.row.start(a)
a<-table.element(a, 'Multiple R',1,TRUE)
a<-table.element(a, sqrt(mysum$r.squared))
a<-table.row.end(a)
a<-table.row.start(a)
a<-table.element(a, 'R-squared',1,TRUE)
a<-table.element(a, mysum$r.squared)
a<-table.row.end(a)
a<-table.row.start(a)
a<-table.element(a, 'Adjusted R-squared',1,TRUE)
a<-table.element(a, mysum$adj.r.squared)
a<-table.row.end(a)
a<-table.row.start(a)
a<-table.element(a, 'F-TEST (value)',1,TRUE)
a<-table.element(a, mysum$fstatistic[1])
a<-table.row.end(a)
a<-table.row.start(a)
a<-table.element(a, 'F-TEST (DF numerator)',1,TRUE)
a<-table.element(a, mysum$fstatistic[2])
a<-table.row.end(a)
a<-table.row.start(a)
a<-table.element(a, 'F-TEST (DF denominator)',1,TRUE)
a<-table.element(a, mysum$fstatistic[3])
a<-table.row.end(a)
a<-table.row.start(a)
a<-table.element(a, 'p-value',1,TRUE)
a<-table.element(a, 1-pf(mysum$fstatistic[1],mysum$fstatistic[2],mysum$fstatistic[3]))
a<-table.row.end(a)
a<-table.row.start(a)
a<-table.element(a, 'Multiple Linear Regression - Residual Statistics', 2, TRUE)
a<-table.row.end(a)
a<-table.row.start(a)
a<-table.element(a, 'Residual Standard Deviation',1,TRUE)
a<-table.element(a, mysum$sigma)
a<-table.row.end(a)
a<-table.row.start(a)
a<-table.element(a, 'Sum Squared Residuals',1,TRUE)
a<-table.element(a, sum(myerror*myerror))
a<-table.row.end(a)
a<-table.end(a)
table.save(a,file='mytable3.tab')
a<-table.start()
a<-table.row.start(a)
a<-table.element(a, 'Multiple Linear Regression - Actuals, Interpolation, and Residuals', 4, TRUE)
a<-table.row.end(a)
a<-table.row.start(a)
a<-table.element(a, 'Time or Index', 1, TRUE)
a<-table.element(a, 'Actuals', 1, TRUE)
a<-table.element(a, 'Interpolation
Forecast', 1, TRUE)
a<-table.element(a, 'Residuals
Prediction Error', 1, TRUE)
a<-table.row.end(a)
for (i in 1:n) {
a<-table.row.start(a)
a<-table.element(a,i, 1, TRUE)
a<-table.element(a,x[i])
a<-table.element(a,x[i]-mysum$resid[i])
a<-table.element(a,mysum$resid[i])
a<-table.row.end(a)
}
a<-table.end(a)
table.save(a,file='mytable4.tab')
if (n > n25) {
a<-table.start()
a<-table.row.start(a)
a<-table.element(a,'Goldfeld-Quandt test for Heteroskedasticity',4,TRUE)
a<-table.row.end(a)
a<-table.row.start(a)
a<-table.element(a,'p-values',header=TRUE)
a<-table.element(a,'Alternative Hypothesis',3,header=TRUE)
a<-table.row.end(a)
a<-table.row.start(a)
a<-table.element(a,'breakpoint index',header=TRUE)
a<-table.element(a,'greater',header=TRUE)
a<-table.element(a,'2-sided',header=TRUE)
a<-table.element(a,'less',header=TRUE)
a<-table.row.end(a)
for (mypoint in kp3:nmkm3) {
a<-table.row.start(a)
a<-table.element(a,mypoint,header=TRUE)
a<-table.element(a,gqarr[mypoint-kp3+1,1])
a<-table.element(a,gqarr[mypoint-kp3+1,2])
a<-table.element(a,gqarr[mypoint-kp3+1,3])
a<-table.row.end(a)
}
a<-table.end(a)
table.save(a,file='mytable5.tab')
a<-table.start()
a<-table.row.start(a)
a<-table.element(a,'Meta Analysis of Goldfeld-Quandt test for Heteroskedasticity',4,TRUE)
a<-table.row.end(a)
a<-table.row.start(a)
a<-table.element(a,'Description',header=TRUE)
a<-table.element(a,'# significant tests',header=TRUE)
a<-table.element(a,'% significant tests',header=TRUE)
a<-table.element(a,'OK/NOK',header=TRUE)
a<-table.row.end(a)
a<-table.row.start(a)
a<-table.element(a,'1% type I error level',header=TRUE)
a<-table.element(a,numsignificant1)
a<-table.element(a,numsignificant1/numgqtests)
if (numsignificant1/numgqtests < 0.01) dum <- 'OK' else dum <- 'NOK'
a<-table.element(a,dum)
a<-table.row.end(a)
a<-table.row.start(a)
a<-table.element(a,'5% type I error level',header=TRUE)
a<-table.element(a,numsignificant5)
a<-table.element(a,numsignificant5/numgqtests)
if (numsignificant5/numgqtests < 0.05) dum <- 'OK' else dum <- 'NOK'
a<-table.element(a,dum)
a<-table.row.end(a)
a<-table.row.start(a)
a<-table.element(a,'10% type I error level',header=TRUE)
a<-table.element(a,numsignificant10)
a<-table.element(a,numsignificant10/numgqtests)
if (numsignificant10/numgqtests < 0.1) dum <- 'OK' else dum <- 'NOK'
a<-table.element(a,dum)
a<-table.row.end(a)
a<-table.end(a)
table.save(a,file='mytable6.tab')
}