| Multiple Linear Regression - Estimated Regression Equation |
| Yt[t] = + 6.82028397111565 -0.000866398623699218X1t[t] -2.24244160966131e-05X2t[t] + 0.8684484666401X3t[t] + e[t] |
| Multiple Linear Regression - Ordinary Least Squares | |||||
| Variable | Parameter | S.D. | T-STAT H0: parameter = 0 | 2-tail p-value | 1-tail p-value |
| (Intercept) | 6.82028397111565 | 1.27091 | 5.3665 | 6e-06 | 3e-06 |
| X1t | -0.000866398623699218 | 0.001219 | -0.7109 | 0.481999 | 0.241 |
| X2t | -2.24244160966131e-05 | 2.6e-05 | -0.8788 | 0.385678 | 0.192839 |
| X3t | 0.8684484666401 | 0.017233 | 50.3953 | 0 | 0 |
| Multiple Linear Regression - Regression Statistics | |
| Multiple R | 0.996094246400062 |
| R-squared | 0.992203747711308 |
| Adjusted R-squared | 0.9915158430976 |
| F-TEST (value) | 1442.35658249604 |
| F-TEST (DF numerator) | 3 |
| F-TEST (DF denominator) | 34 |
| p-value | 0 |
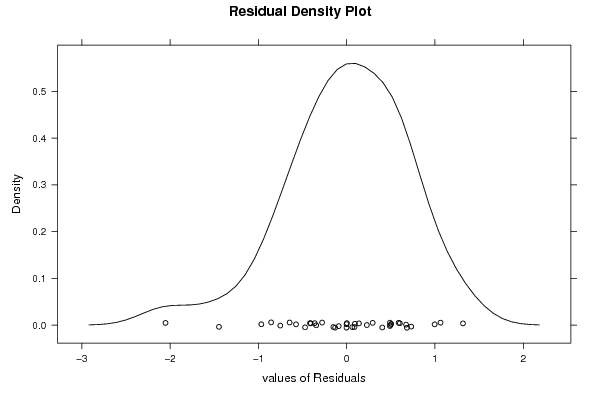
| Multiple Linear Regression - Residual Statistics | |
| Residual Standard Deviation | 0.718659545870548 |
| Sum Squared Residuals | 17.5600324576093 |
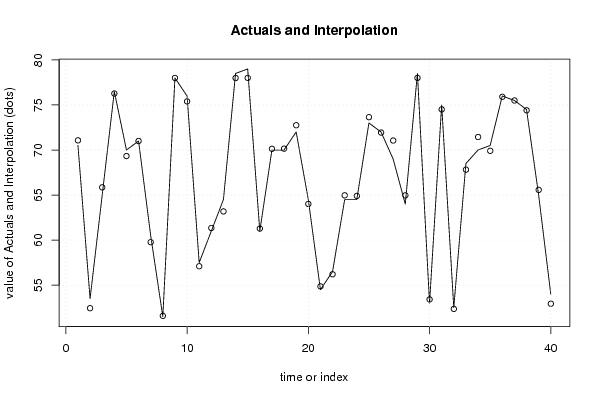
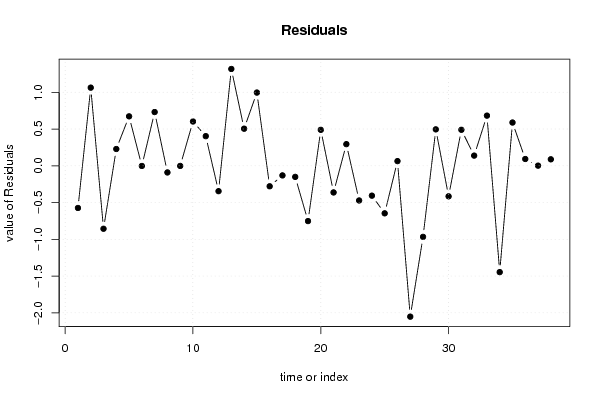
| Multiple Linear Regression - Actuals, Interpolation, and Residuals | |||
| Time or Index | Actuals | Interpolation Forecast | Residuals Prediction Error |
| 1 | 70.5 | 71.0737078740322 | -0.573707874032242 |
| 2 | 53.5 | 52.4368681869239 | 1.06313181307607 |
| 3 | 65 | 65.8559758075375 | -0.855975807537503 |
| 4 | 76.5 | 76.2713639628933 | 0.228636037106703 |
| 5 | 70 | 69.3272234806631 | 0.672776519336934 |
| 6 | 71 | 71.00217191019 | -0.00217191018997663 |
| 7 | 60.5 | 59.7688310164907 | 0.731168983509307 |
| 8 | 51.5 | 51.5901751012184 | -0.0901751012183532 |
| 9 | 78 | 78.0014948317007 | -0.00149483170065552 |
| 10 | 76 | 75.3974276234979 | 0.602572376502134 |
| 11 | 57.5 | 57.0967627646239 | 0.403237235376100 |
| 12 | 61 | 61.3451976641236 | -0.345197664123567 |
| 13 | 64.5 | 63.182413281416 | 1.31758671858406 |
| 14 | 78.5 | 77.9949101989527 | 0.505089801047311 |
| 15 | 79 | 78.0038065909743 | 0.996193409025652 |
| 16 | 61 | 61.278601172991 | -0.278601172991058 |
| 17 | 70 | 70.1307491257542 | -0.130749125754203 |
| 18 | 70 | 70.1506640757226 | -0.150664075722629 |
| 19 | 72 | 72.7517304769411 | -0.751730476941061 |
| 20 | 64.5 | 64.0104142186257 | 0.489585781374291 |
| 21 | 54.5 | 54.8623410276346 | -0.362341027634558 |
| 22 | 56.5 | 56.2055881504189 | 0.294411849581139 |
| 23 | 64.5 | 64.9714184485163 | -0.471418448516340 |
| 24 | 64.5 | 64.9062734272221 | -0.406273427222152 |
| 25 | 73 | 73.6462626363526 | -0.646262636352633 |
| 26 | 72 | 71.9361853287829 | 0.0638146712171233 |
| 27 | 69 | 71.0519378227556 | -2.05193782275558 |
| 28 | 64 | 64.9667521335721 | -0.966752133572135 |
| 29 | 78.5 | 78.004365156961 | 0.495634843038977 |
| 30 | 53 | 53.4151475793234 | -0.415147579323424 |
| 31 | 75 | 74.5099000515518 | 0.490099948448232 |
| 32 | 52.5 | 52.3610962939022 | 0.13890370609777 |
| 33 | 68.5 | 67.8175789453454 | 0.682421054654587 |
| 34 | 70 | 71.4462518552141 | -1.44625185521415 |
| 35 | 70.5 | 69.9114123215773 | 0.588587678422653 |
| 36 | 76 | 75.9073901894724 | 0.0926098105276465 |
| 37 | 75.5 | 75.4978295824446 | 0.00217041755543008 |
| 38 | 74.5 | 74.4117796836799 | 0.0882203163201044 |
| 39 | 65 | NA | NA |
| 40 | 54 | NA | NA |
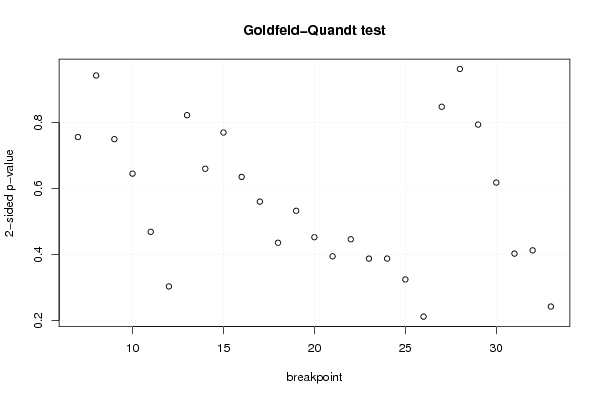
| Goldfeld-Quandt test for Heteroskedasticity | |||
| p-values | Alternative Hypothesis | ||
| breakpoint index | greater | 2-sided | less |
| 7 | 0.621894094170813 | 0.756211811658375 | 0.378105905829187 |
| 8 | 0.52871442530158 | 0.94257114939684 | 0.47128557469842 |
| 9 | 0.374890371930587 | 0.749780743861175 | 0.625109628069413 |
| 10 | 0.322707912173717 | 0.645415824347434 | 0.677292087826283 |
| 11 | 0.234625507693694 | 0.469251015387387 | 0.765374492306306 |
| 12 | 0.151984630045675 | 0.30396926009135 | 0.848015369954325 |
| 13 | 0.411222745948324 | 0.822445491896648 | 0.588777254051676 |
| 14 | 0.330092852410479 | 0.660185704820958 | 0.669907147589521 |
| 15 | 0.384971540309098 | 0.769943080618195 | 0.615028459690902 |
| 16 | 0.317732558481503 | 0.635465116963007 | 0.682267441518497 |
| 17 | 0.280322108993283 | 0.560644217986565 | 0.719677891006717 |
| 18 | 0.218036052296975 | 0.436072104593951 | 0.781963947703025 |
| 19 | 0.266439376764272 | 0.532878753528544 | 0.733560623235728 |
| 20 | 0.226482968770494 | 0.452965937540988 | 0.773517031229506 |
| 21 | 0.197543589988722 | 0.395087179977444 | 0.802456410011278 |
| 22 | 0.223310002933222 | 0.446620005866444 | 0.776689997066778 |
| 23 | 0.19401898003312 | 0.38803796006624 | 0.80598101996688 |
| 24 | 0.194116409383534 | 0.388232818767069 | 0.805883590616466 |
| 25 | 0.162488676137952 | 0.324977352275904 | 0.837511323862048 |
| 26 | 0.106188491069157 | 0.212376982138315 | 0.893811508930842 |
| 27 | 0.57606178251817 | 0.847876434963659 | 0.423938217481829 |
| 28 | 0.518800020577254 | 0.962399958845492 | 0.481199979422746 |
| 29 | 0.396952426755724 | 0.793904853511447 | 0.603047573244276 |
| 30 | 0.309181279377627 | 0.618362558755255 | 0.690818720622373 |
| 31 | 0.20162786227593 | 0.40325572455186 | 0.79837213772407 |
| 32 | 0.206557136702670 | 0.413114273405339 | 0.79344286329733 |
| 33 | 0.878547629706157 | 0.242904740587686 | 0.121452370293843 |
| Meta Analysis of Goldfeld-Quandt test for Heteroskedasticity | |||
| Description | # significant tests | % significant tests | OK/NOK |
| 1% type I error level | 0 | 0 | OK |
| 5% type I error level | 0 | 0 | OK |
| 10% type I error level | 0 | 0 | OK |