Free Statistics

of Irreproducible Research!

Author's title

Author*The author of this computation has been verified*
R Software Modulerwasp_multipleregression.wasp
Title produced by softwareMultiple Regression
Date of computationTue, 23 Nov 2010 15:05:40 +0000
Cite this page as followsStatistical Computations at FreeStatistics.org, Office for Research Development and Education, URL https://freestatistics.org/blog/index.php?v=date/2010/Nov/23/t12905246587vvsvjljfth0777.htm/, Retrieved Fri, 26 Apr 2024 13:50:37 +0000
Statistical Computations at FreeStatistics.org, Office for Research Development and Education, URL https://freestatistics.org/blog/index.php?pk=99225, Retrieved Fri, 26 Apr 2024 13:50:37 +0000
QR Codes:

Original text written by user:
IsPrivate?No (this computation is public)
User-defined keywords
Estimated Impact162
Family? (F = Feedback message, R = changed R code, M = changed R Module, P = changed Parameters, D = changed Data)
-     [Multiple Regression] [Competence to learn] [2010-11-17 07:43:53] [b98453cac15ba1066b407e146608df68]
-   PD    [Multiple Regression] [Workshop 7 - regr...] [2010-11-23 15:05:40] [0605ea080d54454c99180f574351b8e4] [Current]
Feedback Forum

Post a new message
Dataseries X:
70,5	4	370	 74
53,5	315	6166	 53
65	4	684	 68
76,5	17	449	 80
70	8	643	 72
71	56	1551	 74
60,5	15	616	 61
51,5	503	36660 53
78	26	403	 82
76	26	346	 79
57,5	44	2471	 58
61	24	7427	 63
64,5	23	2992	 65
78,5	38	233	 82
79	18	609	 82
61	96	7615	 63
70	90	370	 73
70	49	1066	 73
72	66	600	 76
64,5	21	4873	 66
54,5	592	3485	 56
56,5	73	2364	 57
64,5	14	1016	 67
64,5	88	1062	 67
73	39	480	 77
72	6	559	 75
69	32	259	 74
64	11	1340	 67
78,5	26	275	 82
53	23	12550 54
75	32	965	 78
52,5	NA	25229 55
68,5	11	4883	 71
70	5	1189	 72
70,5	3	226	 75
76	3	611	 79
75,5	13	404	 79
74,5	56	576	 78
65	29	3096	 67
54	NA	23193 56


Summary of computational transaction
Raw Inputview raw input (R code)
Raw Outputview raw output of R engine
Computing time6 seconds
R Server'Gwilym Jenkins' @ 72.249.127.135

\begin{tabular}{lllllllll}
\hline
Summary of computational transaction \tabularnewline
Raw Input & view raw input (R code)  \tabularnewline
Raw Output & view raw output of R engine  \tabularnewline
Computing time & 6 seconds \tabularnewline
R Server & 'Gwilym Jenkins' @ 72.249.127.135 \tabularnewline
\hline
\end{tabular}
%Source: https://freestatistics.org/blog/index.php?pk=99225&T=0

[TABLE]
[ROW][C]Summary of computational transaction[/C][/ROW]
[ROW][C]Raw Input[/C][C]view raw input (R code) [/C][/ROW]
[ROW][C]Raw Output[/C][C]view raw output of R engine [/C][/ROW]
[ROW][C]Computing time[/C][C]6 seconds[/C][/ROW]
[ROW][C]R Server[/C][C]'Gwilym Jenkins' @ 72.249.127.135[/C][/ROW]
[/TABLE]
Source: https://freestatistics.org/blog/index.php?pk=99225&T=0

Globally Unique Identifier (entire table): ba.freestatistics.org/blog/index.php?pk=99225&T=0

As an alternative you can also use a QR Code:  

The GUIDs for individual cells are displayed in the table below:

Summary of computational transaction
Raw Inputview raw input (R code)
Raw Outputview raw output of R engine
Computing time6 seconds
R Server'Gwilym Jenkins' @ 72.249.127.135


Multiple Linear Regression - Estimated Regression Equation
Yt[t] = + 6.82028397111565 -0.000866398623699218X1t[t] -2.24244160966131e-05X2t[t] + 0.8684484666401X3t[t] + e[t]

\begin{tabular}{lllllllll}
\hline
Multiple Linear Regression - Estimated Regression Equation \tabularnewline
Yt[t] =  +  6.82028397111565 -0.000866398623699218X1t[t] -2.24244160966131e-05X2t[t] +  0.8684484666401X3t[t]  + e[t] \tabularnewline
\hline
\end{tabular}
%Source: https://freestatistics.org/blog/index.php?pk=99225&T=1

[TABLE]
[ROW][C]Multiple Linear Regression - Estimated Regression Equation[/C][/ROW]
[ROW][C]Yt[t] =  +  6.82028397111565 -0.000866398623699218X1t[t] -2.24244160966131e-05X2t[t] +  0.8684484666401X3t[t]  + e[t][/C][/ROW]
[/TABLE]
Source: https://freestatistics.org/blog/index.php?pk=99225&T=1

Globally Unique Identifier (entire table): ba.freestatistics.org/blog/index.php?pk=99225&T=1

As an alternative you can also use a QR Code:  

The GUIDs for individual cells are displayed in the table below:

Multiple Linear Regression - Estimated Regression Equation
Yt[t] = + 6.82028397111565 -0.000866398623699218X1t[t] -2.24244160966131e-05X2t[t] + 0.8684484666401X3t[t] + e[t]


Multiple Linear Regression - Ordinary Least Squares
VariableParameterS.D.T-STATH0: parameter = 02-tail p-value1-tail p-value
(Intercept)6.820283971115651.270915.36656e-063e-06
X1t-0.0008663986236992180.001219-0.71090.4819990.241
X2t-2.24244160966131e-052.6e-05-0.87880.3856780.192839
X3t0.86844846664010.01723350.395300

\begin{tabular}{lllllllll}
\hline
Multiple Linear Regression - Ordinary Least Squares \tabularnewline
Variable & Parameter & S.D. & T-STATH0: parameter = 0 & 2-tail p-value & 1-tail p-value \tabularnewline
(Intercept) & 6.82028397111565 & 1.27091 & 5.3665 & 6e-06 & 3e-06 \tabularnewline
X1t & -0.000866398623699218 & 0.001219 & -0.7109 & 0.481999 & 0.241 \tabularnewline
X2t & -2.24244160966131e-05 & 2.6e-05 & -0.8788 & 0.385678 & 0.192839 \tabularnewline
X3t & 0.8684484666401 & 0.017233 & 50.3953 & 0 & 0 \tabularnewline
\hline
\end{tabular}
%Source: https://freestatistics.org/blog/index.php?pk=99225&T=2

[TABLE]
[ROW][C]Multiple Linear Regression - Ordinary Least Squares[/C][/ROW]
[ROW][C]Variable[/C][C]Parameter[/C][C]S.D.[/C][C]T-STATH0: parameter = 0[/C][C]2-tail p-value[/C][C]1-tail p-value[/C][/ROW]
[ROW][C](Intercept)[/C][C]6.82028397111565[/C][C]1.27091[/C][C]5.3665[/C][C]6e-06[/C][C]3e-06[/C][/ROW]
[ROW][C]X1t[/C][C]-0.000866398623699218[/C][C]0.001219[/C][C]-0.7109[/C][C]0.481999[/C][C]0.241[/C][/ROW]
[ROW][C]X2t[/C][C]-2.24244160966131e-05[/C][C]2.6e-05[/C][C]-0.8788[/C][C]0.385678[/C][C]0.192839[/C][/ROW]
[ROW][C]X3t[/C][C]0.8684484666401[/C][C]0.017233[/C][C]50.3953[/C][C]0[/C][C]0[/C][/ROW]
[/TABLE]
Source: https://freestatistics.org/blog/index.php?pk=99225&T=2

Globally Unique Identifier (entire table): ba.freestatistics.org/blog/index.php?pk=99225&T=2

As an alternative you can also use a QR Code:  

The GUIDs for individual cells are displayed in the table below:

Multiple Linear Regression - Ordinary Least Squares
VariableParameterS.D.T-STATH0: parameter = 02-tail p-value1-tail p-value
(Intercept)6.820283971115651.270915.36656e-063e-06
X1t-0.0008663986236992180.001219-0.71090.4819990.241
X2t-2.24244160966131e-052.6e-05-0.87880.3856780.192839
X3t0.86844846664010.01723350.395300


Multiple Linear Regression - Regression Statistics
Multiple R0.996094246400062
R-squared0.992203747711308
Adjusted R-squared0.9915158430976
F-TEST (value)1442.35658249604
F-TEST (DF numerator)3
F-TEST (DF denominator)34
p-value0
Multiple Linear Regression - Residual Statistics
Residual Standard Deviation0.718659545870548
Sum Squared Residuals17.5600324576093

\begin{tabular}{lllllllll}
\hline
Multiple Linear Regression - Regression Statistics \tabularnewline
Multiple R & 0.996094246400062 \tabularnewline
R-squared & 0.992203747711308 \tabularnewline
Adjusted R-squared & 0.9915158430976 \tabularnewline
F-TEST (value) & 1442.35658249604 \tabularnewline
F-TEST (DF numerator) & 3 \tabularnewline
F-TEST (DF denominator) & 34 \tabularnewline
p-value & 0 \tabularnewline
Multiple Linear Regression - Residual Statistics \tabularnewline
Residual Standard Deviation & 0.718659545870548 \tabularnewline
Sum Squared Residuals & 17.5600324576093 \tabularnewline
\hline
\end{tabular}
%Source: https://freestatistics.org/blog/index.php?pk=99225&T=3

[TABLE]
[ROW][C]Multiple Linear Regression - Regression Statistics[/C][/ROW]
[ROW][C]Multiple R[/C][C]0.996094246400062[/C][/ROW]
[ROW][C]R-squared[/C][C]0.992203747711308[/C][/ROW]
[ROW][C]Adjusted R-squared[/C][C]0.9915158430976[/C][/ROW]
[ROW][C]F-TEST (value)[/C][C]1442.35658249604[/C][/ROW]
[ROW][C]F-TEST (DF numerator)[/C][C]3[/C][/ROW]
[ROW][C]F-TEST (DF denominator)[/C][C]34[/C][/ROW]
[ROW][C]p-value[/C][C]0[/C][/ROW]
[ROW][C]Multiple Linear Regression - Residual Statistics[/C][/ROW]
[ROW][C]Residual Standard Deviation[/C][C]0.718659545870548[/C][/ROW]
[ROW][C]Sum Squared Residuals[/C][C]17.5600324576093[/C][/ROW]
[/TABLE]
Source: https://freestatistics.org/blog/index.php?pk=99225&T=3

Globally Unique Identifier (entire table): ba.freestatistics.org/blog/index.php?pk=99225&T=3

As an alternative you can also use a QR Code:  

The GUIDs for individual cells are displayed in the table below:

Multiple Linear Regression - Regression Statistics
Multiple R0.996094246400062
R-squared0.992203747711308
Adjusted R-squared0.9915158430976
F-TEST (value)1442.35658249604
F-TEST (DF numerator)3
F-TEST (DF denominator)34
p-value0
Multiple Linear Regression - Residual Statistics
Residual Standard Deviation0.718659545870548
Sum Squared Residuals17.5600324576093


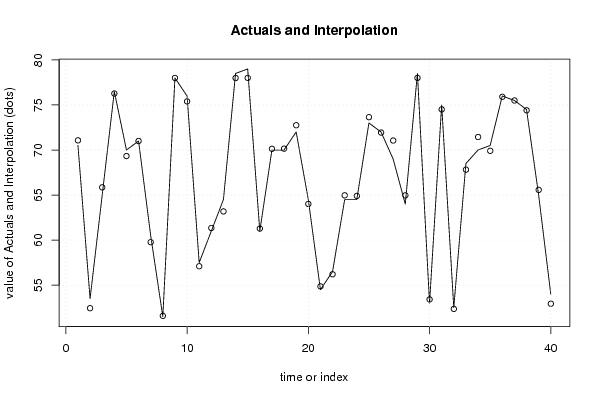
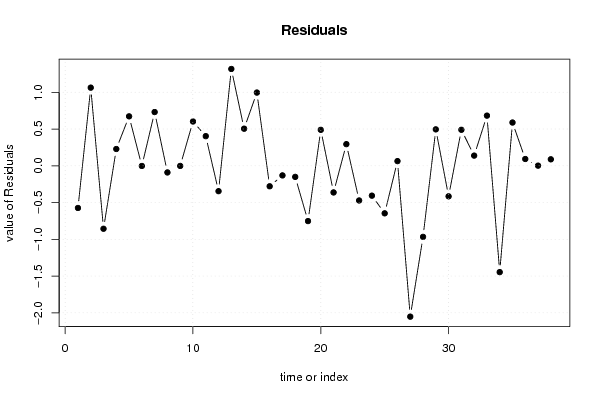
Multiple Linear Regression - Actuals, Interpolation, and Residuals
Time or IndexActualsInterpolationForecastResidualsPrediction Error
170.571.0737078740322-0.573707874032242
253.552.43686818692391.06313181307607
36565.8559758075375-0.855975807537503
476.576.27136396289330.228636037106703
57069.32722348066310.672776519336934
67171.00217191019-0.00217191018997663
760.559.76883101649070.731168983509307
851.551.5901751012184-0.0901751012183532
97878.0014948317007-0.00149483170065552
107675.39742762349790.602572376502134
1157.557.09676276462390.403237235376100
126161.3451976641236-0.345197664123567
1364.563.1824132814161.31758671858406
1478.577.99491019895270.505089801047311
157978.00380659097430.996193409025652
166161.278601172991-0.278601172991058
177070.1307491257542-0.130749125754203
187070.1506640757226-0.150664075722629
197272.7517304769411-0.751730476941061
2064.564.01041421862570.489585781374291
2154.554.8623410276346-0.362341027634558
2256.556.20558815041890.294411849581139
2364.564.9714184485163-0.471418448516340
2464.564.9062734272221-0.406273427222152
257373.6462626363526-0.646262636352633
267271.93618532878290.0638146712171233
276971.0519378227556-2.05193782275558
286464.9667521335721-0.966752133572135
2978.578.0043651569610.495634843038977
305353.4151475793234-0.415147579323424
317574.50990005155180.490099948448232
3252.552.36109629390220.13890370609777
3368.567.81757894534540.682421054654587
347071.4462518552141-1.44625185521415
3570.569.91141232157730.588587678422653
367675.90739018947240.0926098105276465
3775.575.49782958244460.00217041755543008
3874.574.41177968367990.0882203163201044
3965NANA
4054NANA

\begin{tabular}{lllllllll}
\hline
Multiple Linear Regression - Actuals, Interpolation, and Residuals \tabularnewline
Time or Index & Actuals & InterpolationForecast & ResidualsPrediction Error \tabularnewline
1 & 70.5 & 71.0737078740322 & -0.573707874032242 \tabularnewline
2 & 53.5 & 52.4368681869239 & 1.06313181307607 \tabularnewline
3 & 65 & 65.8559758075375 & -0.855975807537503 \tabularnewline
4 & 76.5 & 76.2713639628933 & 0.228636037106703 \tabularnewline
5 & 70 & 69.3272234806631 & 0.672776519336934 \tabularnewline
6 & 71 & 71.00217191019 & -0.00217191018997663 \tabularnewline
7 & 60.5 & 59.7688310164907 & 0.731168983509307 \tabularnewline
8 & 51.5 & 51.5901751012184 & -0.0901751012183532 \tabularnewline
9 & 78 & 78.0014948317007 & -0.00149483170065552 \tabularnewline
10 & 76 & 75.3974276234979 & 0.602572376502134 \tabularnewline
11 & 57.5 & 57.0967627646239 & 0.403237235376100 \tabularnewline
12 & 61 & 61.3451976641236 & -0.345197664123567 \tabularnewline
13 & 64.5 & 63.182413281416 & 1.31758671858406 \tabularnewline
14 & 78.5 & 77.9949101989527 & 0.505089801047311 \tabularnewline
15 & 79 & 78.0038065909743 & 0.996193409025652 \tabularnewline
16 & 61 & 61.278601172991 & -0.278601172991058 \tabularnewline
17 & 70 & 70.1307491257542 & -0.130749125754203 \tabularnewline
18 & 70 & 70.1506640757226 & -0.150664075722629 \tabularnewline
19 & 72 & 72.7517304769411 & -0.751730476941061 \tabularnewline
20 & 64.5 & 64.0104142186257 & 0.489585781374291 \tabularnewline
21 & 54.5 & 54.8623410276346 & -0.362341027634558 \tabularnewline
22 & 56.5 & 56.2055881504189 & 0.294411849581139 \tabularnewline
23 & 64.5 & 64.9714184485163 & -0.471418448516340 \tabularnewline
24 & 64.5 & 64.9062734272221 & -0.406273427222152 \tabularnewline
25 & 73 & 73.6462626363526 & -0.646262636352633 \tabularnewline
26 & 72 & 71.9361853287829 & 0.0638146712171233 \tabularnewline
27 & 69 & 71.0519378227556 & -2.05193782275558 \tabularnewline
28 & 64 & 64.9667521335721 & -0.966752133572135 \tabularnewline
29 & 78.5 & 78.004365156961 & 0.495634843038977 \tabularnewline
30 & 53 & 53.4151475793234 & -0.415147579323424 \tabularnewline
31 & 75 & 74.5099000515518 & 0.490099948448232 \tabularnewline
32 & 52.5 & 52.3610962939022 & 0.13890370609777 \tabularnewline
33 & 68.5 & 67.8175789453454 & 0.682421054654587 \tabularnewline
34 & 70 & 71.4462518552141 & -1.44625185521415 \tabularnewline
35 & 70.5 & 69.9114123215773 & 0.588587678422653 \tabularnewline
36 & 76 & 75.9073901894724 & 0.0926098105276465 \tabularnewline
37 & 75.5 & 75.4978295824446 & 0.00217041755543008 \tabularnewline
38 & 74.5 & 74.4117796836799 & 0.0882203163201044 \tabularnewline
39 & 65 & NA & NA \tabularnewline
40 & 54 & NA & NA \tabularnewline
\hline
\end{tabular}
%Source: https://freestatistics.org/blog/index.php?pk=99225&T=4

[TABLE]
[ROW][C]Multiple Linear Regression - Actuals, Interpolation, and Residuals[/C][/ROW]
[ROW][C]Time or Index[/C][C]Actuals[/C][C]InterpolationForecast[/C][C]ResidualsPrediction Error[/C][/ROW]
[ROW][C]1[/C][C]70.5[/C][C]71.0737078740322[/C][C]-0.573707874032242[/C][/ROW]
[ROW][C]2[/C][C]53.5[/C][C]52.4368681869239[/C][C]1.06313181307607[/C][/ROW]
[ROW][C]3[/C][C]65[/C][C]65.8559758075375[/C][C]-0.855975807537503[/C][/ROW]
[ROW][C]4[/C][C]76.5[/C][C]76.2713639628933[/C][C]0.228636037106703[/C][/ROW]
[ROW][C]5[/C][C]70[/C][C]69.3272234806631[/C][C]0.672776519336934[/C][/ROW]
[ROW][C]6[/C][C]71[/C][C]71.00217191019[/C][C]-0.00217191018997663[/C][/ROW]
[ROW][C]7[/C][C]60.5[/C][C]59.7688310164907[/C][C]0.731168983509307[/C][/ROW]
[ROW][C]8[/C][C]51.5[/C][C]51.5901751012184[/C][C]-0.0901751012183532[/C][/ROW]
[ROW][C]9[/C][C]78[/C][C]78.0014948317007[/C][C]-0.00149483170065552[/C][/ROW]
[ROW][C]10[/C][C]76[/C][C]75.3974276234979[/C][C]0.602572376502134[/C][/ROW]
[ROW][C]11[/C][C]57.5[/C][C]57.0967627646239[/C][C]0.403237235376100[/C][/ROW]
[ROW][C]12[/C][C]61[/C][C]61.3451976641236[/C][C]-0.345197664123567[/C][/ROW]
[ROW][C]13[/C][C]64.5[/C][C]63.182413281416[/C][C]1.31758671858406[/C][/ROW]
[ROW][C]14[/C][C]78.5[/C][C]77.9949101989527[/C][C]0.505089801047311[/C][/ROW]
[ROW][C]15[/C][C]79[/C][C]78.0038065909743[/C][C]0.996193409025652[/C][/ROW]
[ROW][C]16[/C][C]61[/C][C]61.278601172991[/C][C]-0.278601172991058[/C][/ROW]
[ROW][C]17[/C][C]70[/C][C]70.1307491257542[/C][C]-0.130749125754203[/C][/ROW]
[ROW][C]18[/C][C]70[/C][C]70.1506640757226[/C][C]-0.150664075722629[/C][/ROW]
[ROW][C]19[/C][C]72[/C][C]72.7517304769411[/C][C]-0.751730476941061[/C][/ROW]
[ROW][C]20[/C][C]64.5[/C][C]64.0104142186257[/C][C]0.489585781374291[/C][/ROW]
[ROW][C]21[/C][C]54.5[/C][C]54.8623410276346[/C][C]-0.362341027634558[/C][/ROW]
[ROW][C]22[/C][C]56.5[/C][C]56.2055881504189[/C][C]0.294411849581139[/C][/ROW]
[ROW][C]23[/C][C]64.5[/C][C]64.9714184485163[/C][C]-0.471418448516340[/C][/ROW]
[ROW][C]24[/C][C]64.5[/C][C]64.9062734272221[/C][C]-0.406273427222152[/C][/ROW]
[ROW][C]25[/C][C]73[/C][C]73.6462626363526[/C][C]-0.646262636352633[/C][/ROW]
[ROW][C]26[/C][C]72[/C][C]71.9361853287829[/C][C]0.0638146712171233[/C][/ROW]
[ROW][C]27[/C][C]69[/C][C]71.0519378227556[/C][C]-2.05193782275558[/C][/ROW]
[ROW][C]28[/C][C]64[/C][C]64.9667521335721[/C][C]-0.966752133572135[/C][/ROW]
[ROW][C]29[/C][C]78.5[/C][C]78.004365156961[/C][C]0.495634843038977[/C][/ROW]
[ROW][C]30[/C][C]53[/C][C]53.4151475793234[/C][C]-0.415147579323424[/C][/ROW]
[ROW][C]31[/C][C]75[/C][C]74.5099000515518[/C][C]0.490099948448232[/C][/ROW]
[ROW][C]32[/C][C]52.5[/C][C]52.3610962939022[/C][C]0.13890370609777[/C][/ROW]
[ROW][C]33[/C][C]68.5[/C][C]67.8175789453454[/C][C]0.682421054654587[/C][/ROW]
[ROW][C]34[/C][C]70[/C][C]71.4462518552141[/C][C]-1.44625185521415[/C][/ROW]
[ROW][C]35[/C][C]70.5[/C][C]69.9114123215773[/C][C]0.588587678422653[/C][/ROW]
[ROW][C]36[/C][C]76[/C][C]75.9073901894724[/C][C]0.0926098105276465[/C][/ROW]
[ROW][C]37[/C][C]75.5[/C][C]75.4978295824446[/C][C]0.00217041755543008[/C][/ROW]
[ROW][C]38[/C][C]74.5[/C][C]74.4117796836799[/C][C]0.0882203163201044[/C][/ROW]
[ROW][C]39[/C][C]65[/C][C]NA[/C][C]NA[/C][/ROW]
[ROW][C]40[/C][C]54[/C][C]NA[/C][C]NA[/C][/ROW]
[/TABLE]
Source: https://freestatistics.org/blog/index.php?pk=99225&T=4

Globally Unique Identifier (entire table): ba.freestatistics.org/blog/index.php?pk=99225&T=4

As an alternative you can also use a QR Code:  

The GUIDs for individual cells are displayed in the table below:

Multiple Linear Regression - Actuals, Interpolation, and Residuals
Time or IndexActualsInterpolationForecastResidualsPrediction Error
170.571.0737078740322-0.573707874032242
253.552.43686818692391.06313181307607
36565.8559758075375-0.855975807537503
476.576.27136396289330.228636037106703
57069.32722348066310.672776519336934
67171.00217191019-0.00217191018997663
760.559.76883101649070.731168983509307
851.551.5901751012184-0.0901751012183532
97878.0014948317007-0.00149483170065552
107675.39742762349790.602572376502134
1157.557.09676276462390.403237235376100
126161.3451976641236-0.345197664123567
1364.563.1824132814161.31758671858406
1478.577.99491019895270.505089801047311
157978.00380659097430.996193409025652
166161.278601172991-0.278601172991058
177070.1307491257542-0.130749125754203
187070.1506640757226-0.150664075722629
197272.7517304769411-0.751730476941061
2064.564.01041421862570.489585781374291
2154.554.8623410276346-0.362341027634558
2256.556.20558815041890.294411849581139
2364.564.9714184485163-0.471418448516340
2464.564.9062734272221-0.406273427222152
257373.6462626363526-0.646262636352633
267271.93618532878290.0638146712171233
276971.0519378227556-2.05193782275558
286464.9667521335721-0.966752133572135
2978.578.0043651569610.495634843038977
305353.4151475793234-0.415147579323424
317574.50990005155180.490099948448232
3252.552.36109629390220.13890370609777
3368.567.81757894534540.682421054654587
347071.4462518552141-1.44625185521415
3570.569.91141232157730.588587678422653
367675.90739018947240.0926098105276465
3775.575.49782958244460.00217041755543008
3874.574.41177968367990.0882203163201044
3965NANA
4054NANA


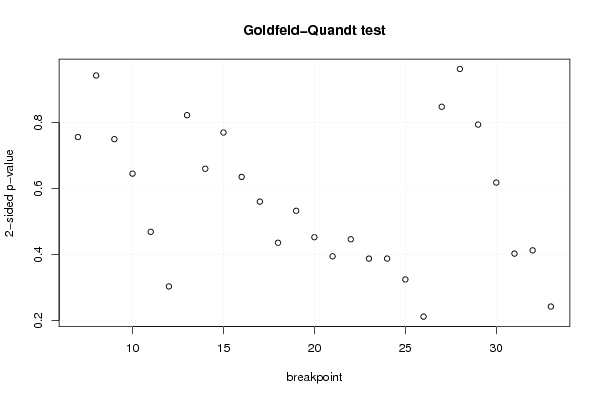
Goldfeld-Quandt test for Heteroskedasticity
p-valuesAlternative Hypothesis
breakpoint indexgreater2-sidedless
70.6218940941708130.7562118116583750.378105905829187
80.528714425301580.942571149396840.47128557469842
90.3748903719305870.7497807438611750.625109628069413
100.3227079121737170.6454158243474340.677292087826283
110.2346255076936940.4692510153873870.765374492306306
120.1519846300456750.303969260091350.848015369954325
130.4112227459483240.8224454918966480.588777254051676
140.3300928524104790.6601857048209580.669907147589521
150.3849715403090980.7699430806181950.615028459690902
160.3177325584815030.6354651169630070.682267441518497
170.2803221089932830.5606442179865650.719677891006717
180.2180360522969750.4360721045939510.781963947703025
190.2664393767642720.5328787535285440.733560623235728
200.2264829687704940.4529659375409880.773517031229506
210.1975435899887220.3950871799774440.802456410011278
220.2233100029332220.4466200058664440.776689997066778
230.194018980033120.388037960066240.80598101996688
240.1941164093835340.3882328187670690.805883590616466
250.1624886761379520.3249773522759040.837511323862048
260.1061884910691570.2123769821383150.893811508930842
270.576061782518170.8478764349636590.423938217481829
280.5188000205772540.9623999588454920.481199979422746
290.3969524267557240.7939048535114470.603047573244276
300.3091812793776270.6183625587552550.690818720622373
310.201627862275930.403255724551860.79837213772407
320.2065571367026700.4131142734053390.79344286329733
330.8785476297061570.2429047405876860.121452370293843

\begin{tabular}{lllllllll}
\hline
Goldfeld-Quandt test for Heteroskedasticity \tabularnewline
p-values & Alternative Hypothesis \tabularnewline
breakpoint index & greater & 2-sided & less \tabularnewline
7 & 0.621894094170813 & 0.756211811658375 & 0.378105905829187 \tabularnewline
8 & 0.52871442530158 & 0.94257114939684 & 0.47128557469842 \tabularnewline
9 & 0.374890371930587 & 0.749780743861175 & 0.625109628069413 \tabularnewline
10 & 0.322707912173717 & 0.645415824347434 & 0.677292087826283 \tabularnewline
11 & 0.234625507693694 & 0.469251015387387 & 0.765374492306306 \tabularnewline
12 & 0.151984630045675 & 0.30396926009135 & 0.848015369954325 \tabularnewline
13 & 0.411222745948324 & 0.822445491896648 & 0.588777254051676 \tabularnewline
14 & 0.330092852410479 & 0.660185704820958 & 0.669907147589521 \tabularnewline
15 & 0.384971540309098 & 0.769943080618195 & 0.615028459690902 \tabularnewline
16 & 0.317732558481503 & 0.635465116963007 & 0.682267441518497 \tabularnewline
17 & 0.280322108993283 & 0.560644217986565 & 0.719677891006717 \tabularnewline
18 & 0.218036052296975 & 0.436072104593951 & 0.781963947703025 \tabularnewline
19 & 0.266439376764272 & 0.532878753528544 & 0.733560623235728 \tabularnewline
20 & 0.226482968770494 & 0.452965937540988 & 0.773517031229506 \tabularnewline
21 & 0.197543589988722 & 0.395087179977444 & 0.802456410011278 \tabularnewline
22 & 0.223310002933222 & 0.446620005866444 & 0.776689997066778 \tabularnewline
23 & 0.19401898003312 & 0.38803796006624 & 0.80598101996688 \tabularnewline
24 & 0.194116409383534 & 0.388232818767069 & 0.805883590616466 \tabularnewline
25 & 0.162488676137952 & 0.324977352275904 & 0.837511323862048 \tabularnewline
26 & 0.106188491069157 & 0.212376982138315 & 0.893811508930842 \tabularnewline
27 & 0.57606178251817 & 0.847876434963659 & 0.423938217481829 \tabularnewline
28 & 0.518800020577254 & 0.962399958845492 & 0.481199979422746 \tabularnewline
29 & 0.396952426755724 & 0.793904853511447 & 0.603047573244276 \tabularnewline
30 & 0.309181279377627 & 0.618362558755255 & 0.690818720622373 \tabularnewline
31 & 0.20162786227593 & 0.40325572455186 & 0.79837213772407 \tabularnewline
32 & 0.206557136702670 & 0.413114273405339 & 0.79344286329733 \tabularnewline
33 & 0.878547629706157 & 0.242904740587686 & 0.121452370293843 \tabularnewline
\hline
\end{tabular}
%Source: https://freestatistics.org/blog/index.php?pk=99225&T=5

[TABLE]
[ROW][C]Goldfeld-Quandt test for Heteroskedasticity[/C][/ROW]
[ROW][C]p-values[/C][C]Alternative Hypothesis[/C][/ROW]
[ROW][C]breakpoint index[/C][C]greater[/C][C]2-sided[/C][C]less[/C][/ROW]
[ROW][C]7[/C][C]0.621894094170813[/C][C]0.756211811658375[/C][C]0.378105905829187[/C][/ROW]
[ROW][C]8[/C][C]0.52871442530158[/C][C]0.94257114939684[/C][C]0.47128557469842[/C][/ROW]
[ROW][C]9[/C][C]0.374890371930587[/C][C]0.749780743861175[/C][C]0.625109628069413[/C][/ROW]
[ROW][C]10[/C][C]0.322707912173717[/C][C]0.645415824347434[/C][C]0.677292087826283[/C][/ROW]
[ROW][C]11[/C][C]0.234625507693694[/C][C]0.469251015387387[/C][C]0.765374492306306[/C][/ROW]
[ROW][C]12[/C][C]0.151984630045675[/C][C]0.30396926009135[/C][C]0.848015369954325[/C][/ROW]
[ROW][C]13[/C][C]0.411222745948324[/C][C]0.822445491896648[/C][C]0.588777254051676[/C][/ROW]
[ROW][C]14[/C][C]0.330092852410479[/C][C]0.660185704820958[/C][C]0.669907147589521[/C][/ROW]
[ROW][C]15[/C][C]0.384971540309098[/C][C]0.769943080618195[/C][C]0.615028459690902[/C][/ROW]
[ROW][C]16[/C][C]0.317732558481503[/C][C]0.635465116963007[/C][C]0.682267441518497[/C][/ROW]
[ROW][C]17[/C][C]0.280322108993283[/C][C]0.560644217986565[/C][C]0.719677891006717[/C][/ROW]
[ROW][C]18[/C][C]0.218036052296975[/C][C]0.436072104593951[/C][C]0.781963947703025[/C][/ROW]
[ROW][C]19[/C][C]0.266439376764272[/C][C]0.532878753528544[/C][C]0.733560623235728[/C][/ROW]
[ROW][C]20[/C][C]0.226482968770494[/C][C]0.452965937540988[/C][C]0.773517031229506[/C][/ROW]
[ROW][C]21[/C][C]0.197543589988722[/C][C]0.395087179977444[/C][C]0.802456410011278[/C][/ROW]
[ROW][C]22[/C][C]0.223310002933222[/C][C]0.446620005866444[/C][C]0.776689997066778[/C][/ROW]
[ROW][C]23[/C][C]0.19401898003312[/C][C]0.38803796006624[/C][C]0.80598101996688[/C][/ROW]
[ROW][C]24[/C][C]0.194116409383534[/C][C]0.388232818767069[/C][C]0.805883590616466[/C][/ROW]
[ROW][C]25[/C][C]0.162488676137952[/C][C]0.324977352275904[/C][C]0.837511323862048[/C][/ROW]
[ROW][C]26[/C][C]0.106188491069157[/C][C]0.212376982138315[/C][C]0.893811508930842[/C][/ROW]
[ROW][C]27[/C][C]0.57606178251817[/C][C]0.847876434963659[/C][C]0.423938217481829[/C][/ROW]
[ROW][C]28[/C][C]0.518800020577254[/C][C]0.962399958845492[/C][C]0.481199979422746[/C][/ROW]
[ROW][C]29[/C][C]0.396952426755724[/C][C]0.793904853511447[/C][C]0.603047573244276[/C][/ROW]
[ROW][C]30[/C][C]0.309181279377627[/C][C]0.618362558755255[/C][C]0.690818720622373[/C][/ROW]
[ROW][C]31[/C][C]0.20162786227593[/C][C]0.40325572455186[/C][C]0.79837213772407[/C][/ROW]
[ROW][C]32[/C][C]0.206557136702670[/C][C]0.413114273405339[/C][C]0.79344286329733[/C][/ROW]
[ROW][C]33[/C][C]0.878547629706157[/C][C]0.242904740587686[/C][C]0.121452370293843[/C][/ROW]
[/TABLE]
Source: https://freestatistics.org/blog/index.php?pk=99225&T=5

Globally Unique Identifier (entire table): ba.freestatistics.org/blog/index.php?pk=99225&T=5

As an alternative you can also use a QR Code:  

The GUIDs for individual cells are displayed in the table below:

Goldfeld-Quandt test for Heteroskedasticity
p-valuesAlternative Hypothesis
breakpoint indexgreater2-sidedless
70.6218940941708130.7562118116583750.378105905829187
80.528714425301580.942571149396840.47128557469842
90.3748903719305870.7497807438611750.625109628069413
100.3227079121737170.6454158243474340.677292087826283
110.2346255076936940.4692510153873870.765374492306306
120.1519846300456750.303969260091350.848015369954325
130.4112227459483240.8224454918966480.588777254051676
140.3300928524104790.6601857048209580.669907147589521
150.3849715403090980.7699430806181950.615028459690902
160.3177325584815030.6354651169630070.682267441518497
170.2803221089932830.5606442179865650.719677891006717
180.2180360522969750.4360721045939510.781963947703025
190.2664393767642720.5328787535285440.733560623235728
200.2264829687704940.4529659375409880.773517031229506
210.1975435899887220.3950871799774440.802456410011278
220.2233100029332220.4466200058664440.776689997066778
230.194018980033120.388037960066240.80598101996688
240.1941164093835340.3882328187670690.805883590616466
250.1624886761379520.3249773522759040.837511323862048
260.1061884910691570.2123769821383150.893811508930842
270.576061782518170.8478764349636590.423938217481829
280.5188000205772540.9623999588454920.481199979422746
290.3969524267557240.7939048535114470.603047573244276
300.3091812793776270.6183625587552550.690818720622373
310.201627862275930.403255724551860.79837213772407
320.2065571367026700.4131142734053390.79344286329733
330.8785476297061570.2429047405876860.121452370293843


Meta Analysis of Goldfeld-Quandt test for Heteroskedasticity
Description# significant tests% significant testsOK/NOK
1% type I error level00OK
5% type I error level00OK
10% type I error level00OK

\begin{tabular}{lllllllll}
\hline
Meta Analysis of Goldfeld-Quandt test for Heteroskedasticity \tabularnewline
Description & # significant tests & % significant tests & OK/NOK \tabularnewline
1% type I error level & 0 & 0 & OK \tabularnewline
5% type I error level & 0 & 0 & OK \tabularnewline
10% type I error level & 0 & 0 & OK \tabularnewline
\hline
\end{tabular}
%Source: https://freestatistics.org/blog/index.php?pk=99225&T=6

[TABLE]
[ROW][C]Meta Analysis of Goldfeld-Quandt test for Heteroskedasticity[/C][/ROW]
[ROW][C]Description[/C][C]# significant tests[/C][C]% significant tests[/C][C]OK/NOK[/C][/ROW]
[ROW][C]1% type I error level[/C][C]0[/C][C]0[/C][C]OK[/C][/ROW]
[ROW][C]5% type I error level[/C][C]0[/C][C]0[/C][C]OK[/C][/ROW]
[ROW][C]10% type I error level[/C][C]0[/C][C]0[/C][C]OK[/C][/ROW]
[/TABLE]
Source: https://freestatistics.org/blog/index.php?pk=99225&T=6

Globally Unique Identifier (entire table): ba.freestatistics.org/blog/index.php?pk=99225&T=6

As an alternative you can also use a QR Code:  

The GUIDs for individual cells are displayed in the table below:

Meta Analysis of Goldfeld-Quandt test for Heteroskedasticity
Description# significant tests% significant testsOK/NOK
1% type I error level00OK
5% type I error level00OK
10% type I error level00OK


Parameters (Session):
par1 = 1 ; par2 = Do not include Seasonal Dummies ; par3 = No Linear Trend ;
Parameters (R input):
par1 = 1 ; par2 = Do not include Seasonal Dummies ; par3 = No Linear Trend ;
R code (references can be found in the software module):
library(lattice)
library(lmtest)
n25 <- 25 #minimum number of obs. for Goldfeld-Quandt test
par1 <- as.numeric(par1)
x <- t(y)
k <- length(x[1,])
n <- length(x[,1])
x1 <- cbind(x[,par1], x[,1:k!=par1])
mycolnames <- c(colnames(x)[par1], colnames(x)[1:k!=par1])
colnames(x1) <- mycolnames #colnames(x)[par1]
x <- x1
if (par3 == 'First Differences'){
x2 <- array(0, dim=c(n-1,k), dimnames=list(1:(n-1), paste('(1-B)',colnames(x),sep='')))
for (i in 1:n-1) {
for (j in 1:k) {
x2[i,j] <- x[i+1,j] - x[i,j]
}
}
x <- x2
}
if (par2 == 'Include Monthly Dummies'){
x2 <- array(0, dim=c(n,11), dimnames=list(1:n, paste('M', seq(1:11), sep ='')))
for (i in 1:11){
x2[seq(i,n,12),i] <- 1
}
x <- cbind(x, x2)
}
if (par2 == 'Include Quarterly Dummies'){
x2 <- array(0, dim=c(n,3), dimnames=list(1:n, paste('Q', seq(1:3), sep ='')))
for (i in 1:3){
x2[seq(i,n,4),i] <- 1
}
x <- cbind(x, x2)
}
k <- length(x[1,])
if (par3 == 'Linear Trend'){
x <- cbind(x, c(1:n))
colnames(x)[k+1] <- 't'
}
x
k <- length(x[1,])
df <- as.data.frame(x)
(mylm <- lm(df))
(mysum <- summary(mylm))
if (n > n25) {
kp3 <- k + 3
nmkm3 <- n - k - 3
gqarr <- array(NA, dim=c(nmkm3-kp3+1,3))
numgqtests <- 0
numsignificant1 <- 0
numsignificant5 <- 0
numsignificant10 <- 0
for (mypoint in kp3:nmkm3) {
j <- 0
numgqtests <- numgqtests + 1
for (myalt in c('greater', 'two.sided', 'less')) {
j <- j + 1
gqarr[mypoint-kp3+1,j] <- gqtest(mylm, point=mypoint, alternative=myalt)$p.value
}
if (gqarr[mypoint-kp3+1,2] < 0.01) numsignificant1 <- numsignificant1 + 1
if (gqarr[mypoint-kp3+1,2] < 0.05) numsignificant5 <- numsignificant5 + 1
if (gqarr[mypoint-kp3+1,2] < 0.10) numsignificant10 <- numsignificant10 + 1
}
gqarr
}
bitmap(file='test0.png')
plot(x[,1], type='l', main='Actuals and Interpolation', ylab='value of Actuals and Interpolation (dots)', xlab='time or index')
points(x[,1]-mysum$resid)
grid()
dev.off()
bitmap(file='test1.png')
plot(mysum$resid, type='b', pch=19, main='Residuals', ylab='value of Residuals', xlab='time or index')
grid()
dev.off()
bitmap(file='test2.png')
hist(mysum$resid, main='Residual Histogram', xlab='values of Residuals')
grid()
dev.off()
bitmap(file='test3.png')
densityplot(~mysum$resid,col='black',main='Residual Density Plot', xlab='values of Residuals')
dev.off()
bitmap(file='test4.png')
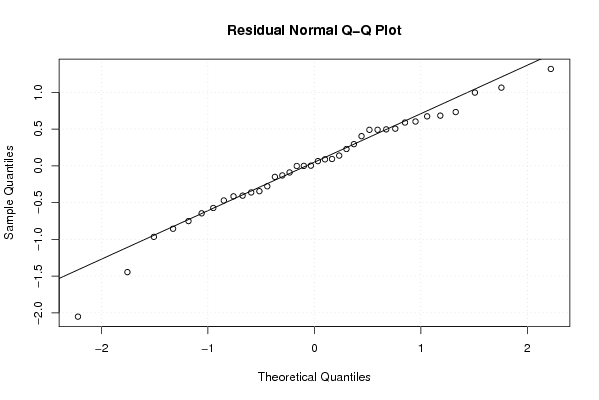
qqnorm(mysum$resid, main='Residual Normal Q-Q Plot')
qqline(mysum$resid)
grid()
dev.off()
(myerror <- as.ts(mysum$resid))
bitmap(file='test5.png')
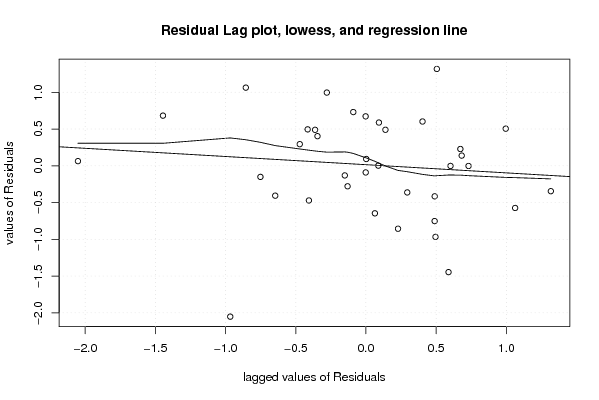
dum <- cbind(lag(myerror,k=1),myerror)
dum
dum1 <- dum[2:length(myerror),]
dum1
z <- as.data.frame(dum1)
z
plot(z,main=paste('Residual Lag plot, lowess, and regression line'), ylab='values of Residuals', xlab='lagged values of Residuals')
lines(lowess(z))
abline(lm(z))
grid()
dev.off()
bitmap(file='test6.png')
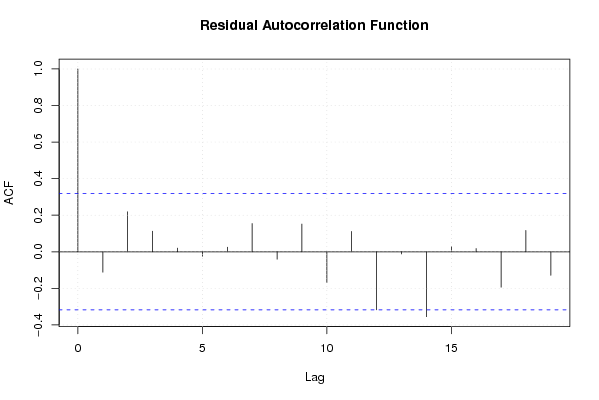
acf(mysum$resid, lag.max=length(mysum$resid)/2, main='Residual Autocorrelation Function')
grid()
dev.off()
bitmap(file='test7.png')
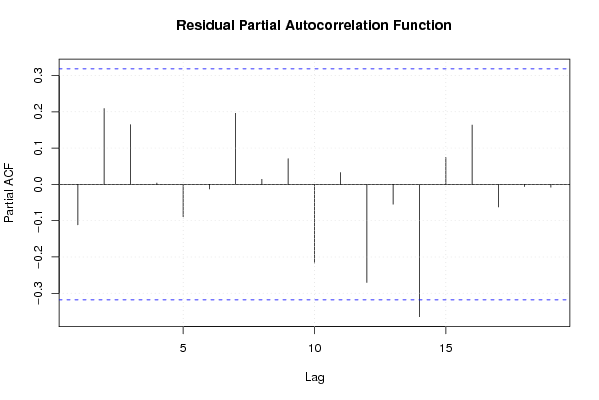
pacf(mysum$resid, lag.max=length(mysum$resid)/2, main='Residual Partial Autocorrelation Function')
grid()
dev.off()
bitmap(file='test8.png')
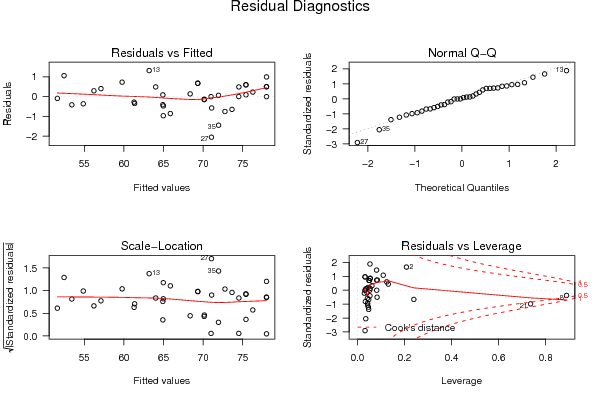
opar <- par(mfrow = c(2,2), oma = c(0, 0, 1.1, 0))
plot(mylm, las = 1, sub='Residual Diagnostics')
par(opar)
dev.off()
if (n > n25) {
bitmap(file='test9.png')
plot(kp3:nmkm3,gqarr[,2], main='Goldfeld-Quandt test',ylab='2-sided p-value',xlab='breakpoint')
grid()
dev.off()
}
load(file='createtable')
a<-table.start()
a<-table.row.start(a)
a<-table.element(a, 'Multiple Linear Regression - Estimated Regression Equation', 1, TRUE)
a<-table.row.end(a)
myeq <- colnames(x)[1]
myeq <- paste(myeq, '[t] = ', sep='')
for (i in 1:k){
if (mysum$coefficients[i,1] > 0) myeq <- paste(myeq, '+', '')
myeq <- paste(myeq, mysum$coefficients[i,1], sep=' ')
if (rownames(mysum$coefficients)[i] != '(Intercept)') {
myeq <- paste(myeq, rownames(mysum$coefficients)[i], sep='')
if (rownames(mysum$coefficients)[i] != 't') myeq <- paste(myeq, '[t]', sep='')
}
}
myeq <- paste(myeq, ' + e[t]')
a<-table.row.start(a)
a<-table.element(a, myeq)
a<-table.row.end(a)
a<-table.end(a)
table.save(a,file='mytable1.tab')
a<-table.start()
a<-table.row.start(a)
a<-table.element(a,hyperlink('ols1.htm','Multiple Linear Regression - Ordinary Least Squares',''), 6, TRUE)
a<-table.row.end(a)
a<-table.row.start(a)
a<-table.element(a,'Variable',header=TRUE)
a<-table.element(a,'Parameter',header=TRUE)
a<-table.element(a,'S.D.',header=TRUE)
a<-table.element(a,'T-STAT
H0: parameter = 0',header=TRUE)
a<-table.element(a,'2-tail p-value',header=TRUE)
a<-table.element(a,'1-tail p-value',header=TRUE)
a<-table.row.end(a)
for (i in 1:k){
a<-table.row.start(a)
a<-table.element(a,rownames(mysum$coefficients)[i],header=TRUE)
a<-table.element(a,mysum$coefficients[i,1])
a<-table.element(a, round(mysum$coefficients[i,2],6))
a<-table.element(a, round(mysum$coefficients[i,3],4))
a<-table.element(a, round(mysum$coefficients[i,4],6))
a<-table.element(a, round(mysum$coefficients[i,4]/2,6))
a<-table.row.end(a)
}
a<-table.end(a)
table.save(a,file='mytable2.tab')
a<-table.start()
a<-table.row.start(a)
a<-table.element(a, 'Multiple Linear Regression - Regression Statistics', 2, TRUE)
a<-table.row.end(a)
a<-table.row.start(a)
a<-table.element(a, 'Multiple R',1,TRUE)
a<-table.element(a, sqrt(mysum$r.squared))
a<-table.row.end(a)
a<-table.row.start(a)
a<-table.element(a, 'R-squared',1,TRUE)
a<-table.element(a, mysum$r.squared)
a<-table.row.end(a)
a<-table.row.start(a)
a<-table.element(a, 'Adjusted R-squared',1,TRUE)
a<-table.element(a, mysum$adj.r.squared)
a<-table.row.end(a)
a<-table.row.start(a)
a<-table.element(a, 'F-TEST (value)',1,TRUE)
a<-table.element(a, mysum$fstatistic[1])
a<-table.row.end(a)
a<-table.row.start(a)
a<-table.element(a, 'F-TEST (DF numerator)',1,TRUE)
a<-table.element(a, mysum$fstatistic[2])
a<-table.row.end(a)
a<-table.row.start(a)
a<-table.element(a, 'F-TEST (DF denominator)',1,TRUE)
a<-table.element(a, mysum$fstatistic[3])
a<-table.row.end(a)
a<-table.row.start(a)
a<-table.element(a, 'p-value',1,TRUE)
a<-table.element(a, 1-pf(mysum$fstatistic[1],mysum$fstatistic[2],mysum$fstatistic[3]))
a<-table.row.end(a)
a<-table.row.start(a)
a<-table.element(a, 'Multiple Linear Regression - Residual Statistics', 2, TRUE)
a<-table.row.end(a)
a<-table.row.start(a)
a<-table.element(a, 'Residual Standard Deviation',1,TRUE)
a<-table.element(a, mysum$sigma)
a<-table.row.end(a)
a<-table.row.start(a)
a<-table.element(a, 'Sum Squared Residuals',1,TRUE)
a<-table.element(a, sum(myerror*myerror))
a<-table.row.end(a)
a<-table.end(a)
table.save(a,file='mytable3.tab')
a<-table.start()
a<-table.row.start(a)
a<-table.element(a, 'Multiple Linear Regression - Actuals, Interpolation, and Residuals', 4, TRUE)
a<-table.row.end(a)
a<-table.row.start(a)
a<-table.element(a, 'Time or Index', 1, TRUE)
a<-table.element(a, 'Actuals', 1, TRUE)
a<-table.element(a, 'Interpolation
Forecast', 1, TRUE)
a<-table.element(a, 'Residuals
Prediction Error', 1, TRUE)
a<-table.row.end(a)
for (i in 1:n) {
a<-table.row.start(a)
a<-table.element(a,i, 1, TRUE)
a<-table.element(a,x[i])
a<-table.element(a,x[i]-mysum$resid[i])
a<-table.element(a,mysum$resid[i])
a<-table.row.end(a)
}
a<-table.end(a)
table.save(a,file='mytable4.tab')
if (n > n25) {
a<-table.start()
a<-table.row.start(a)
a<-table.element(a,'Goldfeld-Quandt test for Heteroskedasticity',4,TRUE)
a<-table.row.end(a)
a<-table.row.start(a)
a<-table.element(a,'p-values',header=TRUE)
a<-table.element(a,'Alternative Hypothesis',3,header=TRUE)
a<-table.row.end(a)
a<-table.row.start(a)
a<-table.element(a,'breakpoint index',header=TRUE)
a<-table.element(a,'greater',header=TRUE)
a<-table.element(a,'2-sided',header=TRUE)
a<-table.element(a,'less',header=TRUE)
a<-table.row.end(a)
for (mypoint in kp3:nmkm3) {
a<-table.row.start(a)
a<-table.element(a,mypoint,header=TRUE)
a<-table.element(a,gqarr[mypoint-kp3+1,1])
a<-table.element(a,gqarr[mypoint-kp3+1,2])
a<-table.element(a,gqarr[mypoint-kp3+1,3])
a<-table.row.end(a)
}
a<-table.end(a)
table.save(a,file='mytable5.tab')
a<-table.start()
a<-table.row.start(a)
a<-table.element(a,'Meta Analysis of Goldfeld-Quandt test for Heteroskedasticity',4,TRUE)
a<-table.row.end(a)
a<-table.row.start(a)
a<-table.element(a,'Description',header=TRUE)
a<-table.element(a,'# significant tests',header=TRUE)
a<-table.element(a,'% significant tests',header=TRUE)
a<-table.element(a,'OK/NOK',header=TRUE)
a<-table.row.end(a)
a<-table.row.start(a)
a<-table.element(a,'1% type I error level',header=TRUE)
a<-table.element(a,numsignificant1)
a<-table.element(a,numsignificant1/numgqtests)
if (numsignificant1/numgqtests < 0.01) dum <- 'OK' else dum <- 'NOK'
a<-table.element(a,dum)
a<-table.row.end(a)
a<-table.row.start(a)
a<-table.element(a,'5% type I error level',header=TRUE)
a<-table.element(a,numsignificant5)
a<-table.element(a,numsignificant5/numgqtests)
if (numsignificant5/numgqtests < 0.05) dum <- 'OK' else dum <- 'NOK'
a<-table.element(a,dum)
a<-table.row.end(a)
a<-table.row.start(a)
a<-table.element(a,'10% type I error level',header=TRUE)
a<-table.element(a,numsignificant10)
a<-table.element(a,numsignificant10/numgqtests)
if (numsignificant10/numgqtests < 0.1) dum <- 'OK' else dum <- 'NOK'
a<-table.element(a,dum)
a<-table.row.end(a)
a<-table.end(a)
table.save(a,file='mytable6.tab')
}