| Multiple Linear Regression - Estimated Regression Equation |
| Yt[t] = + 4.2429840610994e-14 -6.36935712039043e-18X1t[t] -1.75704741164974e-19X2t[t] + 0.500000000000003X3t[t] + 0.499999999999996X4t[t] + e[t] |
| Multiple Linear Regression - Ordinary Least Squares | |||||
| Variable | Parameter | S.D. | T-STAT H0: parameter = 0 | 2-tail p-value | 1-tail p-value |
| (Intercept) | 4.2429840610994e-14 | 0 | 0.4788 | 0.63527 | 0.317635 |
| X1t | -6.36935712039043e-18 | 0 | -0.1011 | 0.920079 | 0.46004 |
| X2t | -1.75704741164974e-19 | 0 | -0.1327 | 0.895237 | 0.447619 |
| X3t | 0.500000000000003 | 0 | 148780882687695 | 0 | 0 |
| X4t | 0.499999999999996 | 0 | 113640217331527 | 0 | 0 |
| Multiple Linear Regression - Regression Statistics | |
| Multiple R | 1 |
| R-squared | 1 |
| Adjusted R-squared | 1 |
| F-TEST (value) | 4.14112400322384e+29 |
| F-TEST (DF numerator) | 4 |
| F-TEST (DF denominator) | 33 |
| p-value | 0 |
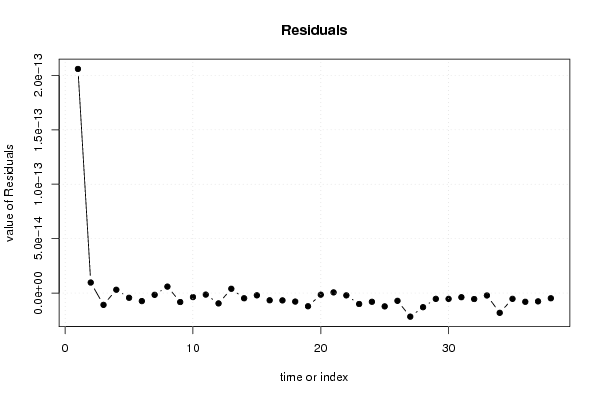
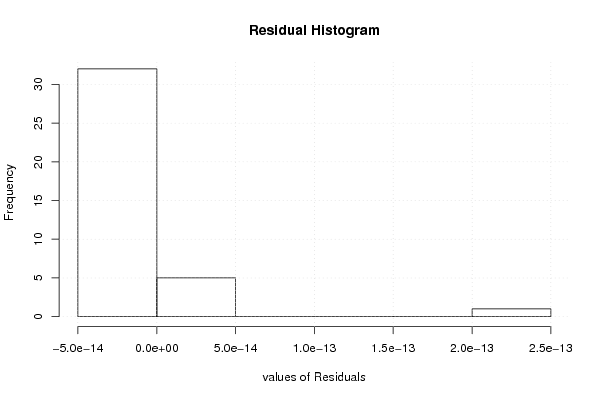
| Multiple Linear Regression - Residual Statistics | |
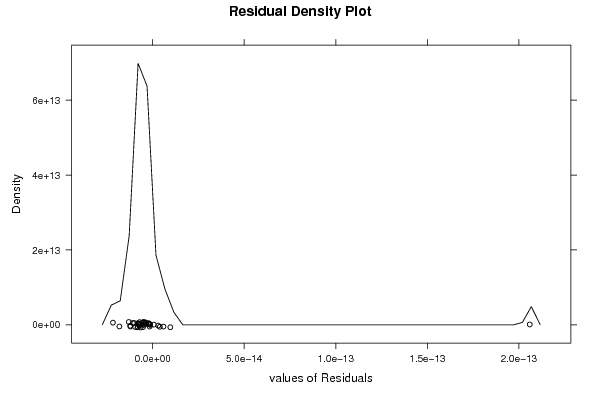
| Residual Standard Deviation | 3.68748787985642e-14 |
| Sum Squared Residuals | 4.48719706514903e-26 |
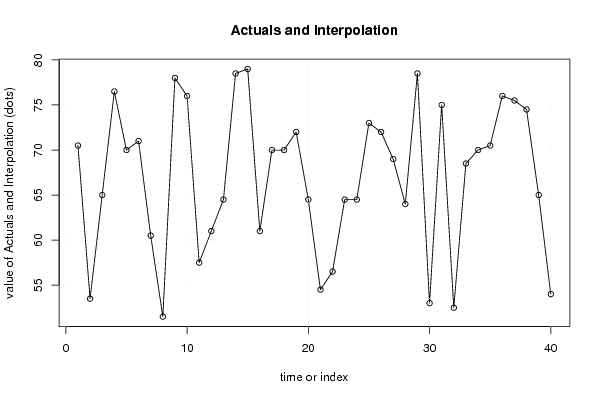
| Multiple Linear Regression - Actuals, Interpolation, and Residuals | |||
| Time or Index | Actuals | Interpolation Forecast | Residuals Prediction Error |
| 1 | 70.5 | 70.4999999999998 | 2.05922547956187e-13 |
| 2 | 53.5 | 53.5 | 9.6529075336867e-15 |
| 3 | 65 | 65 | -1.08560718488808e-14 |
| 4 | 76.5 | 76.5 | 3.05016977918883e-15 |
| 5 | 70 | 70 | -4.3395451759515e-15 |
| 6 | 71 | 71 | -7.36417557985726e-15 |
| 7 | 60.5 | 60.5 | -1.62415770801882e-15 |
| 8 | 51.5 | 51.5 | 5.9138864344201e-15 |
| 9 | 78 | 78 | -8.25283983546155e-15 |
| 10 | 76 | 76 | -3.69008610826735e-15 |
| 11 | 57.5 | 57.5 | -1.39811800271839e-15 |
| 12 | 61 | 61 | -9.524297476043e-15 |
| 13 | 64.5 | 64.5 | 3.92801366223644e-15 |
| 14 | 78.5 | 78.5 | -4.79159061153343e-15 |
| 15 | 79 | 79 | -2.0830109542487e-15 |
| 16 | 61 | 61 | -6.64331828292782e-15 |
| 17 | 70 | 70 | -6.734431314701e-15 |
| 18 | 70 | 70 | -7.82127872953583e-15 |
| 19 | 72 | 72 | -1.21300454154938e-14 |
| 20 | 64.5 | 64.5 | -1.49241078605023e-15 |
| 21 | 54.5 | 54.5 | 6.21999867204949e-16 |
| 22 | 56.5 | 56.5 | -2.12140441961525e-15 |
| 23 | 64.5 | 64.5 | -1.004470612609e-14 |
| 24 | 64.5 | 64.5 | -8.02390177152716e-15 |
| 25 | 73 | 73 | -1.22536085743201e-14 |
| 26 | 72 | 72 | -7.13625546992287e-15 |
| 27 | 69 | 69 | -2.16807628819569e-14 |
| 28 | 64 | 64 | -1.29819614728104e-14 |
| 29 | 78.5 | 78.5 | -5.33549590496607e-15 |
| 30 | 53 | 53 | -5.33822361667794e-15 |
| 31 | 75 | 75 | -3.8350082970038e-15 |
| 32 | 52.5 | 52.5 | -5.49583136391286e-15 |
| 33 | 68.5 | 68.5 | -2.19867645977501e-15 |
| 34 | 70 | 70 | -1.81510695724617e-14 |
| 35 | 70.5 | 70.5 | -5.30691918493827e-15 |
| 36 | 76 | 76 | -8.02792912918246e-15 |
| 37 | 75.5 | 75.5 | -7.63326736192379e-15 |
| 38 | 74.5 | 74.5 | -4.7791257961497e-15 |
| 39 | 65 | NA | NA |
| 40 | 54 | NA | NA |
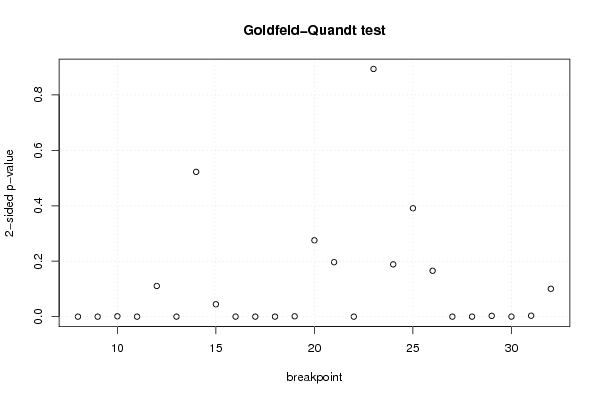
| Goldfeld-Quandt test for Heteroskedasticity | |||
| p-values | Alternative Hypothesis | ||
| breakpoint index | greater | 2-sided | less |
| 8 | 1 | 5.257862631798e-16 | 2.628931315899e-16 |
| 9 | 4.28225158935176e-07 | 8.56450317870352e-07 | 0.999999571774841 |
| 10 | 0.000684032391289873 | 0.00136806478257975 | 0.99931596760871 |
| 11 | 0.99999997208155 | 5.58368986154476e-08 | 2.79184493077238e-08 |
| 12 | 0.0553868034476745 | 0.110773606895349 | 0.944613196552325 |
| 13 | 5.59432770074149e-09 | 1.11886554014830e-08 | 0.999999994405672 |
| 14 | 0.738728028364534 | 0.522543943270933 | 0.261271971635466 |
| 15 | 0.977665707452786 | 0.0446685850944281 | 0.0223342925472141 |
| 16 | 8.33604606961433e-05 | 0.000166720921392287 | 0.999916639539304 |
| 17 | 0.999999999999931 | 1.37451981401176e-13 | 6.87259907005881e-14 |
| 18 | 0.999947760522885 | 0.000104478954230140 | 5.22394771150699e-05 |
| 19 | 0.000662670901706756 | 0.00132534180341351 | 0.999337329098293 |
| 20 | 0.862229174449088 | 0.275541651101823 | 0.137770825550912 |
| 21 | 0.901734431988188 | 0.196531136023624 | 0.0982655680118118 |
| 22 | 0.999999943686419 | 1.12627162348839e-07 | 5.63135811744197e-08 |
| 23 | 0.553064267487541 | 0.893871465024919 | 0.446935732512459 |
| 24 | 0.0943611890192348 | 0.188722378038470 | 0.905638810980765 |
| 25 | 0.804366003422373 | 0.391267993155254 | 0.195633996577627 |
| 26 | 0.082806932360678 | 0.165613864721356 | 0.917193067639322 |
| 27 | 0.99999996699409 | 6.60118195047869e-08 | 3.30059097523935e-08 |
| 28 | 0.999999852802243 | 2.94395514368969e-07 | 1.47197757184484e-07 |
| 29 | 0.99856955118907 | 0.0028608976218614 | 0.0014304488109307 |
| 30 | 5.86994858005382e-08 | 1.17398971601076e-07 | 0.999999941300514 |
| 31 | 0.998294212736312 | 0.00341157452737503 | 0.00170578726368751 |
| 32 | 0.949716541828584 | 0.100566916342832 | 0.0502834581714161 |
| Meta Analysis of Goldfeld-Quandt test for Heteroskedasticity | |||
| Description | # significant tests | % significant tests | OK/NOK |
| 1% type I error level | 15 | 0.6 | NOK |
| 5% type I error level | 16 | 0.64 | NOK |
| 10% type I error level | 16 | 0.64 | NOK |